Harlingen, NJ Map & Demographics
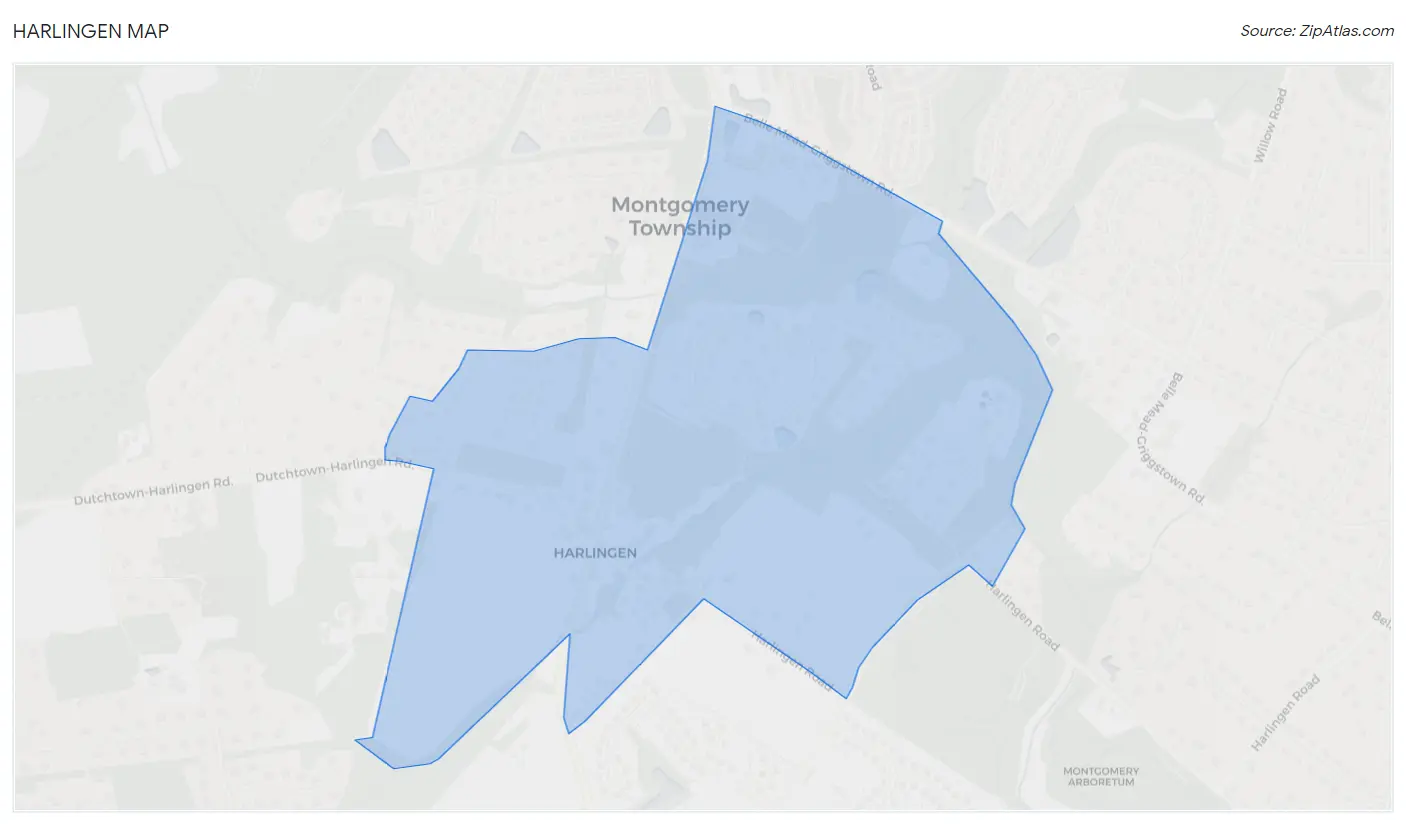
Harlingen Map
Harlingen Overview
$113,550
PER CAPITA INCOME
$235,000
AVG FAMILY INCOME
$235,000
AVG HOUSEHOLD INCOME
0.34
INEQUALITY / GINI INDEX
429
TOTAL POPULATION
234
MALE POPULATION
195
FEMALE POPULATION
120.00
MALES / 100 FEMALES
83.33
FEMALES / 100 MALES
39.7
MEDIAN AGE
3.1
AVG FAMILY SIZE
3.1
AVG HOUSEHOLD SIZE
295
LABOR FORCE [ PEOPLE ]
81.3%
PERCENT IN LABOR FORCE
3.4%
UNEMPLOYMENT RATE
Income in Harlingen
Income Overview in Harlingen
Per Capita Income in Harlingen is $113,550, while median incomes of families and households are $235,000 and $235,000 respectively.
| Characteristic | Number | Measure |
| Per Capita Income | 429 | $113,550 |
| Median Family Income | 140 | $235,000 |
| Mean Family Income | 140 | $346,767 |
| Median Household Income | 140 | $235,000 |
| Mean Household Income | 140 | $346,767 |
| Income Deficit | 140 | $0 |
| Wage / Income Gap (%) | 429 | 0.00% |
| Wage / Income Gap ($) | 429 | 100.00¢ per $1 |
| Gini / Inequality Index | 429 | 0.34 |
Earnings by Sex in Harlingen
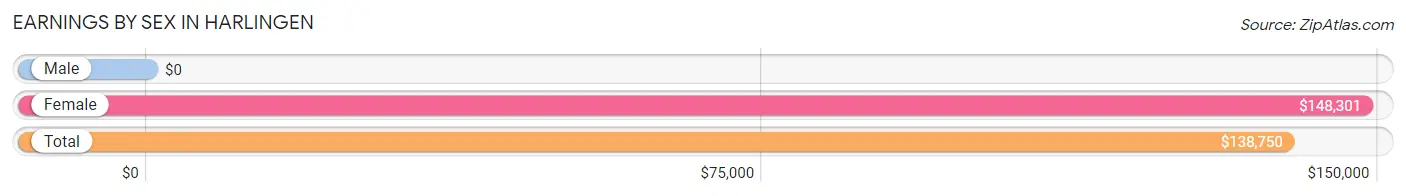
| Sex | Number | Average Earnings |
| Male | 154 (52.2%) | $0 |
| Female | 141 (47.8%) | $148,301 |
| Total | 295 (100.0%) | $138,750 |
Earnings by Sex by Income Bracket in Harlingen
The most common earnings brackets in Harlingen are $100,000+ for men (76 | 49.3%) and $100,000+ for women (115 | 81.6%).
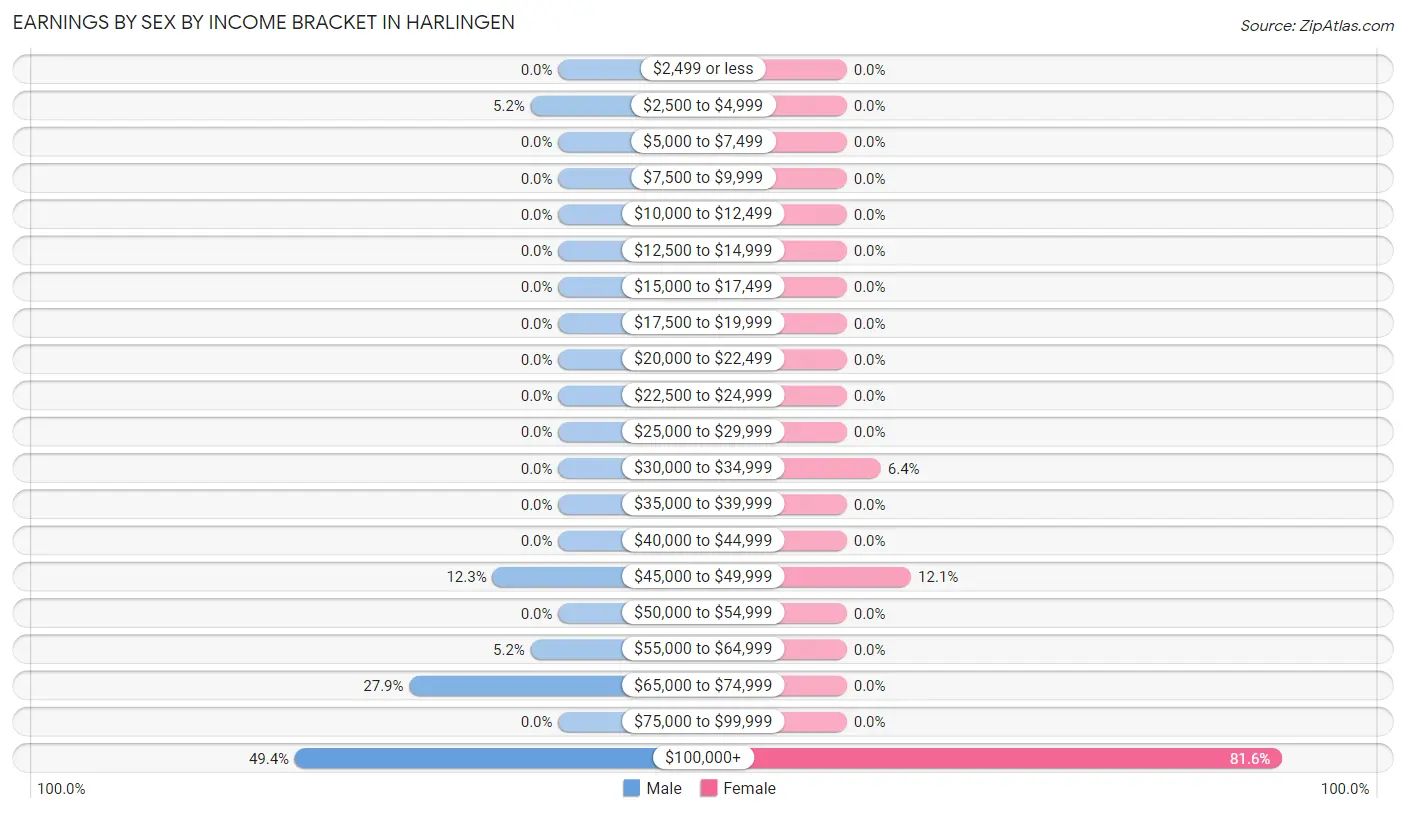
| Income | Male | Female |
| $2,499 or less | 0 (0.0%) | 0 (0.0%) |
| $2,500 to $4,999 | 8 (5.2%) | 0 (0.0%) |
| $5,000 to $7,499 | 0 (0.0%) | 0 (0.0%) |
| $7,500 to $9,999 | 0 (0.0%) | 0 (0.0%) |
| $10,000 to $12,499 | 0 (0.0%) | 0 (0.0%) |
| $12,500 to $14,999 | 0 (0.0%) | 0 (0.0%) |
| $15,000 to $17,499 | 0 (0.0%) | 0 (0.0%) |
| $17,500 to $19,999 | 0 (0.0%) | 0 (0.0%) |
| $20,000 to $22,499 | 0 (0.0%) | 0 (0.0%) |
| $22,500 to $24,999 | 0 (0.0%) | 0 (0.0%) |
| $25,000 to $29,999 | 0 (0.0%) | 0 (0.0%) |
| $30,000 to $34,999 | 0 (0.0%) | 9 (6.4%) |
| $35,000 to $39,999 | 0 (0.0%) | 0 (0.0%) |
| $40,000 to $44,999 | 0 (0.0%) | 0 (0.0%) |
| $45,000 to $49,999 | 19 (12.3%) | 17 (12.1%) |
| $50,000 to $54,999 | 0 (0.0%) | 0 (0.0%) |
| $55,000 to $64,999 | 8 (5.2%) | 0 (0.0%) |
| $65,000 to $74,999 | 43 (27.9%) | 0 (0.0%) |
| $75,000 to $99,999 | 0 (0.0%) | 0 (0.0%) |
| $100,000+ | 76 (49.3%) | 115 (81.6%) |
| Total | 154 (100.0%) | 141 (100.0%) |
Earnings by Sex by Educational Attainment in Harlingen
Average earnings in Harlingen are $120,625 for men and $148,301 for women, a difference of 18.7%. Men with an educational attainment of graduate degree enjoy the highest average annual earnings of $191,250, while those with graduate degree education earn the least with $191,250. Women with an educational attainment of graduate degree earn the most with the average annual earnings of $149,135, while those with graduate degree education have the smallest earnings of $149,135.
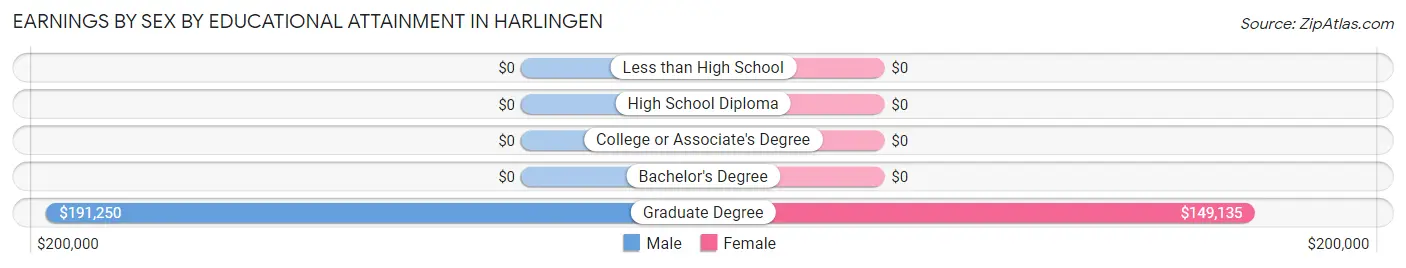
| Educational Attainment | Male Income | Female Income |
| Less than High School | - | - |
| High School Diploma | - | - |
| College or Associate's Degree | - | - |
| Bachelor's Degree | - | - |
| Graduate Degree | $191,250 | $149,135 |
| Total | $120,625 | $148,301 |
Family Income in Harlingen
Family Income Brackets in Harlingen
According to the Harlingen family income data, there are 119 families falling into the $200,000+ income range, which is the most common income bracket and makes up 85.0% of all families.
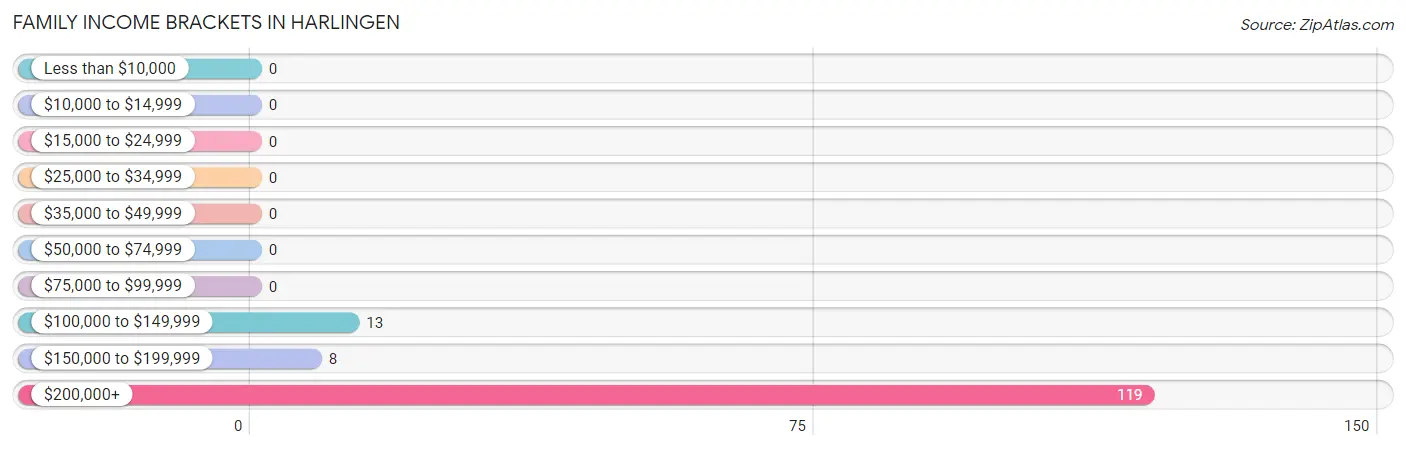
| Income Bracket | # Families | % Families |
| Less than $10,000 | 0 | 0.0% |
| $10,000 to $14,999 | 0 | 0.0% |
| $15,000 to $24,999 | 0 | 0.0% |
| $25,000 to $34,999 | 0 | 0.0% |
| $35,000 to $49,999 | 0 | 0.0% |
| $50,000 to $74,999 | 0 | 0.0% |
| $75,000 to $99,999 | 0 | 0.0% |
| $100,000 to $149,999 | 13 | 9.3% |
| $150,000 to $199,999 | 8 | 5.7% |
| $200,000+ | 119 | 85.0% |
Family Income by Famaliy Size in Harlingen
4-person families (38 | 27.1%) account for the highest median family income in Harlingen with $250,001 per family, while 2-person families (73 | 52.1%) have the highest median income of $108,446 per family member.
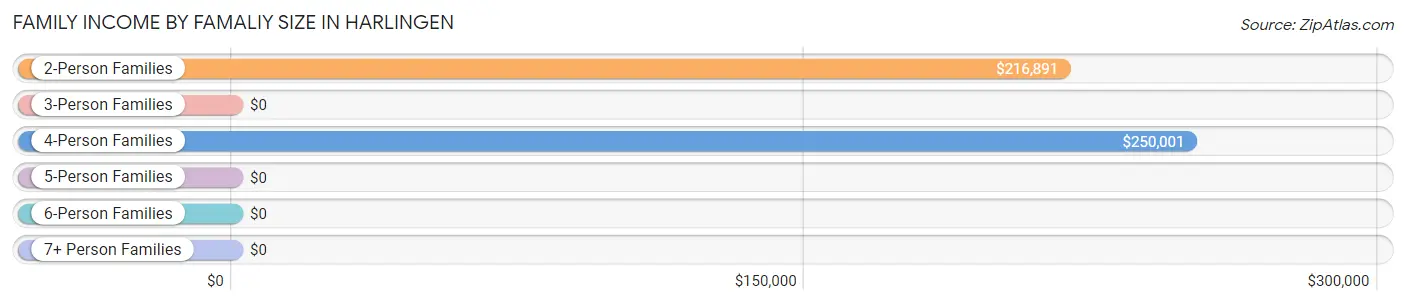
| Income Bracket | # Families | Median Income |
| 2-Person Families | 73 (52.1%) | $216,891 |
| 3-Person Families | 14 (10.0%) | $0 |
| 4-Person Families | 38 (27.1%) | $250,001 |
| 5-Person Families | 9 (6.4%) | $0 |
| 6-Person Families | 6 (4.3%) | $0 |
| 7+ Person Families | 0 (0.0%) | $0 |
| Total | 140 (100.0%) | $235,000 |
Family Income by Number of Earners in Harlingen
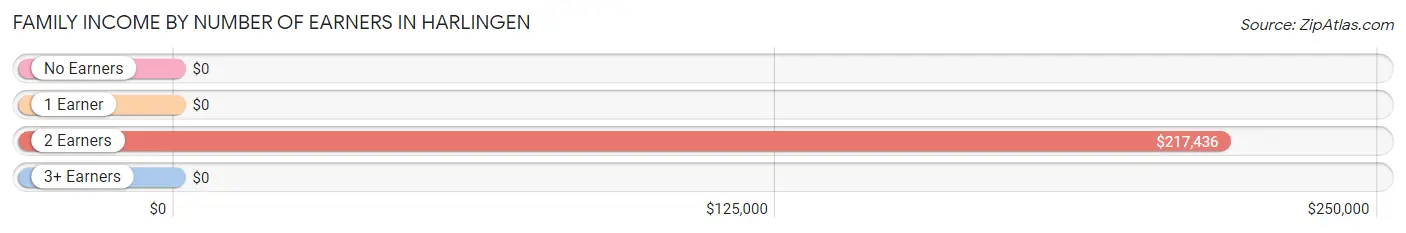
| Number of Earners | # Families | Median Income |
| No Earners | 7 (5.0%) | $0 |
| 1 Earner | 16 (11.4%) | $0 |
| 2 Earners | 92 (65.7%) | $217,436 |
| 3+ Earners | 25 (17.9%) | $0 |
| Total | 140 (100.0%) | $235,000 |
Household Income in Harlingen
Household Income Brackets in Harlingen
With 119 households falling in the category, the $200,000+ income range is the most frequent in Harlingen, accounting for 85.0% of all households.
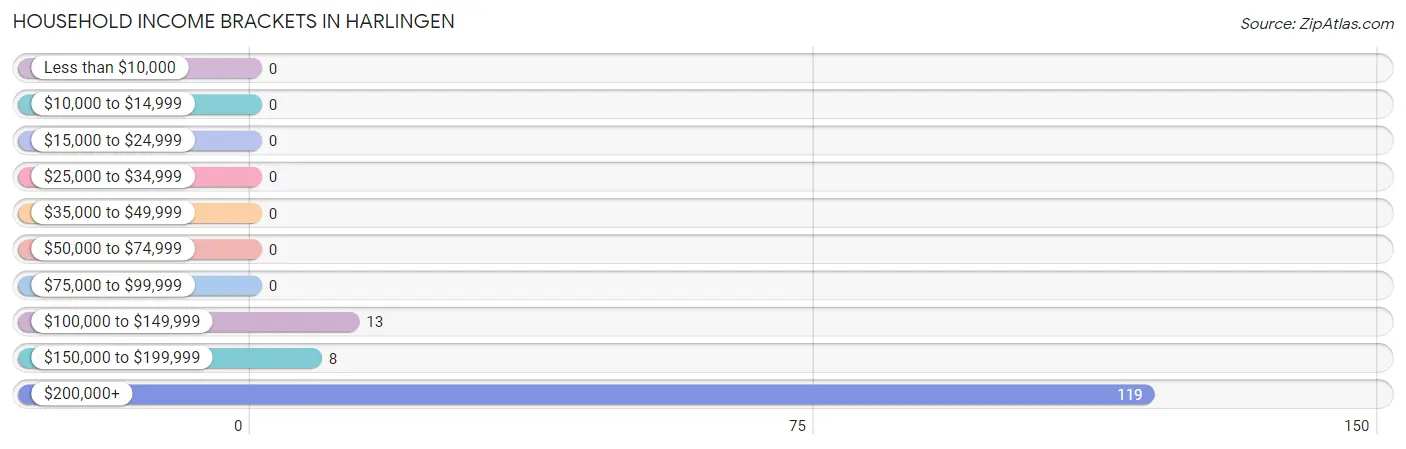
| Income Bracket | # Households | % Households |
| Less than $10,000 | 0 | 0.0% |
| $10,000 to $14,999 | 0 | 0.0% |
| $15,000 to $24,999 | 0 | 0.0% |
| $25,000 to $34,999 | 0 | 0.0% |
| $35,000 to $49,999 | 0 | 0.0% |
| $50,000 to $74,999 | 0 | 0.0% |
| $75,000 to $99,999 | 0 | 0.0% |
| $100,000 to $149,999 | 13 | 9.3% |
| $150,000 to $199,999 | 8 | 5.7% |
| $200,000+ | 119 | 85.0% |
Household Income by Householder Age in Harlingen
The median household income in Harlingen is $235,000, with the highest median household income of $242,188 found in the 45 to 64 years age bracket for the primary householder. A total of 55 households (39.3%) fall into this category.
| Income Bracket | # Households | Median Income |
| 15 to 24 Years | 0 (0.0%) | $0 |
| 25 to 44 Years | 85 (60.7%) | $216,827 |
| 45 to 64 Years | 55 (39.3%) | $242,188 |
| 65+ Years | 0 (0.0%) | $0 |
| Total | 140 (100.0%) | $235,000 |
Poverty in Harlingen
Income Below Poverty by Sex and Age in Harlingen
| Age Bracket | Male | Female |
| Under 5 Years | 0 (0.0%) | 0 (0.0%) |
| 5 Years | 0 (0.0%) | 0 (0.0%) |
| 6 to 11 Years | 0 (0.0%) | 0 (0.0%) |
| 12 to 14 Years | 0 (0.0%) | 0 (0.0%) |
| 15 Years | 0 (0.0%) | 0 (0.0%) |
| 16 and 17 Years | 0 (0.0%) | 0 (0.0%) |
| 18 to 24 Years | 0 (0.0%) | 0 (0.0%) |
| 25 to 34 Years | 0 (0.0%) | 0 (0.0%) |
| 35 to 44 Years | 0 (0.0%) | 0 (0.0%) |
| 45 to 54 Years | 0 (0.0%) | 0 (0.0%) |
| 55 to 64 Years | 0 (0.0%) | 0 (0.0%) |
| 65 to 74 Years | 0 (0.0%) | 0 (0.0%) |
| 75 Years and over | 0 (0.0%) | 0 (0.0%) |
| Total | 0 (0.0%) | 0 (0.0%) |
Income Above Poverty by Sex and Age in Harlingen
According to the poverty statistics in Harlingen, males aged under 5 years and females aged under 5 years are the age groups that are most secure financially, with 100.0% of males and 100.0% of females in these age groups living above the poverty line.
| Age Bracket | Male | Female |
| Under 5 Years | 20 (100.0%) | 6 (100.0%) |
| 5 Years | 0 (0.0%) | 0 (0.0%) |
| 6 to 11 Years | 15 (100.0%) | 6 (100.0%) |
| 12 to 14 Years | 19 (100.0%) | 0 (0.0%) |
| 15 Years | 0 (0.0%) | 0 (0.0%) |
| 16 and 17 Years | 8 (100.0%) | 6 (100.0%) |
| 18 to 24 Years | 8 (100.0%) | 0 (0.0%) |
| 25 to 34 Years | 0 (0.0%) | 7 (100.0%) |
| 35 to 44 Years | 79 (100.0%) | 79 (100.0%) |
| 45 to 54 Years | 38 (100.0%) | 19 (100.0%) |
| 55 to 64 Years | 39 (100.0%) | 49 (100.0%) |
| 65 to 74 Years | 8 (100.0%) | 0 (0.0%) |
| 75 Years and over | 0 (0.0%) | 23 (100.0%) |
| Total | 234 (100.0%) | 195 (100.0%) |
Income Below Poverty Among Married-Couple Families in Harlingen
| Children | Above Poverty | Below Poverty |
| No Children | 89 (100.0%) | 0 (0.0%) |
| 1 or 2 Children | 45 (100.0%) | 0 (0.0%) |
| 3 or 4 Children | 6 (100.0%) | 0 (0.0%) |
| 5 or more Children | 0 (0.0%) | 0 (0.0%) |
| Total | 140 (100.0%) | 0 (0.0%) |
Income Below Poverty Among Single-Parent Households in Harlingen
| Children | Single Father | Single Mother |
| No Children | 0 (0.0%) | 0 (0.0%) |
| 1 or 2 Children | 0 (0.0%) | 0 (0.0%) |
| 3 or 4 Children | 0 (0.0%) | 0 (0.0%) |
| 5 or more Children | 0 (0.0%) | 0 (0.0%) |
| Total | 0 (0.0%) | 0 (0.0%) |
Income Below Poverty Among Married-Couple vs Single-Parent Households in Harlingen
| Children | Married-Couple Families | Single-Parent Households |
| No Children | 0 (0.0%) | 0 (0.0%) |
| 1 or 2 Children | 0 (0.0%) | 0 (0.0%) |
| 3 or 4 Children | 0 (0.0%) | 0 (0.0%) |
| 5 or more Children | 0 (0.0%) | 0 (0.0%) |
| Total | 0 (0.0%) | 0 (0.0%) |
Race in Harlingen
The most populous races in Harlingen are Asian (237 | 55.2%), and White / Caucasian (192 | 44.8%).
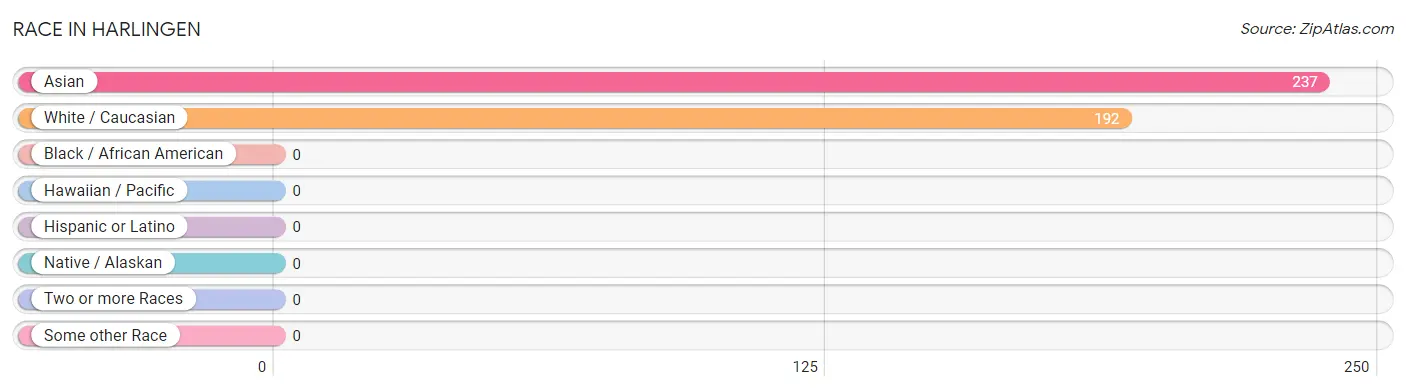
| Race | # Population | % Population |
| Asian | 237 | 55.2% |
| Black / African American | 0 | 0.0% |
| Hawaiian / Pacific | 0 | 0.0% |
| Hispanic or Latino | 0 | 0.0% |
| Native / Alaskan | 0 | 0.0% |
| White / Caucasian | 192 | 44.8% |
| Two or more Races | 0 | 0.0% |
| Some other Race | 0 | 0.0% |
| Total | 429 | 100.0% |
Ancestry in Harlingen
The most populous ancestries reported in Harlingen are Thai (111 | 25.9%), Burmese (68 | 15.9%), Indian (Asian) (40 | 9.3%), Italian (40 | 9.3%), and Irish (32 | 7.5%), together accounting for 67.8% of all Harlingen residents.
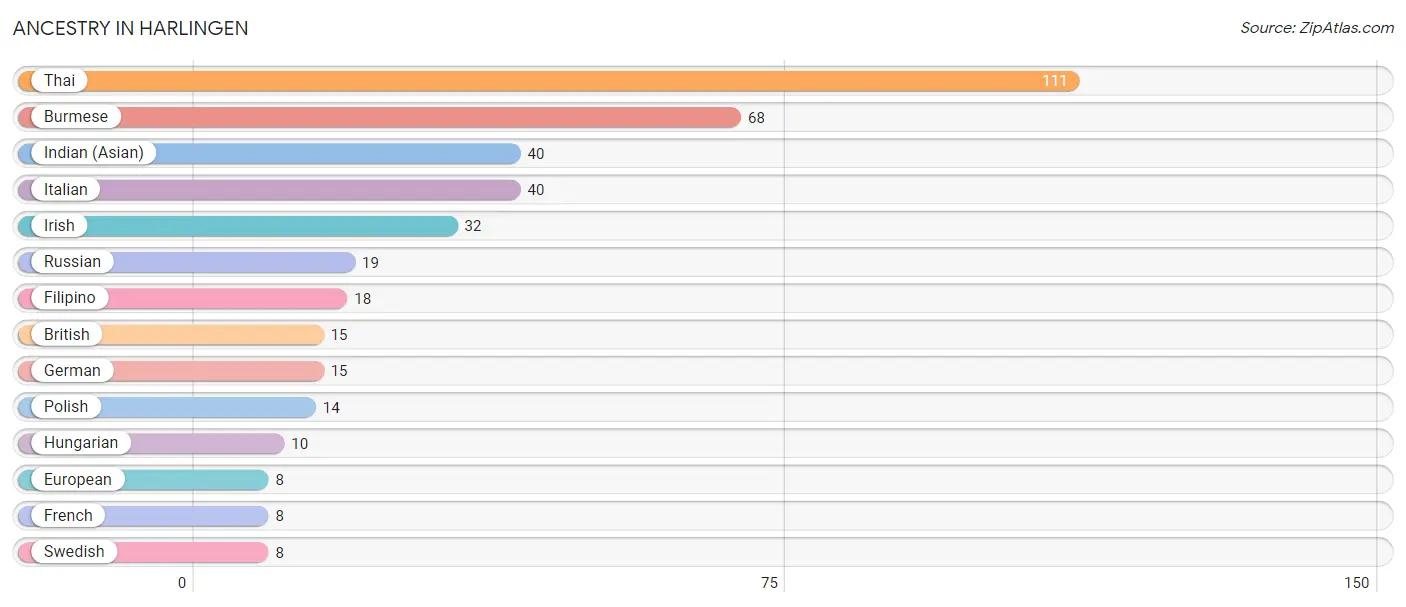
| Ancestry | # Population | % Population |
| British | 15 | 3.5% |
| Burmese | 68 | 15.9% |
| European | 8 | 1.9% |
| Filipino | 18 | 4.2% |
| French | 8 | 1.9% |
| German | 15 | 3.5% |
| Hungarian | 10 | 2.3% |
| Indian (Asian) | 40 | 9.3% |
| Irish | 32 | 7.5% |
| Italian | 40 | 9.3% |
| Polish | 14 | 3.3% |
| Russian | 19 | 4.4% |
| Swedish | 8 | 1.9% |
| Thai | 111 | 25.9% | View All 14 Rows |
Immigrants in Harlingen
The most numerous immigrant groups reported in Harlingen came from Asia (182 | 42.4%), Eastern Asia (102 | 23.8%), India (80 | 18.6%), South Central Asia (80 | 18.6%), and Korea (68 | 15.9%), together accounting for 119.4% of all Harlingen residents.
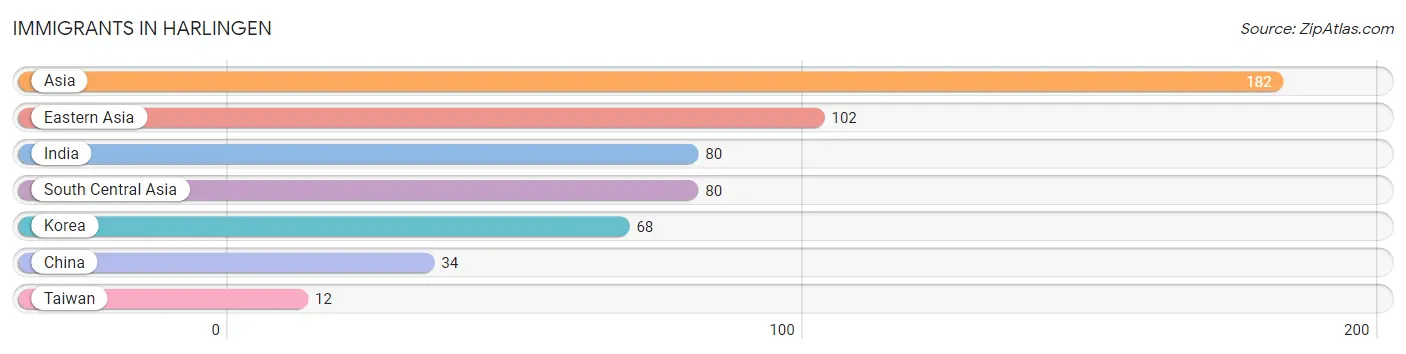
| Immigration Origin | # Population | % Population |
| Asia | 182 | 42.4% |
| China | 34 | 7.9% |
| Eastern Asia | 102 | 23.8% |
| India | 80 | 18.6% |
| Korea | 68 | 15.9% |
| South Central Asia | 80 | 18.6% |
| Taiwan | 12 | 2.8% | View All 7 Rows |
Sex and Age in Harlingen
Sex and Age in Harlingen
The most populous age groups in Harlingen are 35 to 39 Years (73 | 31.2%) for men and 35 to 39 Years (63 | 32.3%) for women.
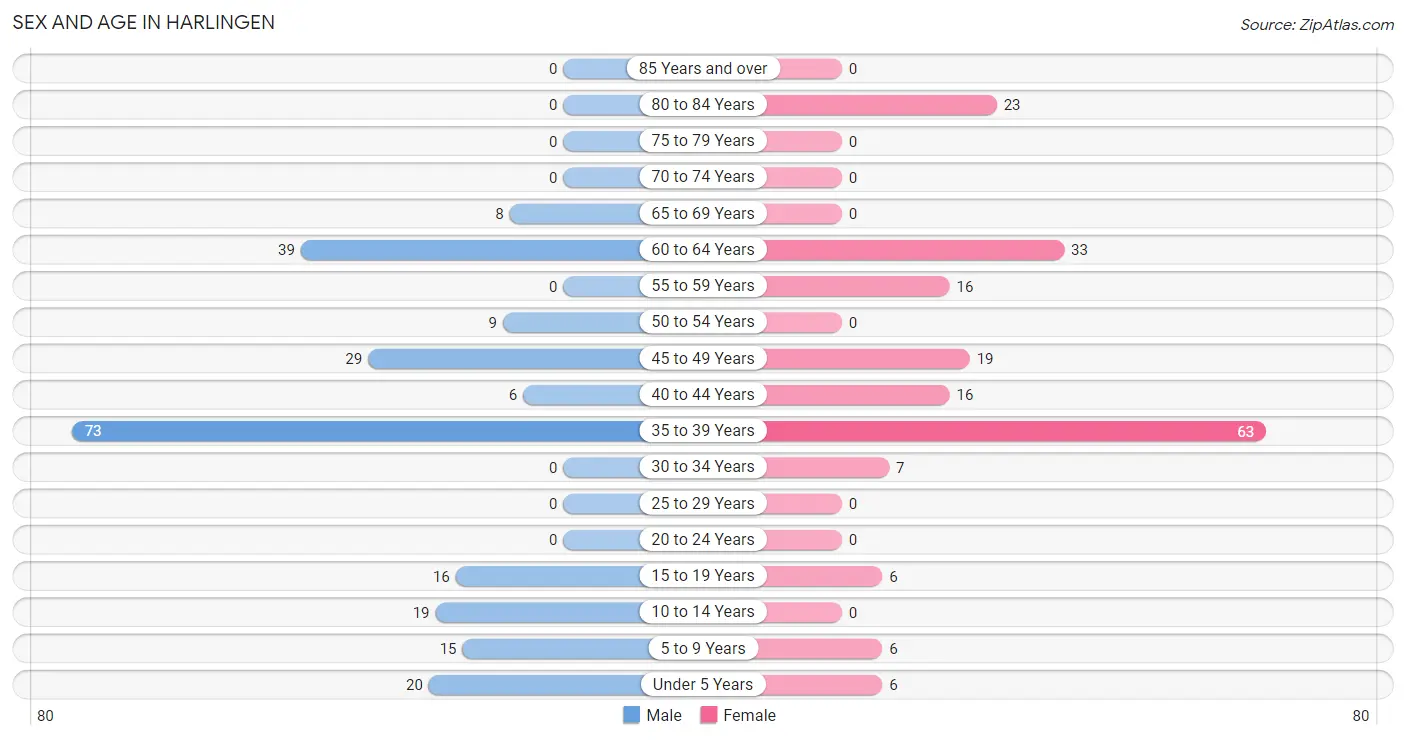
| Age Bracket | Male | Female |
| Under 5 Years | 20 (8.6%) | 6 (3.1%) |
| 5 to 9 Years | 15 (6.4%) | 6 (3.1%) |
| 10 to 14 Years | 19 (8.1%) | 0 (0.0%) |
| 15 to 19 Years | 16 (6.8%) | 6 (3.1%) |
| 20 to 24 Years | 0 (0.0%) | 0 (0.0%) |
| 25 to 29 Years | 0 (0.0%) | 0 (0.0%) |
| 30 to 34 Years | 0 (0.0%) | 7 (3.6%) |
| 35 to 39 Years | 73 (31.2%) | 63 (32.3%) |
| 40 to 44 Years | 6 (2.6%) | 16 (8.2%) |
| 45 to 49 Years | 29 (12.4%) | 19 (9.7%) |
| 50 to 54 Years | 9 (3.8%) | 0 (0.0%) |
| 55 to 59 Years | 0 (0.0%) | 16 (8.2%) |
| 60 to 64 Years | 39 (16.7%) | 33 (16.9%) |
| 65 to 69 Years | 8 (3.4%) | 0 (0.0%) |
| 70 to 74 Years | 0 (0.0%) | 0 (0.0%) |
| 75 to 79 Years | 0 (0.0%) | 0 (0.0%) |
| 80 to 84 Years | 0 (0.0%) | 23 (11.8%) |
| 85 Years and over | 0 (0.0%) | 0 (0.0%) |
| Total | 234 (100.0%) | 195 (100.0%) |
Families and Households in Harlingen
Median Family Size in Harlingen
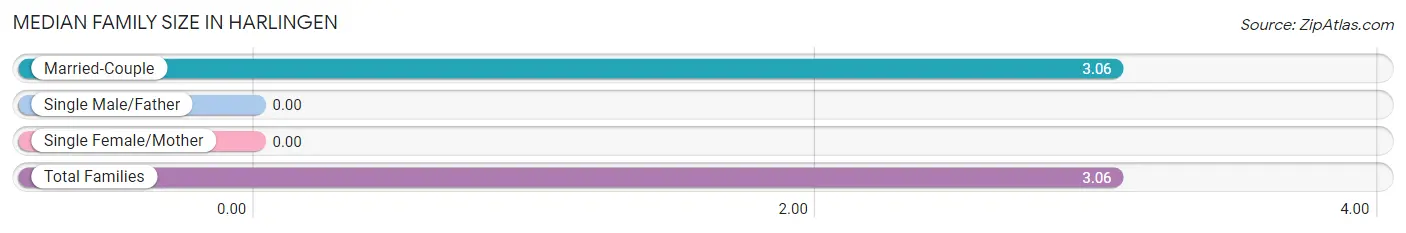
| Family Type | # Families | Family Size |
| Married-Couple | 140 (100.0%) | 3.06 |
| Single Male/Father | 0 (0.0%) | - |
| Single Female/Mother | 0 (0.0%) | - |
| Total Families | 140 (100.0%) | 3.06 |
Median Household Size in Harlingen
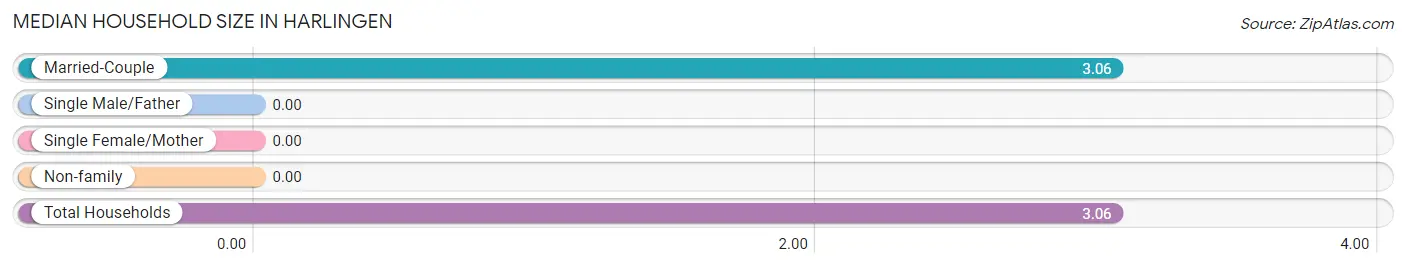
| Household Type | # Households | Household Size |
| Married-Couple | 140 (100.0%) | 3.06 |
| Single Male/Father | 0 (0.0%) | - |
| Single Female/Mother | 0 (0.0%) | - |
| Non-family | 0 (0.0%) | - |
| Total Households | 140 (100.0%) | 3.06 |
Household Size by Marriage Status in Harlingen
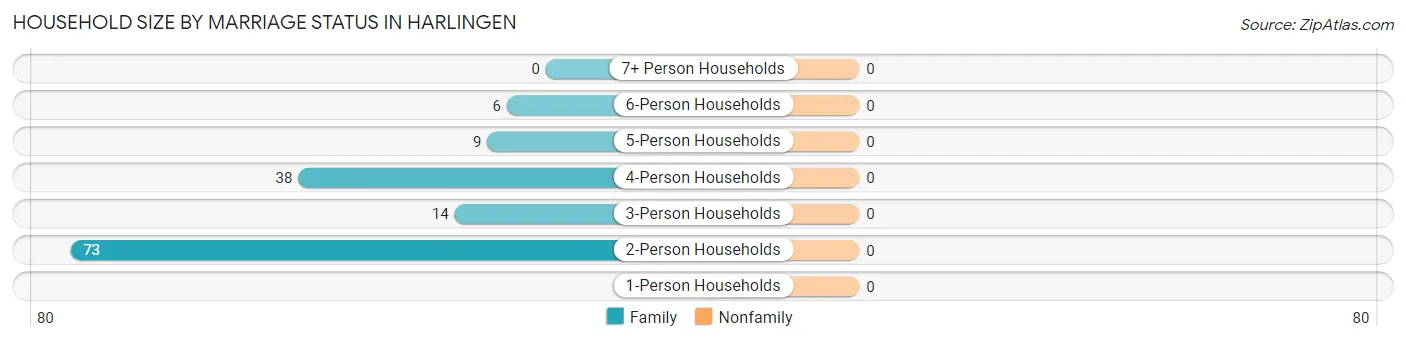
| Household Size | Family Households | Nonfamily Households |
| 1-Person Households | - | 0 (0.0%) |
| 2-Person Households | 73 (52.1%) | 0 (0.0%) |
| 3-Person Households | 14 (10.0%) | 0 (0.0%) |
| 4-Person Households | 38 (27.1%) | 0 (0.0%) |
| 5-Person Households | 9 (6.4%) | 0 (0.0%) |
| 6-Person Households | 6 (4.3%) | 0 (0.0%) |
| 7+ Person Households | 0 (0.0%) | 0 (0.0%) |
| Total | 140 (100.0%) | 0 (0.0%) |
Female Fertility in Harlingen
Fertility by Age in Harlingen
Average fertility rate in Harlingen is 63.0 births per 1,000 women. Women in the age bracket of 20 to 34 years have the highest fertility rate with 1,000.0 births per 1,000 women. Women in the age bracket of 20 to 34 years acount for 100.0% of all women with births.
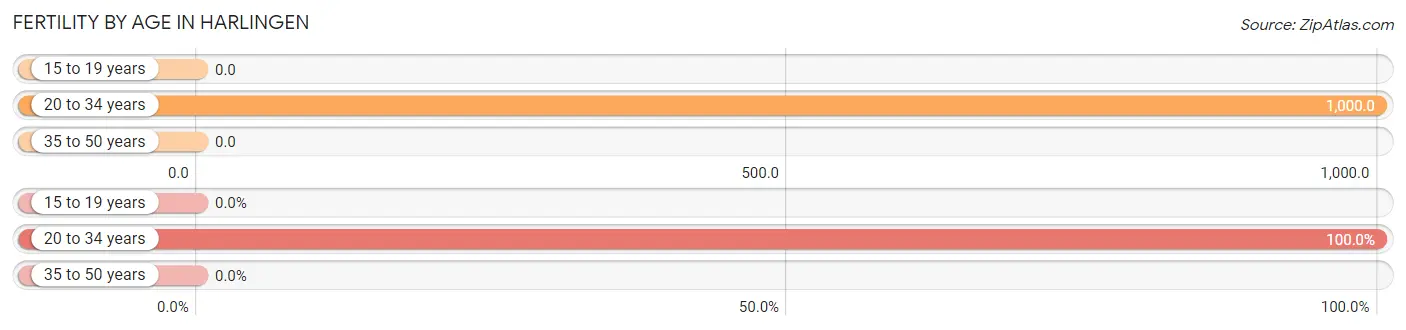
| Age Bracket | Women with Births | Births / 1,000 Women |
| 15 to 19 years | 0 (0.0%) | 0.0 |
| 20 to 34 years | 7 (100.0%) | 1,000.0 |
| 35 to 50 years | 0 (0.0%) | 0.0 |
| Total | 7 (100.0%) | 63.0 |
Fertility by Age by Marriage Status in Harlingen
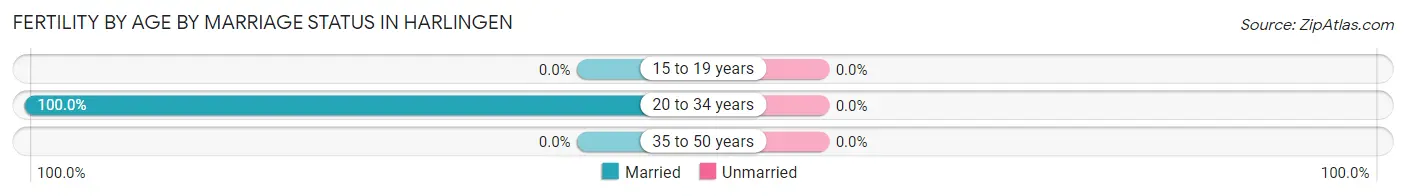
| Age Bracket | Married | Unmarried |
| 15 to 19 years | 0 (0.0%) | 0 (0.0%) |
| 20 to 34 years | 7 (100.0%) | 0 (0.0%) |
| 35 to 50 years | 0 (0.0%) | 0 (0.0%) |
| Total | 7 (100.0%) | 0 (0.0%) |
Fertility by Education in Harlingen
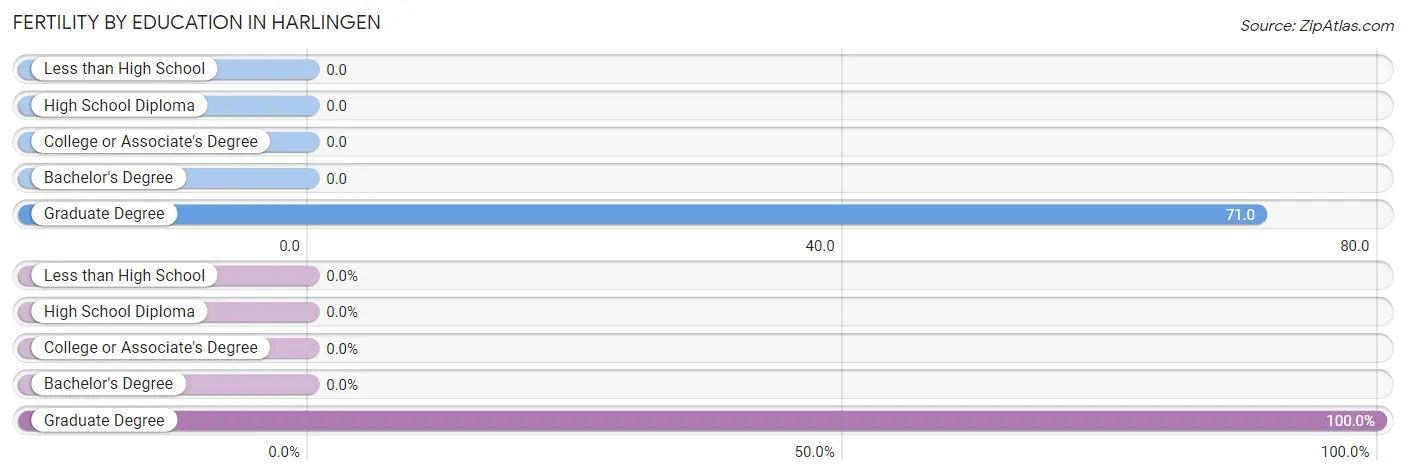
| Educational Attainment | Women with Births | Births / 1,000 Women |
| Less than High School | 0 (0.0%) | 0.0 |
| High School Diploma | 0 (0.0%) | 0.0 |
| College or Associate's Degree | 0 (0.0%) | 0.0 |
| Bachelor's Degree | 0 (0.0%) | 0.0 |
| Graduate Degree | 7 (100.0%) | 71.0 |
| Total | 7 (100.0%) | 63.0 |
Fertility by Education by Marriage Status in Harlingen
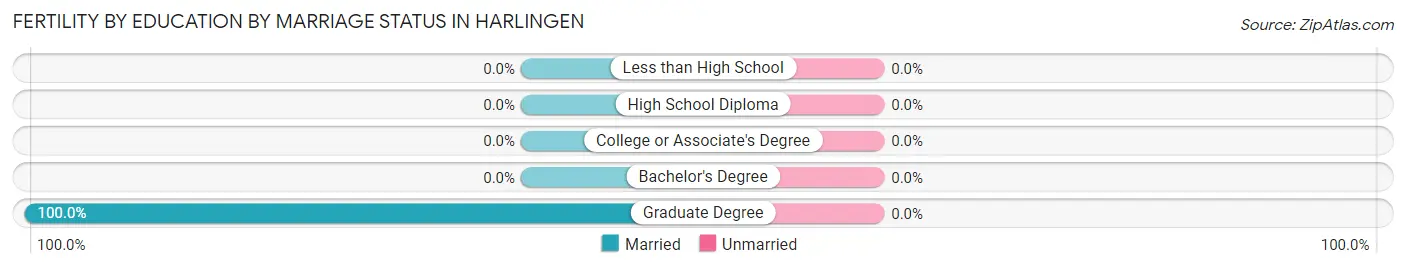
| Educational Attainment | Married | Unmarried |
| Less than High School | 0 (0.0%) | 0 (0.0%) |
| High School Diploma | 0 (0.0%) | 0 (0.0%) |
| College or Associate's Degree | 0 (0.0%) | 0 (0.0%) |
| Bachelor's Degree | 0 (0.0%) | 0 (0.0%) |
| Graduate Degree | 7 (100.0%) | 0 (0.0%) |
| Total | 7 (100.0%) | 0 (0.0%) |
Employment Characteristics in Harlingen
Employment by Class of Employer in Harlingen
Among the 285 employed individuals in Harlingen, private company employees (148 | 51.9%), not-for-profit organizations (62 | 21.7%), and self-employed (not incorporated) (36 | 12.6%) make up the most common classes of employment.
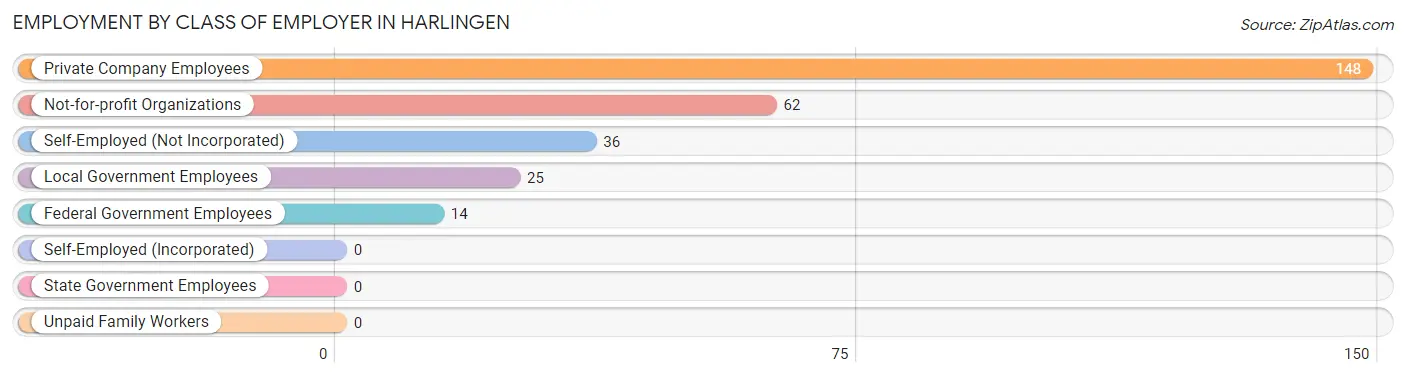
| Employer Class | # Employees | % Employees |
| Private Company Employees | 148 | 51.9% |
| Self-Employed (Incorporated) | 0 | 0.0% |
| Self-Employed (Not Incorporated) | 36 | 12.6% |
| Not-for-profit Organizations | 62 | 21.7% |
| Local Government Employees | 25 | 8.8% |
| State Government Employees | 0 | 0.0% |
| Federal Government Employees | 14 | 4.9% |
| Unpaid Family Workers | 0 | 0.0% |
| Total | 285 | 100.0% |
Employment Status by Age in Harlingen
According to the labor force statistics for Harlingen, out of the total population over 16 years of age (363), 81.3% or 295 individuals are in the labor force, with 3.4% or 10 of them unemployed. The age group with the highest labor force participation rate is 30 to 34 years, with 100.0% or 7 individuals in the labor force. Within the labor force, the 35 to 44 years age range has the highest percentage of unemployed individuals, with 6.6% or 10 of them being unemployed.
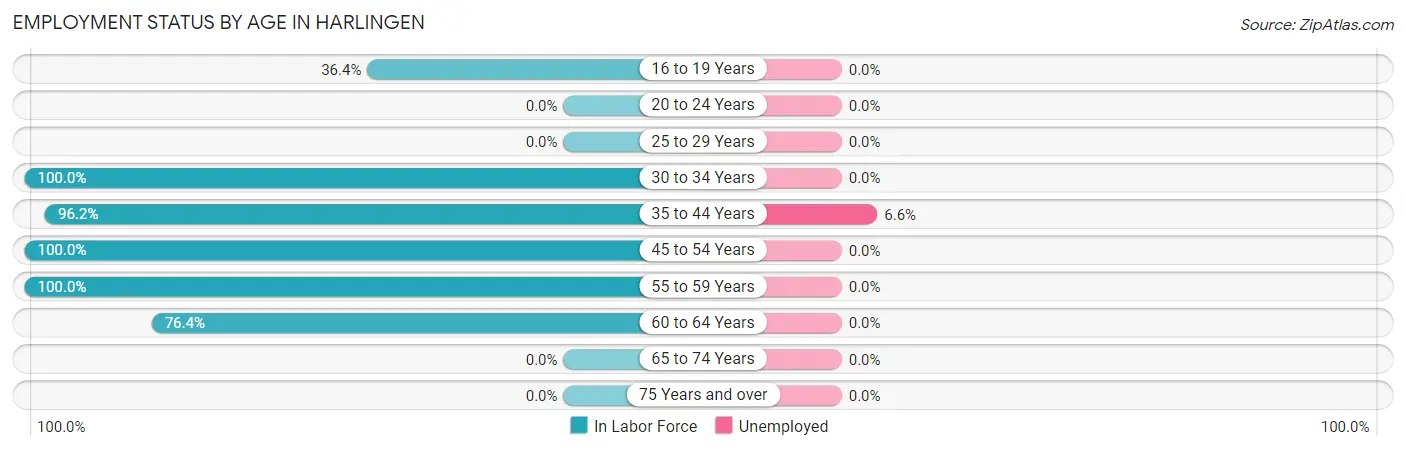
| Age Bracket | In Labor Force | Unemployed |
| 16 to 19 Years | 8 (36.4%) | 0 (0.0%) |
| 20 to 24 Years | 0 (0.0%) | 0 (0.0%) |
| 25 to 29 Years | 0 (0.0%) | 0 (0.0%) |
| 30 to 34 Years | 7 (100.0%) | 0 (0.0%) |
| 35 to 44 Years | 152 (96.2%) | 10 (6.6%) |
| 45 to 54 Years | 57 (100.0%) | 0 (0.0%) |
| 55 to 59 Years | 16 (100.0%) | 0 (0.0%) |
| 60 to 64 Years | 55 (76.4%) | 0 (0.0%) |
| 65 to 74 Years | 0 (0.0%) | 0 (0.0%) |
| 75 Years and over | 0 (0.0%) | 0 (0.0%) |
| Total | 295 (81.3%) | 10 (3.4%) |
Employment Status by Educational Attainment in Harlingen
According to labor force statistics for Harlingen, 92.6% of individuals (287) out of the total population between 25 and 64 years of age (310) are in the labor force, with 3.5% or 10 of them being unemployed. The group with the highest labor force participation rate are those with the educational attainment of college / associate degree, with 100.0% or 43 individuals in the labor force. Within the labor force, individuals with bachelor's degree or higher education have the highest percentage of unemployment, with 4.1% or 10 of them being unemployed.
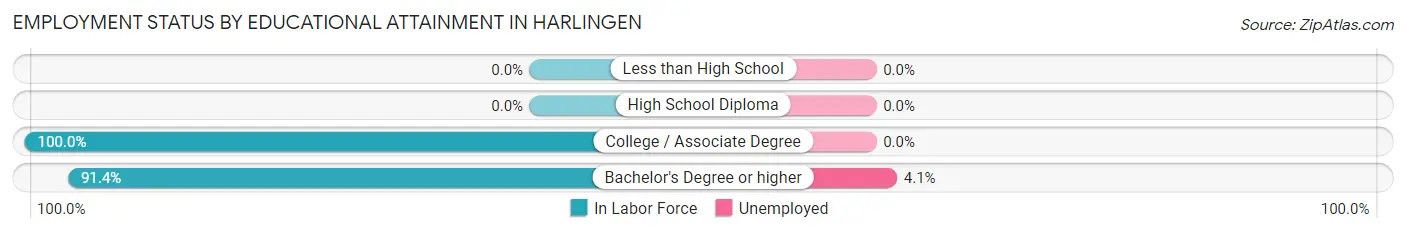
| Educational Attainment | In Labor Force | Unemployed |
| Less than High School | 0 (0.0%) | 0 (0.0%) |
| High School Diploma | 0 (0.0%) | 0 (0.0%) |
| College / Associate Degree | 43 (100.0%) | 0 (0.0%) |
| Bachelor's Degree or higher | 244 (91.4%) | 11 (4.1%) |
| Total | 287 (92.6%) | 11 (3.5%) |
Employment Occupations by Sex in Harlingen
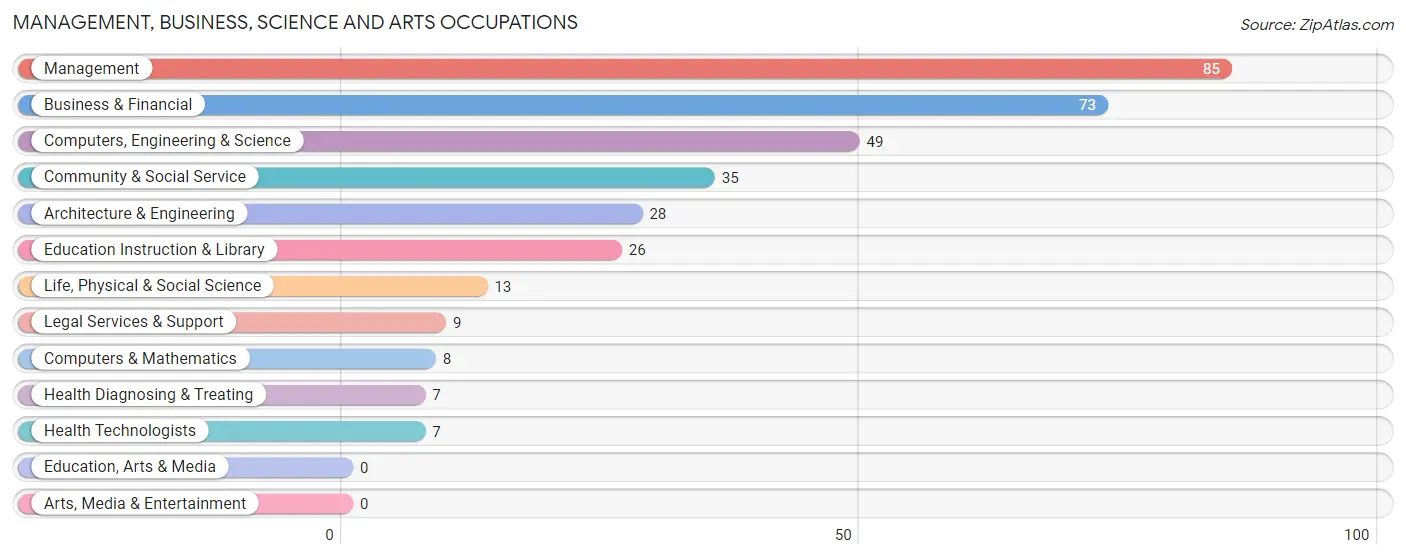
Management, Business, Science and Arts Occupations
The most common Management, Business, Science and Arts occupations in Harlingen are Management (85 | 29.8%), Business & Financial (73 | 25.6%), Computers, Engineering & Science (49 | 17.2%), Community & Social Service (35 | 12.3%), and Architecture & Engineering (28 | 9.8%).
Management, Business, Science and Arts Occupations by Sex
Within the Management, Business, Science and Arts occupations in Harlingen, the most male-oriented occupations are Computers, Engineering & Science (100.0%), Computers & Mathematics (100.0%), and Architecture & Engineering (100.0%), while the most female-oriented occupations are Community & Social Service (100.0%), Legal Services & Support (100.0%), and Education Instruction & Library (100.0%).
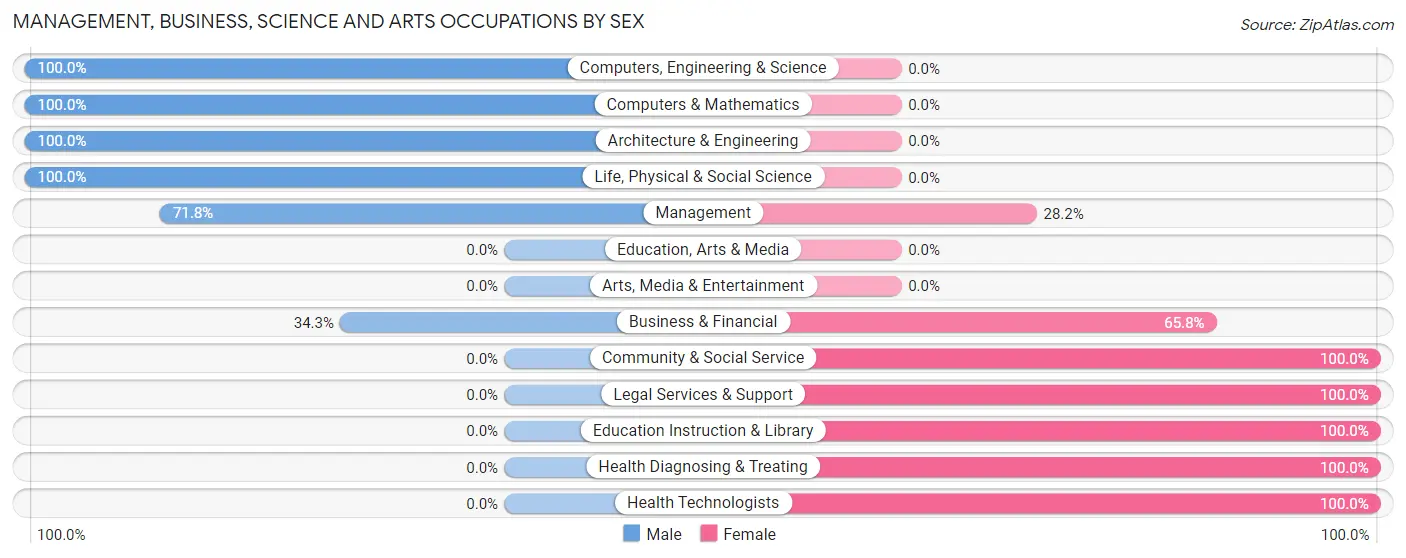
| Occupation | Male | Female |
| Management | 61 (71.8%) | 24 (28.2%) |
| Business & Financial | 25 (34.3%) | 48 (65.7%) |
| Computers, Engineering & Science | 49 (100.0%) | 0 (0.0%) |
| Computers & Mathematics | 8 (100.0%) | 0 (0.0%) |
| Architecture & Engineering | 28 (100.0%) | 0 (0.0%) |
| Life, Physical & Social Science | 13 (100.0%) | 0 (0.0%) |
| Community & Social Service | 0 (0.0%) | 35 (100.0%) |
| Education, Arts & Media | 0 (0.0%) | 0 (0.0%) |
| Legal Services & Support | 0 (0.0%) | 9 (100.0%) |
| Education Instruction & Library | 0 (0.0%) | 26 (100.0%) |
| Arts, Media & Entertainment | 0 (0.0%) | 0 (0.0%) |
| Health Diagnosing & Treating | 0 (0.0%) | 7 (100.0%) |
| Health Technologists | 0 (0.0%) | 7 (100.0%) |
| Total (Category) | 135 (54.2%) | 114 (45.8%) |
| Total (Overall) | 154 (54.0%) | 131 (46.0%) |
Services Occupations
Services Occupations by Sex
| Occupation | Male | Female |
| Healthcare Support | 0 (0.0%) | 0 (0.0%) |
| Security & Protection | 0 (0.0%) | 0 (0.0%) |
| Firefighting & Prevention | 0 (0.0%) | 0 (0.0%) |
| Law Enforcement | 0 (0.0%) | 0 (0.0%) |
| Food Preparation & Serving | 0 (0.0%) | 0 (0.0%) |
| Cleaning & Maintenance | 0 (0.0%) | 0 (0.0%) |
| Personal Care & Service | 0 (0.0%) | 0 (0.0%) |
| Total (Category) | 0 (0.0%) | 0 (0.0%) |
| Total (Overall) | 154 (54.0%) | 131 (46.0%) |
Sales and Office Occupations
Sales and Office Occupations by Sex
| Occupation | Male | Female |
| Sales & Related | 0 (0.0%) | 0 (0.0%) |
| Office & Administration | 0 (0.0%) | 0 (0.0%) |
| Total (Category) | 0 (0.0%) | 0 (0.0%) |
| Total (Overall) | 154 (54.0%) | 131 (46.0%) |
Natural Resources, Construction and Maintenance Occupations
Natural Resources, Construction and Maintenance Occupations by Sex
| Occupation | Male | Female |
| Farming, Fishing & Forestry | 0 (0.0%) | 0 (0.0%) |
| Construction & Extraction | 0 (0.0%) | 0 (0.0%) |
| Installation, Maintenance & Repair | 0 (0.0%) | 0 (0.0%) |
| Total (Category) | 0 (0.0%) | 0 (0.0%) |
| Total (Overall) | 154 (54.0%) | 131 (46.0%) |
Production, Transportation and Moving Occupations
The most common Production, Transportation and Moving occupations in Harlingen are , and Production (36 | 12.6%).
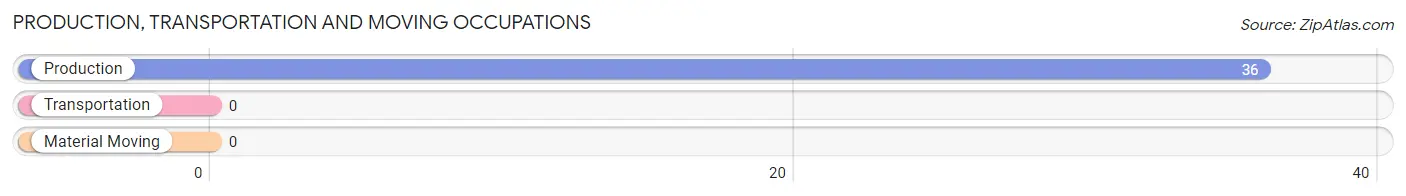
Production, Transportation and Moving Occupations by Sex
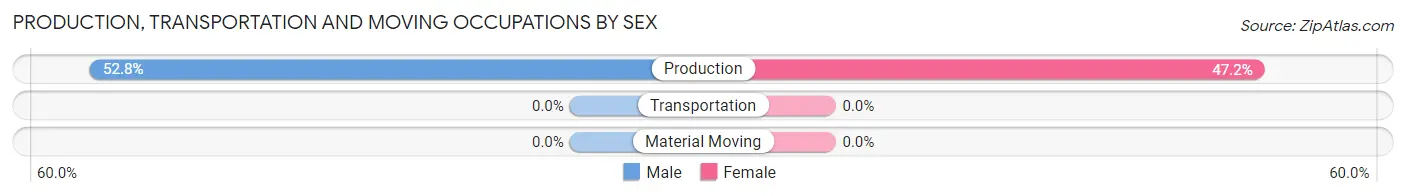
| Occupation | Male | Female |
| Production | 19 (52.8%) | 17 (47.2%) |
| Transportation | 0 (0.0%) | 0 (0.0%) |
| Material Moving | 0 (0.0%) | 0 (0.0%) |
| Total (Category) | 19 (52.8%) | 17 (47.2%) |
| Total (Overall) | 154 (54.0%) | 131 (46.0%) |
Employment Industries by Sex in Harlingen
Employment Industries in Harlingen
The major employment industries in Harlingen include Professional & Scientific (59 | 20.7%), Educational Services (58 | 20.3%), Manufacturing (50 | 17.5%), Health Care & Social Assistance (19 | 6.7%), and Public Administration (14 | 4.9%).
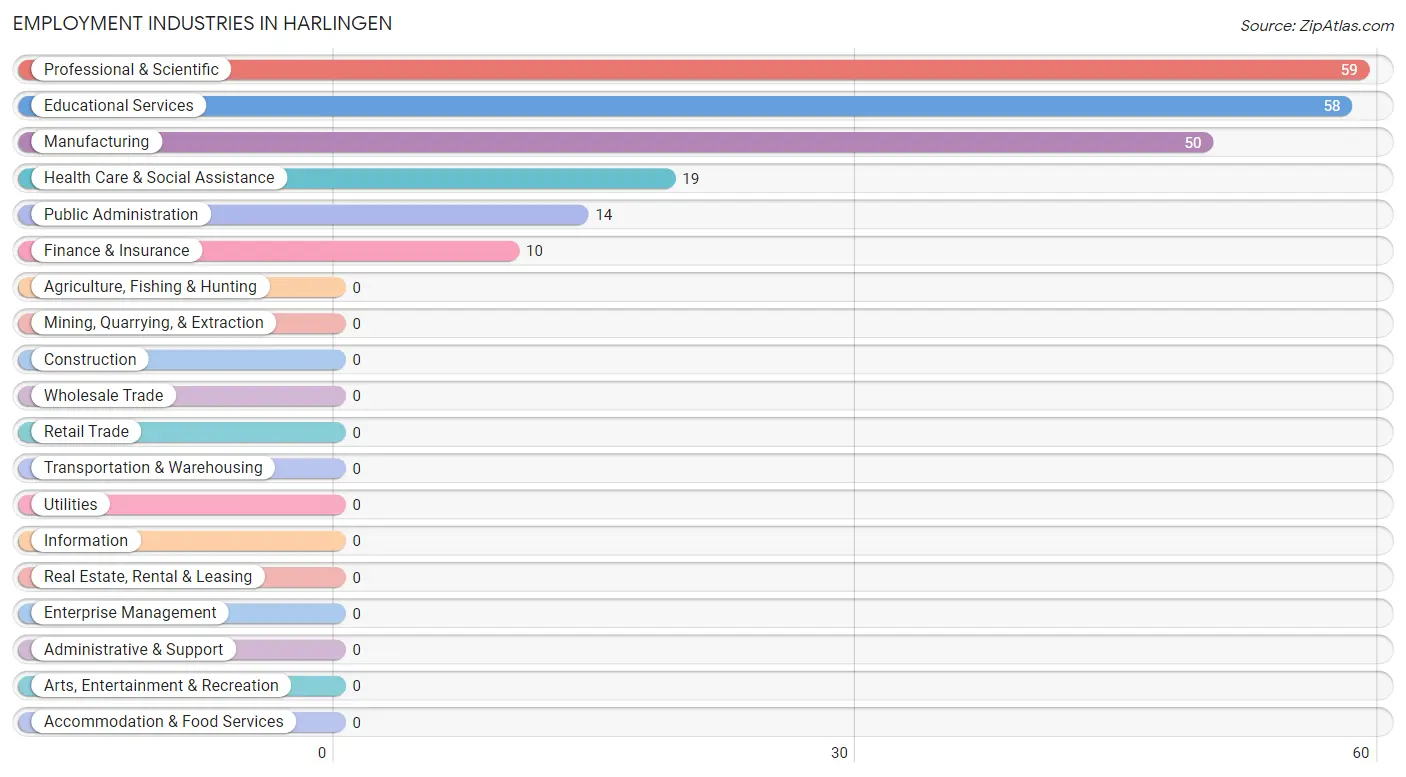
Employment Industries by Sex in Harlingen
The Harlingen industries that see more men than women are Finance & Insurance (100.0%), Public Administration (100.0%), and Professional & Scientific (84.8%), whereas the industries that tend to have a higher number of women are Educational Services (86.2%), Health Care & Social Assistance (36.8%), and Manufacturing (18.0%).
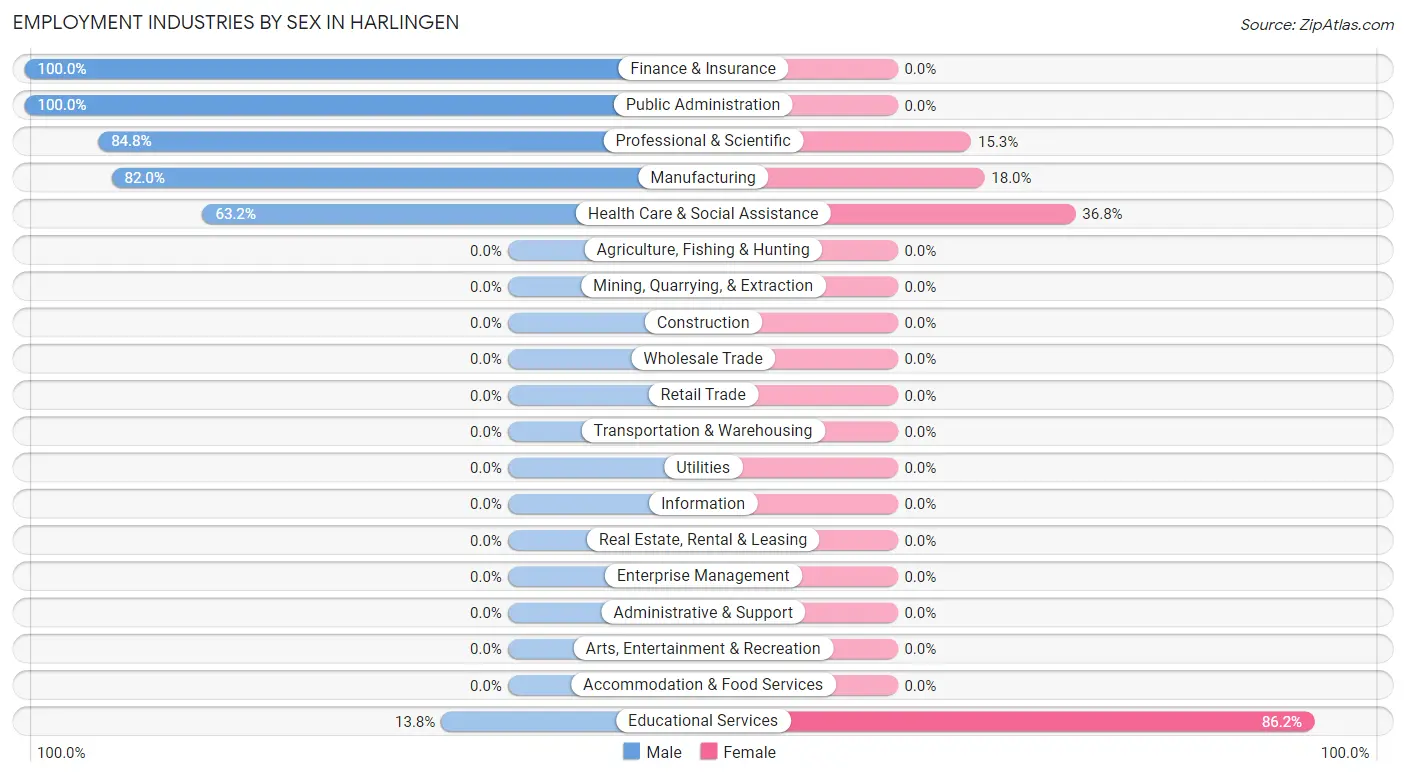
| Industry | Male | Female |
| Agriculture, Fishing & Hunting | 0 (0.0%) | 0 (0.0%) |
| Mining, Quarrying, & Extraction | 0 (0.0%) | 0 (0.0%) |
| Construction | 0 (0.0%) | 0 (0.0%) |
| Manufacturing | 41 (82.0%) | 9 (18.0%) |
| Wholesale Trade | 0 (0.0%) | 0 (0.0%) |
| Retail Trade | 0 (0.0%) | 0 (0.0%) |
| Transportation & Warehousing | 0 (0.0%) | 0 (0.0%) |
| Utilities | 0 (0.0%) | 0 (0.0%) |
| Information | 0 (0.0%) | 0 (0.0%) |
| Finance & Insurance | 10 (100.0%) | 0 (0.0%) |
| Real Estate, Rental & Leasing | 0 (0.0%) | 0 (0.0%) |
| Professional & Scientific | 50 (84.8%) | 9 (15.2%) |
| Enterprise Management | 0 (0.0%) | 0 (0.0%) |
| Administrative & Support | 0 (0.0%) | 0 (0.0%) |
| Educational Services | 8 (13.8%) | 50 (86.2%) |
| Health Care & Social Assistance | 12 (63.2%) | 7 (36.8%) |
| Arts, Entertainment & Recreation | 0 (0.0%) | 0 (0.0%) |
| Accommodation & Food Services | 0 (0.0%) | 0 (0.0%) |
| Public Administration | 14 (100.0%) | 0 (0.0%) |
| Total | 154 (54.0%) | 131 (46.0%) |
Education in Harlingen
School Enrollment in Harlingen
The most common levels of schooling among the 68 students in Harlingen are elementary school (21 | 30.9%), middle school (19 | 27.9%), and high school (14 | 20.6%).
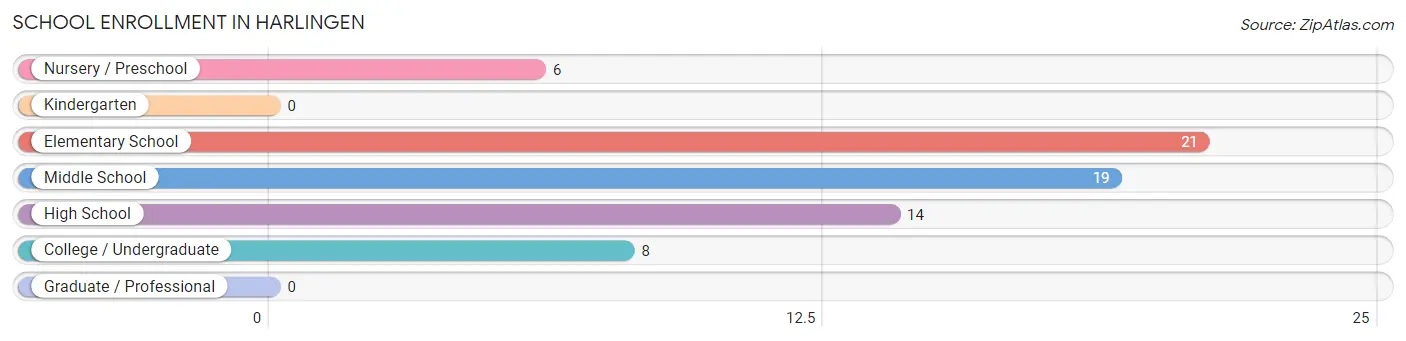
| School Level | # Students | % Students |
| Nursery / Preschool | 6 | 8.8% |
| Kindergarten | 0 | 0.0% |
| Elementary School | 21 | 30.9% |
| Middle School | 19 | 27.9% |
| High School | 14 | 20.6% |
| College / Undergraduate | 8 | 11.8% |
| Graduate / Professional | 0 | 0.0% |
| Total | 68 | 100.0% |
School Enrollment by Age by Funding Source in Harlingen
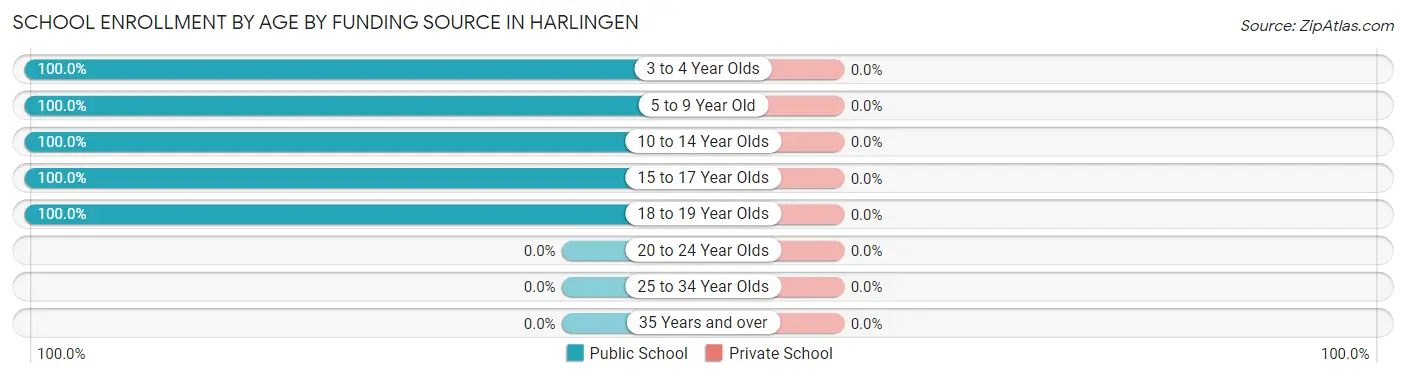
| Age Bracket | Public School | Private School |
| 3 to 4 Year Olds | 6 (100.0%) | 0 (0.0%) |
| 5 to 9 Year Old | 21 (100.0%) | 0 (0.0%) |
| 10 to 14 Year Olds | 19 (100.0%) | 0 (0.0%) |
| 15 to 17 Year Olds | 14 (100.0%) | 0 (0.0%) |
| 18 to 19 Year Olds | 8 (100.0%) | 0 (0.0%) |
| 20 to 24 Year Olds | 0 (0.0%) | 0 (0.0%) |
| 25 to 34 Year Olds | 0 (0.0%) | 0 (0.0%) |
| 35 Years and over | 0 (0.0%) | 0 (0.0%) |
| Total | 68 (100.0%) | 0 (0.0%) |
Educational Attainment by Field of Study in Harlingen
Engineering (76 | 24.0%), education (71 | 22.5%), computers & mathematics (26 | 8.2%), psychology (25 | 7.9%), and liberal arts & history (25 | 7.9%) are the most common fields of study among 316 individuals in Harlingen who have obtained a bachelor's degree or higher.
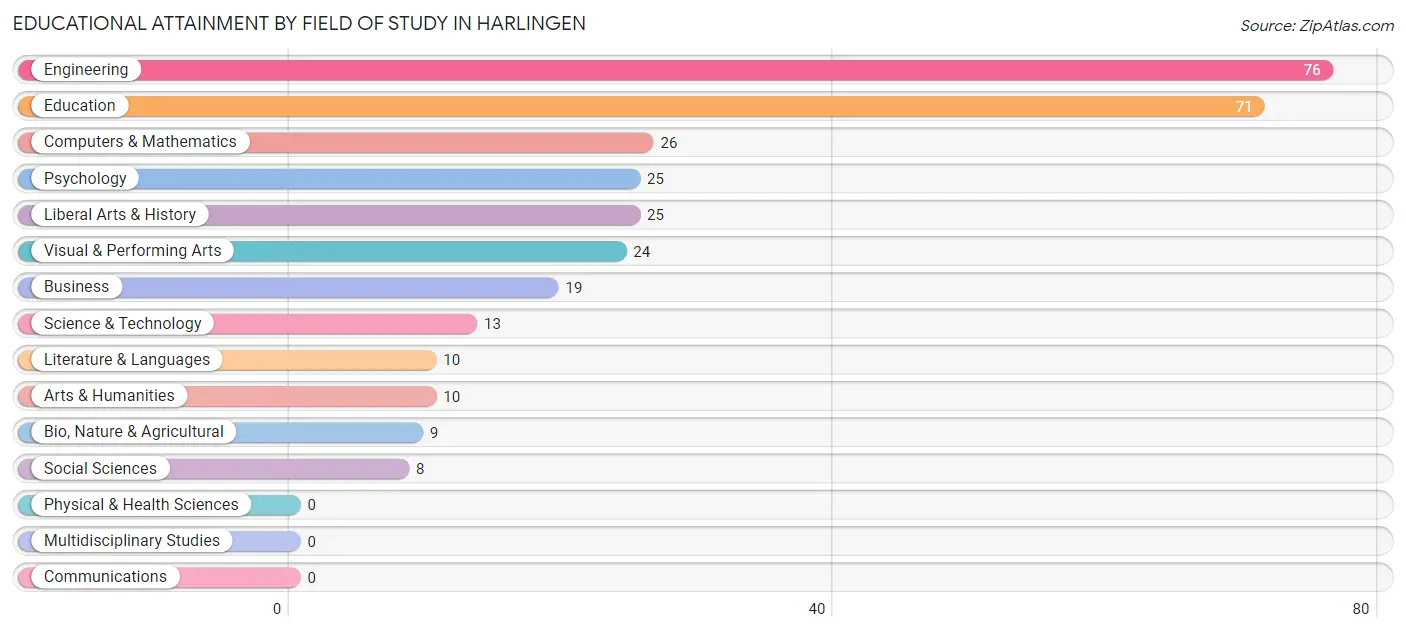
| Field of Study | # Graduates | % Graduates |
| Computers & Mathematics | 26 | 8.2% |
| Bio, Nature & Agricultural | 9 | 2.9% |
| Physical & Health Sciences | 0 | 0.0% |
| Psychology | 25 | 7.9% |
| Social Sciences | 8 | 2.5% |
| Engineering | 76 | 24.0% |
| Multidisciplinary Studies | 0 | 0.0% |
| Science & Technology | 13 | 4.1% |
| Business | 19 | 6.0% |
| Education | 71 | 22.5% |
| Literature & Languages | 10 | 3.2% |
| Liberal Arts & History | 25 | 7.9% |
| Visual & Performing Arts | 24 | 7.6% |
| Communications | 0 | 0.0% |
| Arts & Humanities | 10 | 3.2% |
| Total | 316 | 100.0% |
Transportation & Commute in Harlingen
Vehicle Availability by Sex in Harlingen
The most prevalent vehicle ownership categories in Harlingen are males with 2 vehicles (75, accounting for 48.7%) and females with 2 vehicles (73, making up 57.3%).
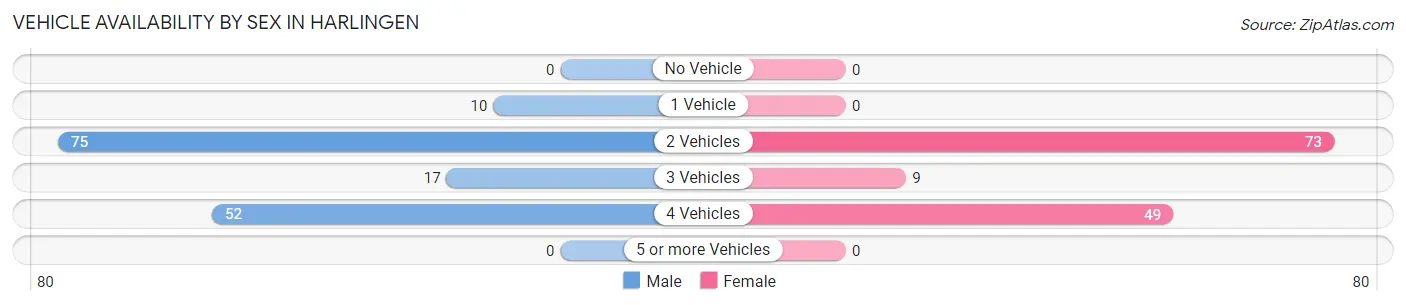
| Vehicles Available | Male | Female |
| No Vehicle | 0 (0.0%) | 0 (0.0%) |
| 1 Vehicle | 10 (6.5%) | 0 (0.0%) |
| 2 Vehicles | 75 (48.7%) | 73 (55.7%) |
| 3 Vehicles | 17 (11.0%) | 9 (6.9%) |
| 4 Vehicles | 52 (33.8%) | 49 (37.4%) |
| 5 or more Vehicles | 0 (0.0%) | 0 (0.0%) |
| Total | 154 (100.0%) | 131 (100.0%) |
Commute Time in Harlingen
The most frequently occuring commute durations in Harlingen are 30 to 34 minutes (88 commuters, 35.3%), 25 to 29 minutes (53 commuters, 21.3%), and 35 to 39 minutes (43 commuters, 17.3%).
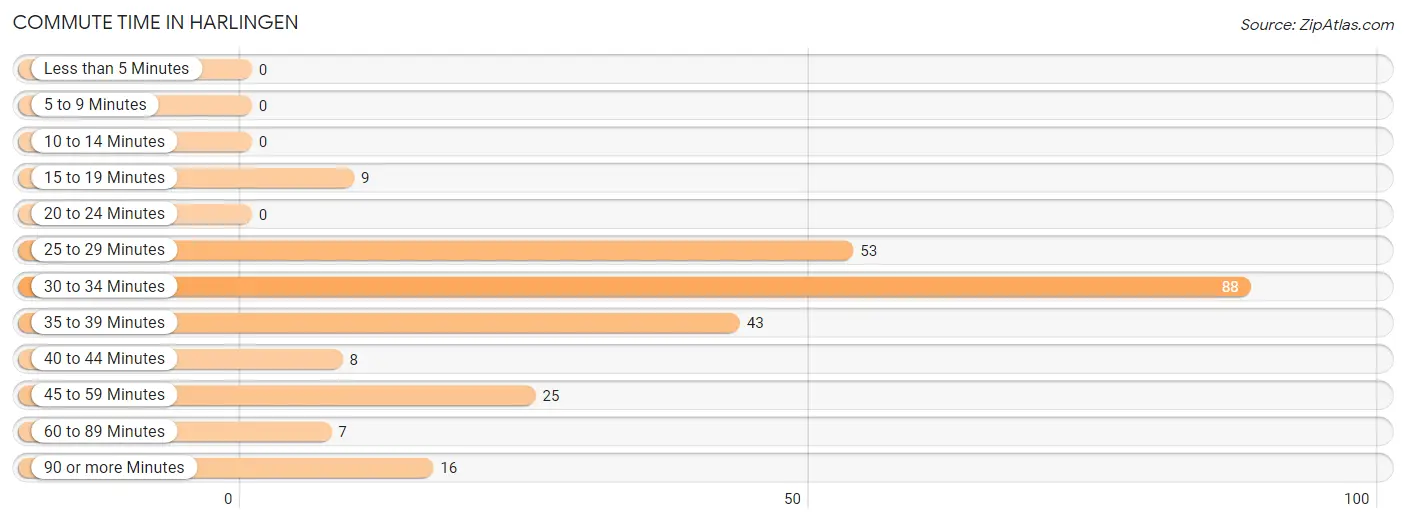
| Commute Time | # Commuters | % Commuters |
| Less than 5 Minutes | 0 | 0.0% |
| 5 to 9 Minutes | 0 | 0.0% |
| 10 to 14 Minutes | 0 | 0.0% |
| 15 to 19 Minutes | 9 | 3.6% |
| 20 to 24 Minutes | 0 | 0.0% |
| 25 to 29 Minutes | 53 | 21.3% |
| 30 to 34 Minutes | 88 | 35.3% |
| 35 to 39 Minutes | 43 | 17.3% |
| 40 to 44 Minutes | 8 | 3.2% |
| 45 to 59 Minutes | 25 | 10.0% |
| 60 to 89 Minutes | 7 | 2.8% |
| 90 or more Minutes | 16 | 6.4% |
Commute Time by Sex in Harlingen
The most common commute times in Harlingen are 25 to 29 minutes (43 commuters, 33.9%) for males and 30 to 34 minutes (72 commuters, 59.0%) for females.
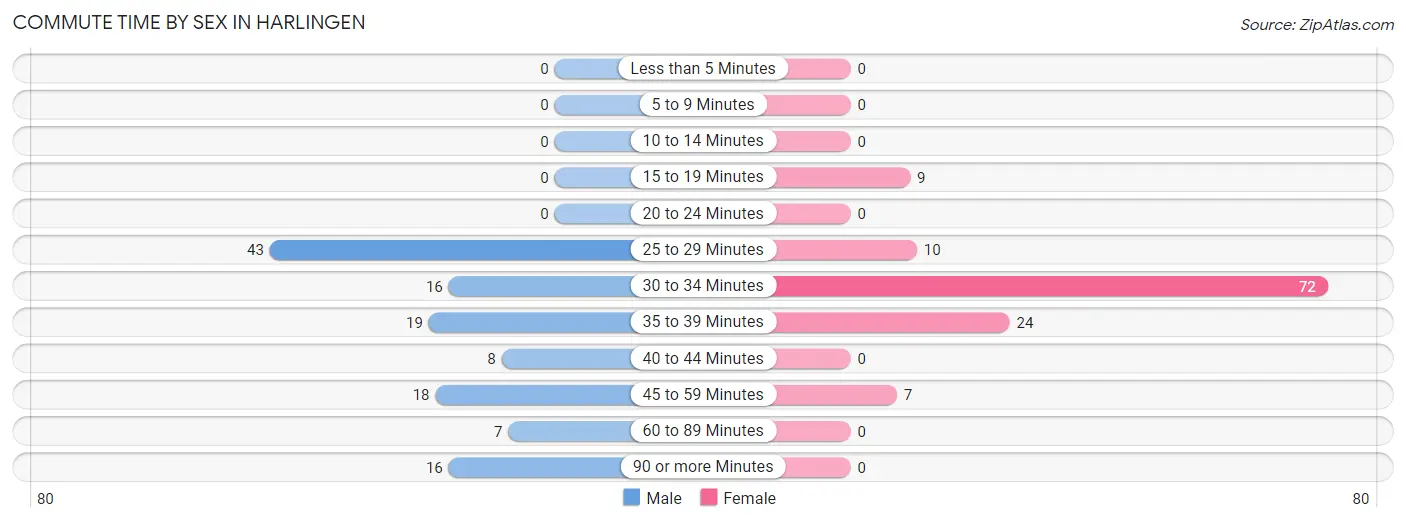
| Commute Time | Male | Female |
| Less than 5 Minutes | 0 (0.0%) | 0 (0.0%) |
| 5 to 9 Minutes | 0 (0.0%) | 0 (0.0%) |
| 10 to 14 Minutes | 0 (0.0%) | 0 (0.0%) |
| 15 to 19 Minutes | 0 (0.0%) | 9 (7.4%) |
| 20 to 24 Minutes | 0 (0.0%) | 0 (0.0%) |
| 25 to 29 Minutes | 43 (33.9%) | 10 (8.2%) |
| 30 to 34 Minutes | 16 (12.6%) | 72 (59.0%) |
| 35 to 39 Minutes | 19 (15.0%) | 24 (19.7%) |
| 40 to 44 Minutes | 8 (6.3%) | 0 (0.0%) |
| 45 to 59 Minutes | 18 (14.2%) | 7 (5.7%) |
| 60 to 89 Minutes | 7 (5.5%) | 0 (0.0%) |
| 90 or more Minutes | 16 (12.6%) | 0 (0.0%) |
Time of Departure to Work by Sex in Harlingen
The most frequent times of departure to work in Harlingen are 7:00 AM to 7:29 AM (43, 33.9%) for males and 8:30 AM to 8:59 AM (39, 32.0%) for females.
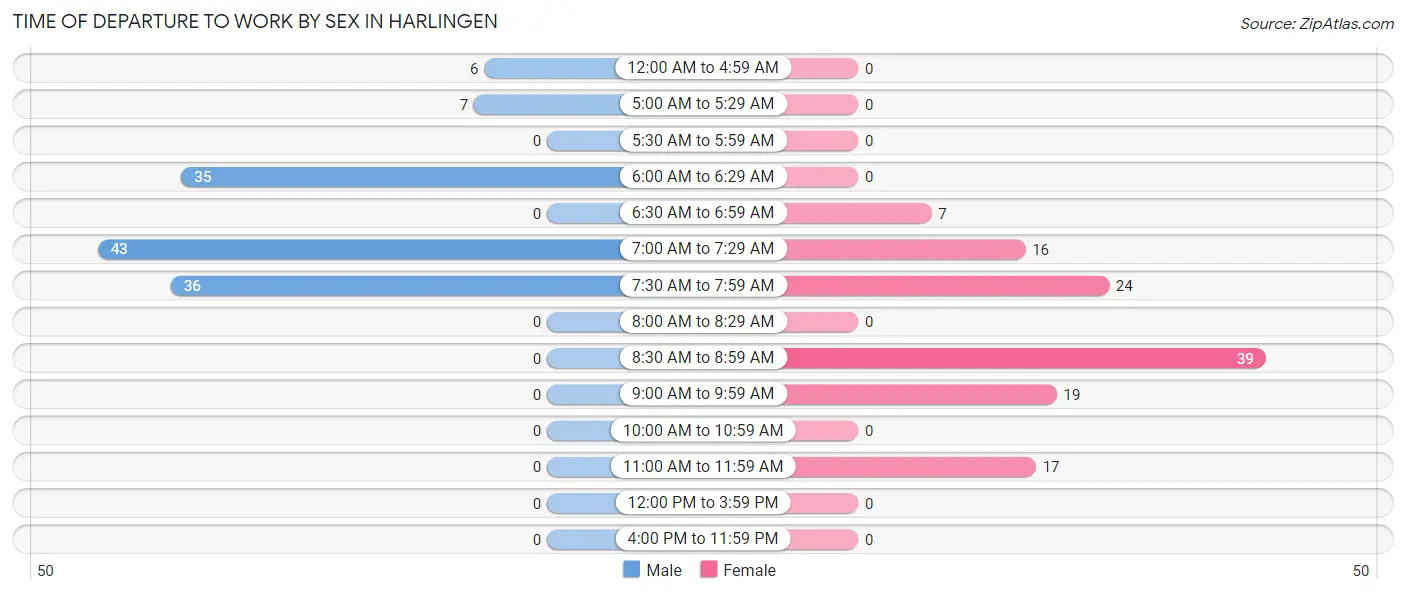
| Time of Departure | Male | Female |
| 12:00 AM to 4:59 AM | 6 (4.7%) | 0 (0.0%) |
| 5:00 AM to 5:29 AM | 7 (5.5%) | 0 (0.0%) |
| 5:30 AM to 5:59 AM | 0 (0.0%) | 0 (0.0%) |
| 6:00 AM to 6:29 AM | 35 (27.6%) | 0 (0.0%) |
| 6:30 AM to 6:59 AM | 0 (0.0%) | 7 (5.7%) |
| 7:00 AM to 7:29 AM | 43 (33.9%) | 16 (13.1%) |
| 7:30 AM to 7:59 AM | 36 (28.3%) | 24 (19.7%) |
| 8:00 AM to 8:29 AM | 0 (0.0%) | 0 (0.0%) |
| 8:30 AM to 8:59 AM | 0 (0.0%) | 39 (32.0%) |
| 9:00 AM to 9:59 AM | 0 (0.0%) | 19 (15.6%) |
| 10:00 AM to 10:59 AM | 0 (0.0%) | 0 (0.0%) |
| 11:00 AM to 11:59 AM | 0 (0.0%) | 17 (13.9%) |
| 12:00 PM to 3:59 PM | 0 (0.0%) | 0 (0.0%) |
| 4:00 PM to 11:59 PM | 0 (0.0%) | 0 (0.0%) |
| Total | 127 (100.0%) | 122 (100.0%) |
Housing Occupancy in Harlingen
Occupancy by Ownership in Harlingen
Of the total 140 dwellings in Harlingen, owner-occupied units account for 132 (94.3%), while renter-occupied units make up 8 (5.7%).
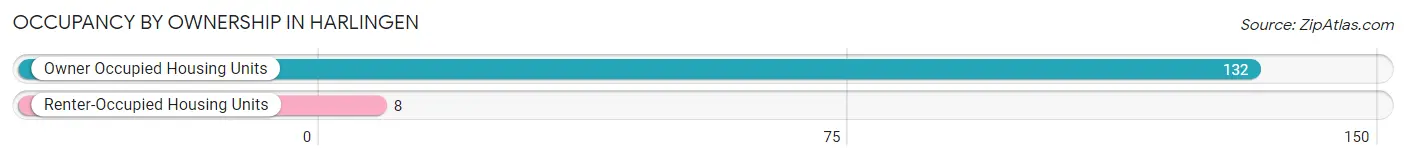
| Occupancy | # Housing Units | % Housing Units |
| Owner Occupied Housing Units | 132 | 94.3% |
| Renter-Occupied Housing Units | 8 | 5.7% |
| Total Occupied Housing Units | 140 | 100.0% |
Occupancy by Household Size in Harlingen
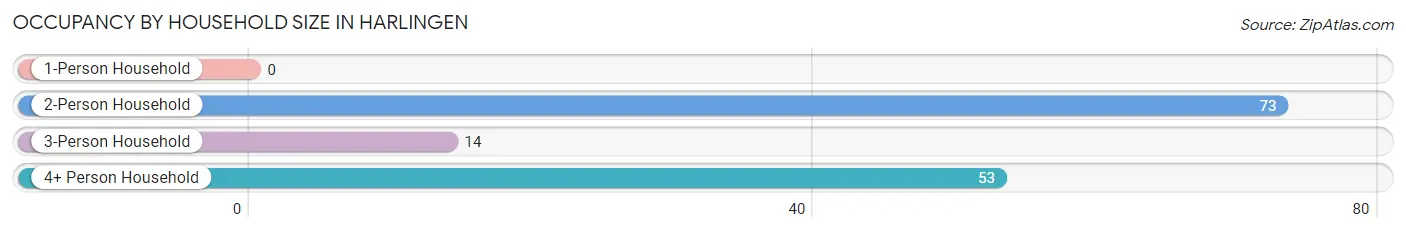
| Household Size | # Housing Units | % Housing Units |
| 1-Person Household | 0 | 0.0% |
| 2-Person Household | 73 | 52.1% |
| 3-Person Household | 14 | 10.0% |
| 4+ Person Household | 53 | 37.9% |
| Total Housing Units | 140 | 100.0% |
Occupancy by Ownership by Household Size in Harlingen
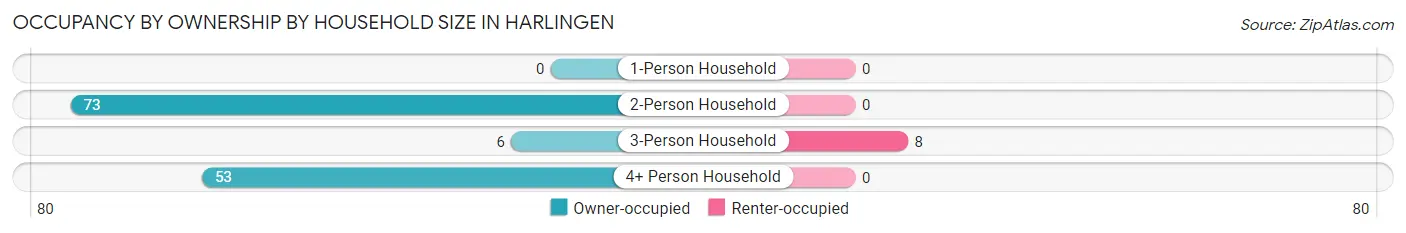
| Household Size | Owner-occupied | Renter-occupied |
| 1-Person Household | 0 (0.0%) | 0 (0.0%) |
| 2-Person Household | 73 (100.0%) | 0 (0.0%) |
| 3-Person Household | 6 (42.9%) | 8 (57.1%) |
| 4+ Person Household | 53 (100.0%) | 0 (0.0%) |
| Total Housing Units | 132 (94.3%) | 8 (5.7%) |
Occupancy by Educational Attainment in Harlingen
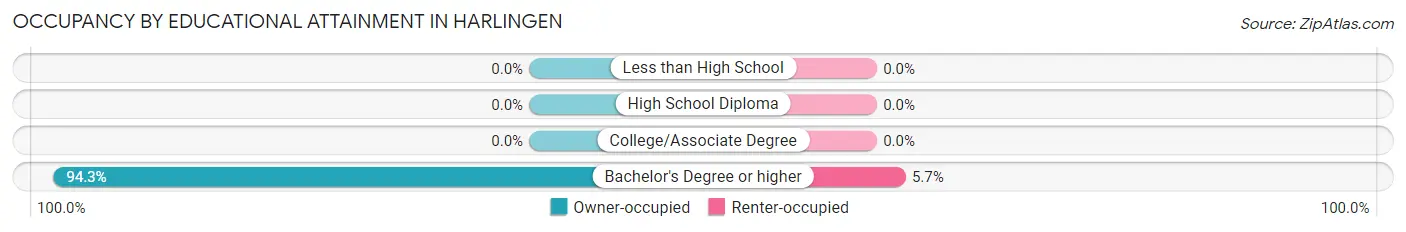
| Household Size | Owner-occupied | Renter-occupied |
| Less than High School | 0 (0.0%) | 0 (0.0%) |
| High School Diploma | 0 (0.0%) | 0 (0.0%) |
| College/Associate Degree | 0 (0.0%) | 0 (0.0%) |
| Bachelor's Degree or higher | 132 (94.3%) | 8 (5.7%) |
Occupancy by Age of Householder in Harlingen
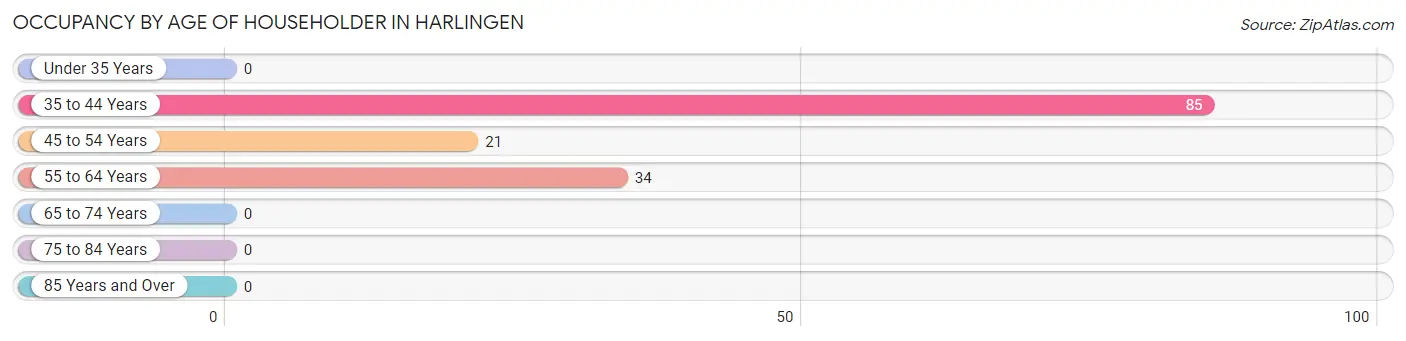
| Age Bracket | # Households | % Households |
| Under 35 Years | 0 | 0.0% |
| 35 to 44 Years | 85 | 60.7% |
| 45 to 54 Years | 21 | 15.0% |
| 55 to 64 Years | 34 | 24.3% |
| 65 to 74 Years | 0 | 0.0% |
| 75 to 84 Years | 0 | 0.0% |
| 85 Years and Over | 0 | 0.0% |
| Total | 140 | 100.0% |
Housing Finances in Harlingen
Median Income by Occupancy in Harlingen
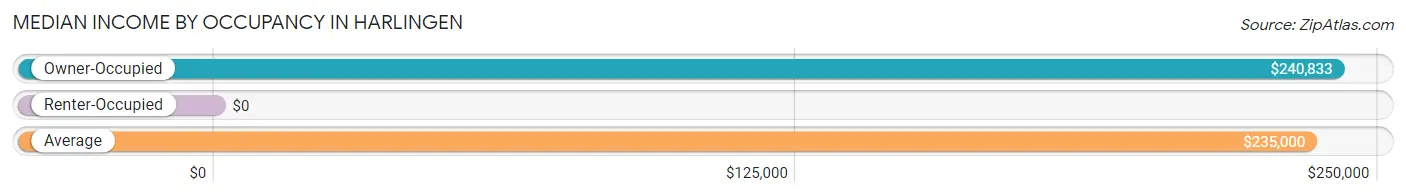
| Occupancy Type | # Households | Median Income |
| Owner-Occupied | 132 (94.3%) | $240,833 |
| Renter-Occupied | 8 (5.7%) | $0 |
| Average | 140 (100.0%) | $235,000 |
Occupancy by Householder Income Bracket in Harlingen
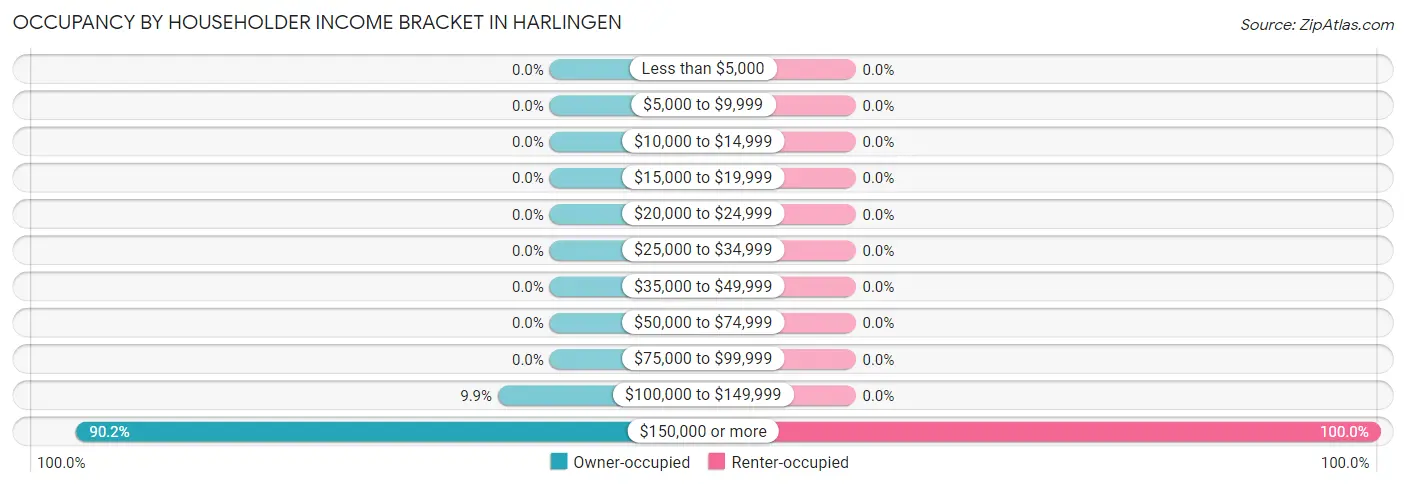
| Income Bracket | Owner-occupied | Renter-occupied |
| Less than $5,000 | 0 (0.0%) | 0 (0.0%) |
| $5,000 to $9,999 | 0 (0.0%) | 0 (0.0%) |
| $10,000 to $14,999 | 0 (0.0%) | 0 (0.0%) |
| $15,000 to $19,999 | 0 (0.0%) | 0 (0.0%) |
| $20,000 to $24,999 | 0 (0.0%) | 0 (0.0%) |
| $25,000 to $34,999 | 0 (0.0%) | 0 (0.0%) |
| $35,000 to $49,999 | 0 (0.0%) | 0 (0.0%) |
| $50,000 to $74,999 | 0 (0.0%) | 0 (0.0%) |
| $75,000 to $99,999 | 0 (0.0%) | 0 (0.0%) |
| $100,000 to $149,999 | 13 (9.9%) | 0 (0.0%) |
| $150,000 or more | 119 (90.1%) | 8 (100.0%) |
| Total | 132 (100.0%) | 8 (100.0%) |
Monthly Housing Cost Tiers in Harlingen
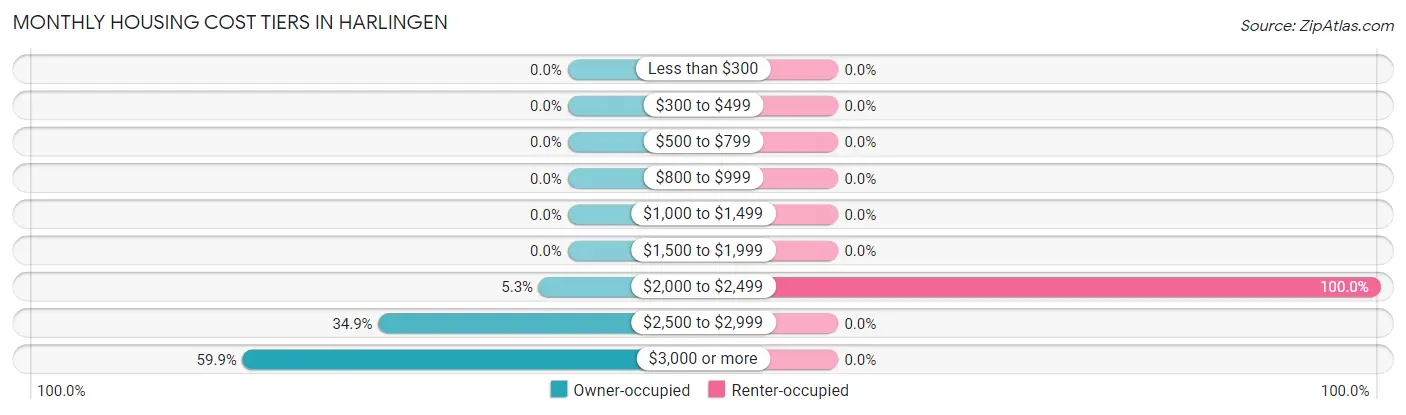
| Monthly Cost | Owner-occupied | Renter-occupied |
| Less than $300 | 0 (0.0%) | 0 (0.0%) |
| $300 to $499 | 0 (0.0%) | 0 (0.0%) |
| $500 to $799 | 0 (0.0%) | 0 (0.0%) |
| $800 to $999 | 0 (0.0%) | 0 (0.0%) |
| $1,000 to $1,499 | 0 (0.0%) | 0 (0.0%) |
| $1,500 to $1,999 | 0 (0.0%) | 0 (0.0%) |
| $2,000 to $2,499 | 7 (5.3%) | 8 (100.0%) |
| $2,500 to $2,999 | 46 (34.8%) | 0 (0.0%) |
| $3,000 or more | 79 (59.9%) | 0 (0.0%) |
| Total | 132 (100.0%) | 8 (100.0%) |
Physical Housing Characteristics in Harlingen
Housing Structures in Harlingen
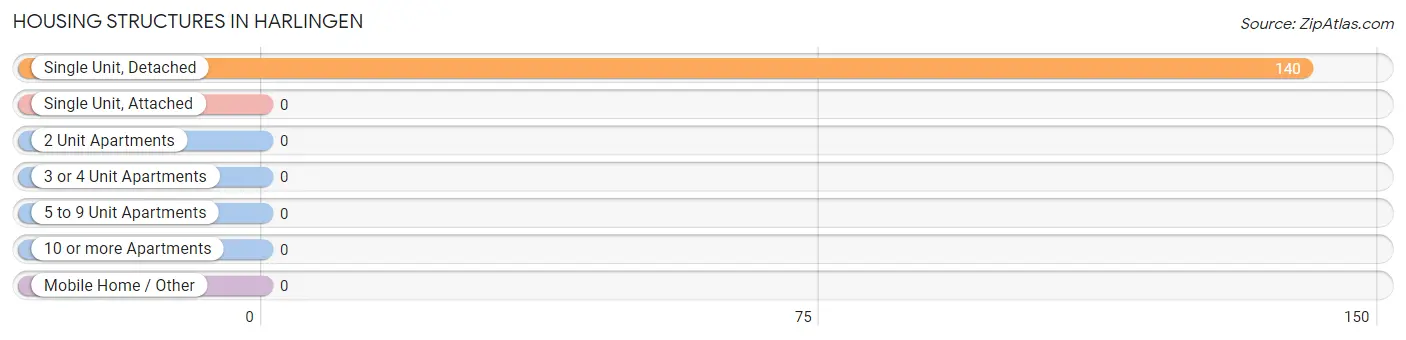
| Structure Type | # Housing Units | % Housing Units |
| Single Unit, Detached | 140 | 100.0% |
| Single Unit, Attached | 0 | 0.0% |
| 2 Unit Apartments | 0 | 0.0% |
| 3 or 4 Unit Apartments | 0 | 0.0% |
| 5 to 9 Unit Apartments | 0 | 0.0% |
| 10 or more Apartments | 0 | 0.0% |
| Mobile Home / Other | 0 | 0.0% |
| Total | 140 | 100.0% |
Housing Structures by Occupancy in Harlingen
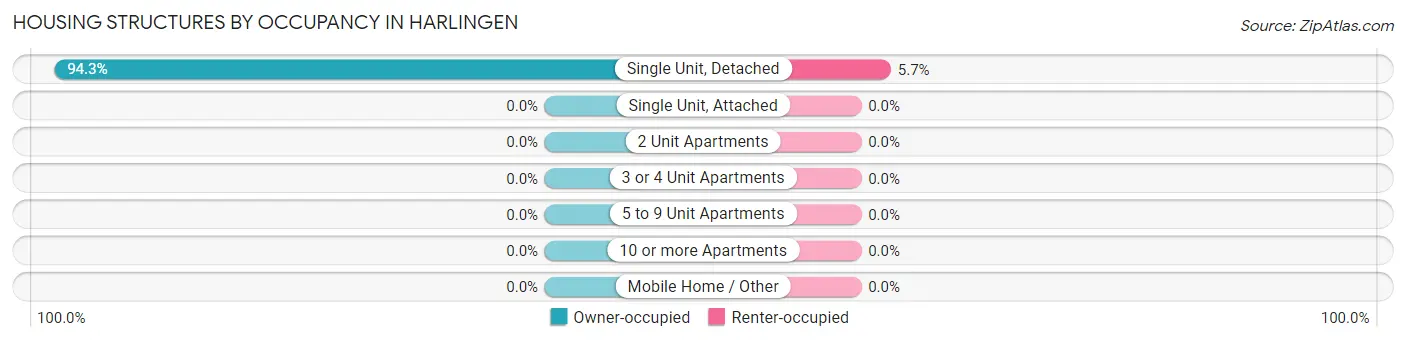
| Structure Type | Owner-occupied | Renter-occupied |
| Single Unit, Detached | 132 (94.3%) | 8 (5.7%) |
| Single Unit, Attached | 0 (0.0%) | 0 (0.0%) |
| 2 Unit Apartments | 0 (0.0%) | 0 (0.0%) |
| 3 or 4 Unit Apartments | 0 (0.0%) | 0 (0.0%) |
| 5 to 9 Unit Apartments | 0 (0.0%) | 0 (0.0%) |
| 10 or more Apartments | 0 (0.0%) | 0 (0.0%) |
| Mobile Home / Other | 0 (0.0%) | 0 (0.0%) |
| Total | 132 (94.3%) | 8 (5.7%) |
Housing Structures by Number of Rooms in Harlingen
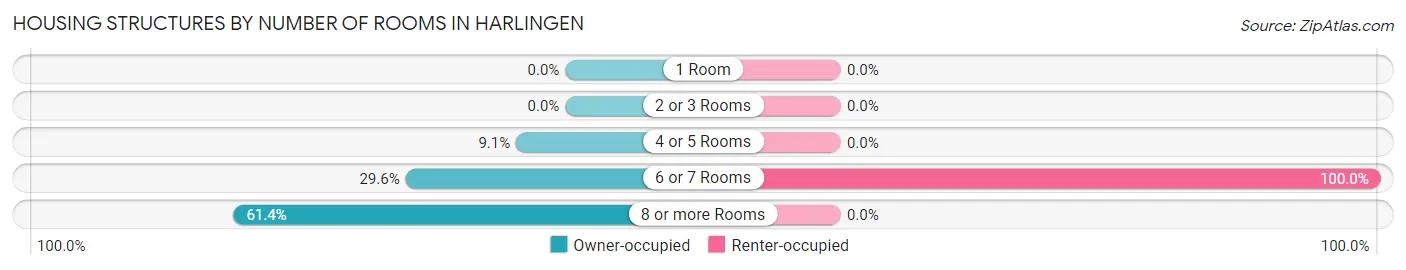
| Number of Rooms | Owner-occupied | Renter-occupied |
| 1 Room | 0 (0.0%) | 0 (0.0%) |
| 2 or 3 Rooms | 0 (0.0%) | 0 (0.0%) |
| 4 or 5 Rooms | 12 (9.1%) | 0 (0.0%) |
| 6 or 7 Rooms | 39 (29.5%) | 8 (100.0%) |
| 8 or more Rooms | 81 (61.4%) | 0 (0.0%) |
| Total | 132 (100.0%) | 8 (100.0%) |
Housing Structure by Heating Type in Harlingen
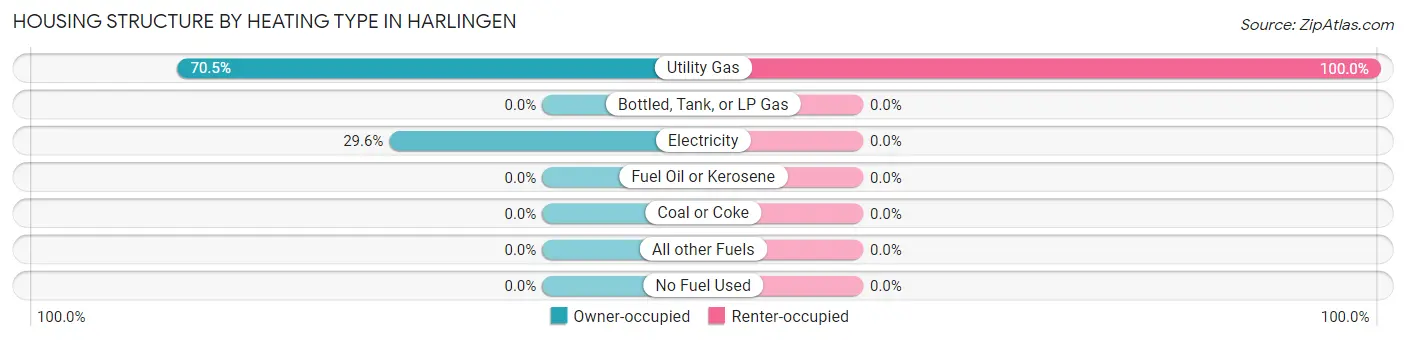
| Heating Type | Owner-occupied | Renter-occupied |
| Utility Gas | 93 (70.5%) | 8 (100.0%) |
| Bottled, Tank, or LP Gas | 0 (0.0%) | 0 (0.0%) |
| Electricity | 39 (29.5%) | 0 (0.0%) |
| Fuel Oil or Kerosene | 0 (0.0%) | 0 (0.0%) |
| Coal or Coke | 0 (0.0%) | 0 (0.0%) |
| All other Fuels | 0 (0.0%) | 0 (0.0%) |
| No Fuel Used | 0 (0.0%) | 0 (0.0%) |
| Total | 132 (100.0%) | 8 (100.0%) |
Household Vehicle Usage in Harlingen
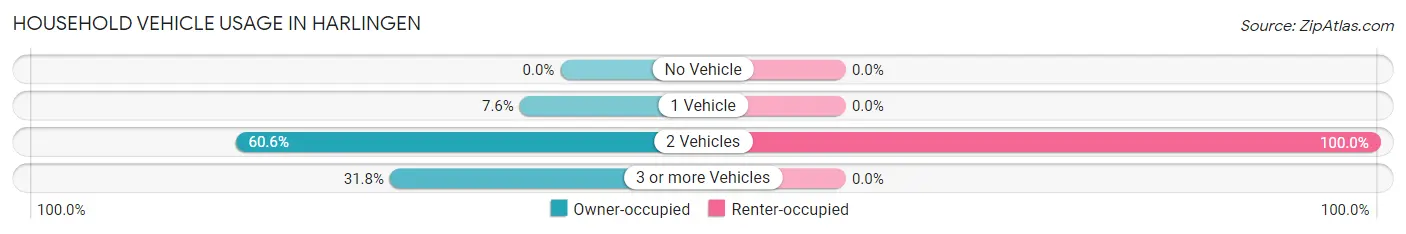
| Vehicles per Household | Owner-occupied | Renter-occupied |
| No Vehicle | 0 (0.0%) | 0 (0.0%) |
| 1 Vehicle | 10 (7.6%) | 0 (0.0%) |
| 2 Vehicles | 80 (60.6%) | 8 (100.0%) |
| 3 or more Vehicles | 42 (31.8%) | 0 (0.0%) |
| Total | 132 (100.0%) | 8 (100.0%) |
Real Estate & Mortgages in Harlingen
Real Estate and Mortgage Overview in Harlingen
| Characteristic | Without Mortgage | With Mortgage |
| Housing Units | 14 | 118 |
| Median Property Value | - | - |
| Median Household Income | - | - |
| Monthly Housing Costs | - | - |
| Real Estate Taxes | - | - |
Property Value by Mortgage Status in Harlingen
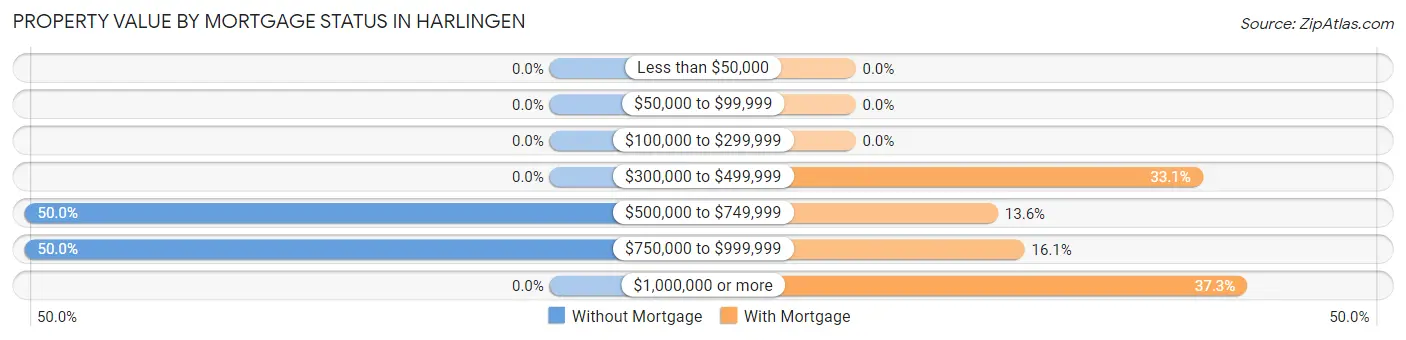
| Property Value | Without Mortgage | With Mortgage |
| Less than $50,000 | 0 (0.0%) | 0 (0.0%) |
| $50,000 to $99,999 | 0 (0.0%) | 0 (0.0%) |
| $100,000 to $299,999 | 0 (0.0%) | 0 (0.0%) |
| $300,000 to $499,999 | 0 (0.0%) | 39 (33.1%) |
| $500,000 to $749,999 | 7 (50.0%) | 16 (13.6%) |
| $750,000 to $999,999 | 7 (50.0%) | 19 (16.1%) |
| $1,000,000 or more | 0 (0.0%) | 44 (37.3%) |
| Total | 14 (100.0%) | 118 (100.0%) |
Household Income by Mortgage Status in Harlingen
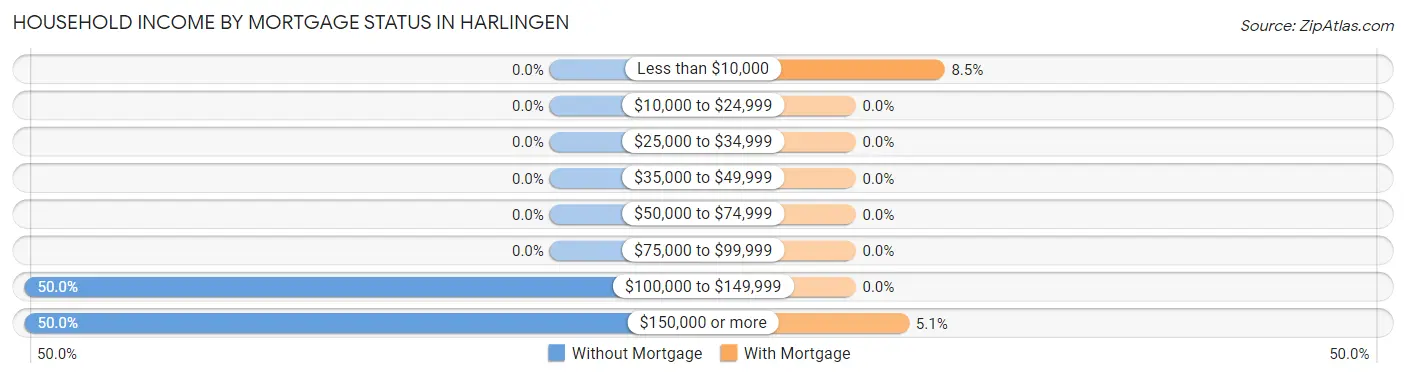
| Household Income | Without Mortgage | With Mortgage |
| Less than $10,000 | 0 (0.0%) | 10 (8.5%) |
| $10,000 to $24,999 | 0 (0.0%) | 0 (0.0%) |
| $25,000 to $34,999 | 0 (0.0%) | 0 (0.0%) |
| $35,000 to $49,999 | 0 (0.0%) | 0 (0.0%) |
| $50,000 to $74,999 | 0 (0.0%) | 0 (0.0%) |
| $75,000 to $99,999 | 0 (0.0%) | 0 (0.0%) |
| $100,000 to $149,999 | 7 (50.0%) | 0 (0.0%) |
| $150,000 or more | 7 (50.0%) | 6 (5.1%) |
| Total | 14 (100.0%) | 118 (100.0%) |
Property Value to Household Income Ratio in Harlingen
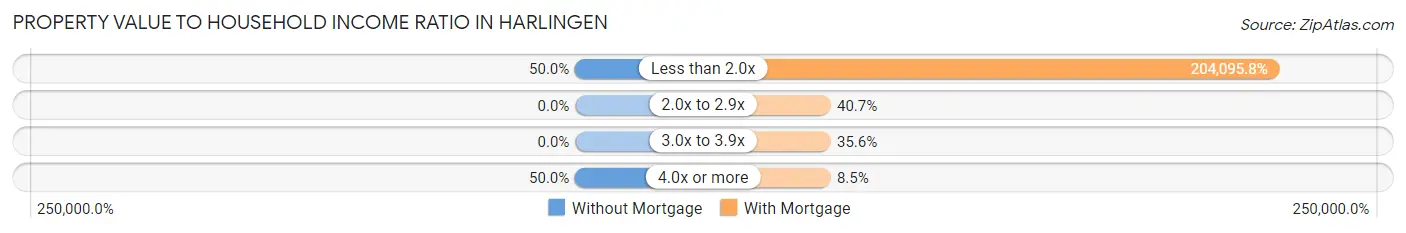
| Value-to-Income Ratio | Without Mortgage | With Mortgage |
| Less than 2.0x | 7 (50.0%) | 240,833 (204,095.8%) |
| 2.0x to 2.9x | 0 (0.0%) | 48 (40.7%) |
| 3.0x to 3.9x | 0 (0.0%) | 42 (35.6%) |
| 4.0x or more | 7 (50.0%) | 10 (8.5%) |
| Total | 14 (100.0%) | 118 (100.0%) |
Real Estate Taxes by Mortgage Status in Harlingen
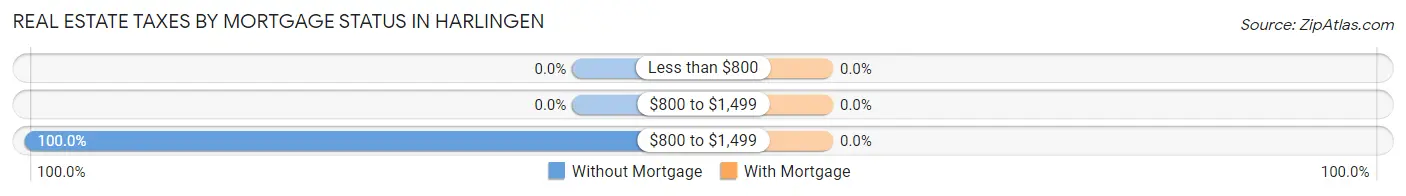
| Property Taxes | Without Mortgage | With Mortgage |
| Less than $800 | 0 (0.0%) | 0 (0.0%) |
| $800 to $1,499 | 0 (0.0%) | 0 (0.0%) |
| $800 to $1,499 | 14 (100.0%) | 0 (0.0%) |
| Total | 14 (100.0%) | 118 (100.0%) |
Health & Disability in Harlingen
Health Insurance Coverage by Age in Harlingen
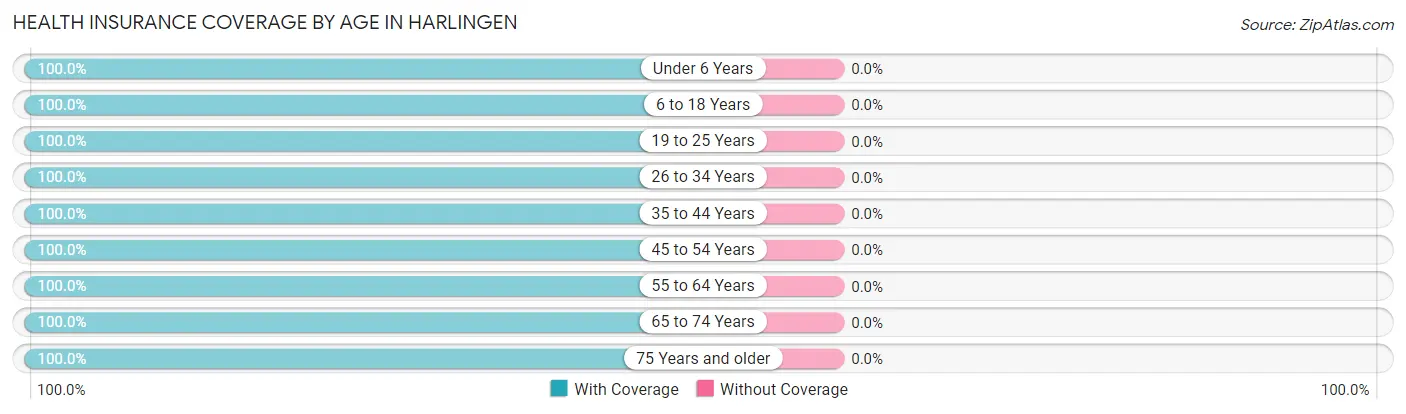
| Age Bracket | With Coverage | Without Coverage |
| Under 6 Years | 26 (100.0%) | 0 (0.0%) |
| 6 to 18 Years | 54 (100.0%) | 0 (0.0%) |
| 19 to 25 Years | 8 (100.0%) | 0 (0.0%) |
| 26 to 34 Years | 7 (100.0%) | 0 (0.0%) |
| 35 to 44 Years | 158 (100.0%) | 0 (0.0%) |
| 45 to 54 Years | 57 (100.0%) | 0 (0.0%) |
| 55 to 64 Years | 88 (100.0%) | 0 (0.0%) |
| 65 to 74 Years | 8 (100.0%) | 0 (0.0%) |
| 75 Years and older | 23 (100.0%) | 0 (0.0%) |
| Total | 429 (100.0%) | 0 (0.0%) |
Health Insurance Coverage by Citizenship Status in Harlingen
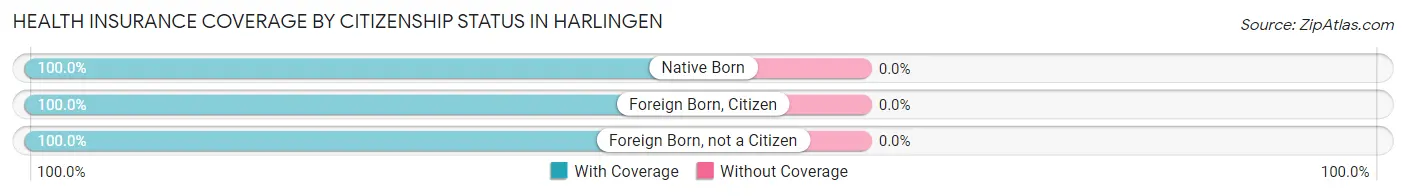
| Citizenship Status | With Coverage | Without Coverage |
| Native Born | 26 (100.0%) | 0 (0.0%) |
| Foreign Born, Citizen | 54 (100.0%) | 0 (0.0%) |
| Foreign Born, not a Citizen | 8 (100.0%) | 0 (0.0%) |
Health Insurance Coverage by Household Income in Harlingen
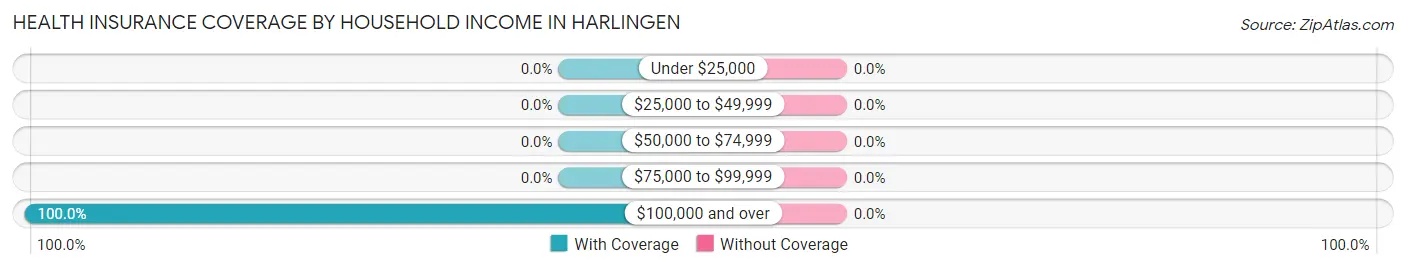
| Household Income | With Coverage | Without Coverage |
| Under $25,000 | 0 (0.0%) | 0 (0.0%) |
| $25,000 to $49,999 | 0 (0.0%) | 0 (0.0%) |
| $50,000 to $74,999 | 0 (0.0%) | 0 (0.0%) |
| $75,000 to $99,999 | 0 (0.0%) | 0 (0.0%) |
| $100,000 and over | 429 (100.0%) | 0 (0.0%) |
Public vs Private Health Insurance Coverage by Age in Harlingen
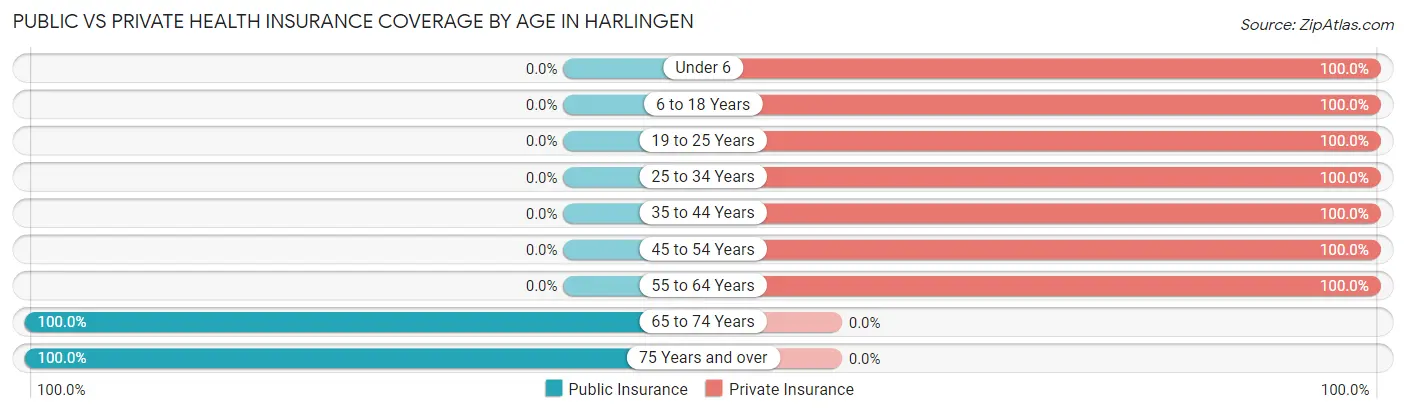
| Age Bracket | Public Insurance | Private Insurance |
| Under 6 | 0 (0.0%) | 26 (100.0%) |
| 6 to 18 Years | 0 (0.0%) | 54 (100.0%) |
| 19 to 25 Years | 0 (0.0%) | 8 (100.0%) |
| 25 to 34 Years | 0 (0.0%) | 7 (100.0%) |
| 35 to 44 Years | 0 (0.0%) | 158 (100.0%) |
| 45 to 54 Years | 0 (0.0%) | 57 (100.0%) |
| 55 to 64 Years | 0 (0.0%) | 88 (100.0%) |
| 65 to 74 Years | 8 (100.0%) | 0 (0.0%) |
| 75 Years and over | 23 (100.0%) | 0 (0.0%) |
| Total | 31 (7.2%) | 398 (92.8%) |
Disability Status by Sex by Age in Harlingen
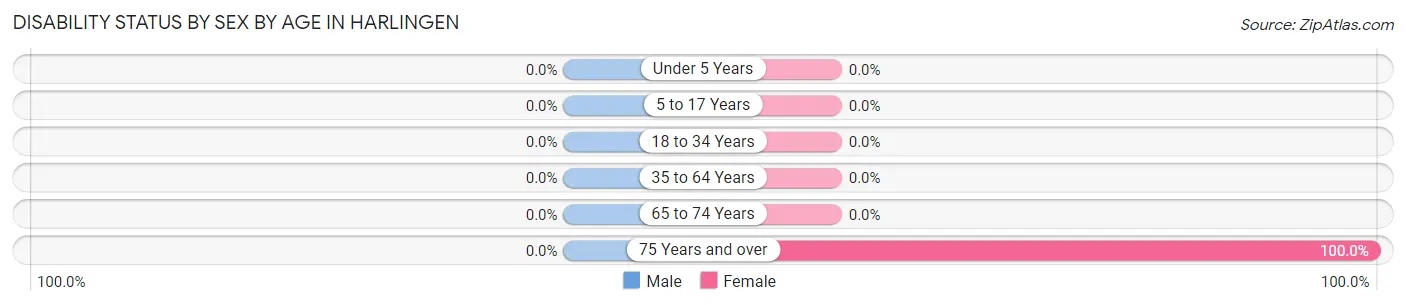
| Age Bracket | Male | Female |
| Under 5 Years | 0 (0.0%) | 0 (0.0%) |
| 5 to 17 Years | 0 (0.0%) | 0 (0.0%) |
| 18 to 34 Years | 0 (0.0%) | 0 (0.0%) |
| 35 to 64 Years | 0 (0.0%) | 0 (0.0%) |
| 65 to 74 Years | 0 (0.0%) | 0 (0.0%) |
| 75 Years and over | 0 (0.0%) | 23 (100.0%) |
Disability Class by Sex by Age in Harlingen
Disability Class: Hearing Difficulty
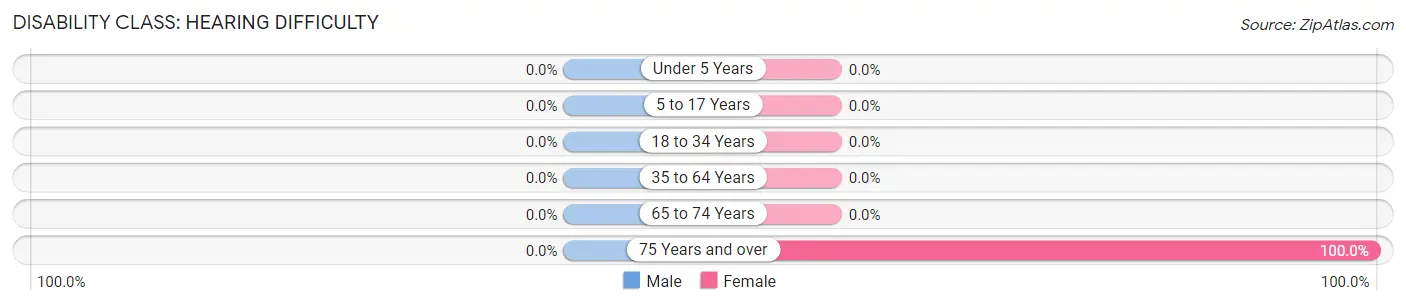
| Age Bracket | Male | Female |
| Under 5 Years | 0 (0.0%) | 0 (0.0%) |
| 5 to 17 Years | 0 (0.0%) | 0 (0.0%) |
| 18 to 34 Years | 0 (0.0%) | 0 (0.0%) |
| 35 to 64 Years | 0 (0.0%) | 0 (0.0%) |
| 65 to 74 Years | 0 (0.0%) | 0 (0.0%) |
| 75 Years and over | 0 (0.0%) | 23 (100.0%) |
Disability Class: Vision Difficulty
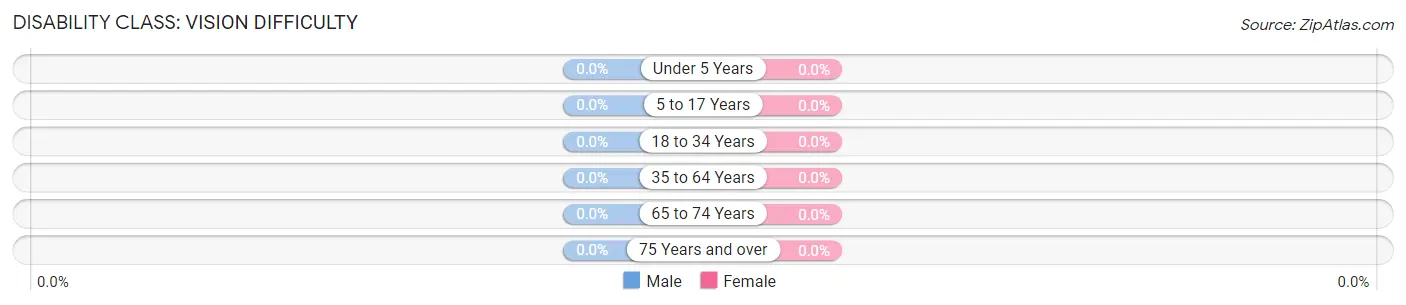
| Age Bracket | Male | Female |
| Under 5 Years | 0 (0.0%) | 0 (0.0%) |
| 5 to 17 Years | 0 (0.0%) | 0 (0.0%) |
| 18 to 34 Years | 0 (0.0%) | 0 (0.0%) |
| 35 to 64 Years | 0 (0.0%) | 0 (0.0%) |
| 65 to 74 Years | 0 (0.0%) | 0 (0.0%) |
| 75 Years and over | 0 (0.0%) | 0 (0.0%) |
Disability Class: Cognitive Difficulty
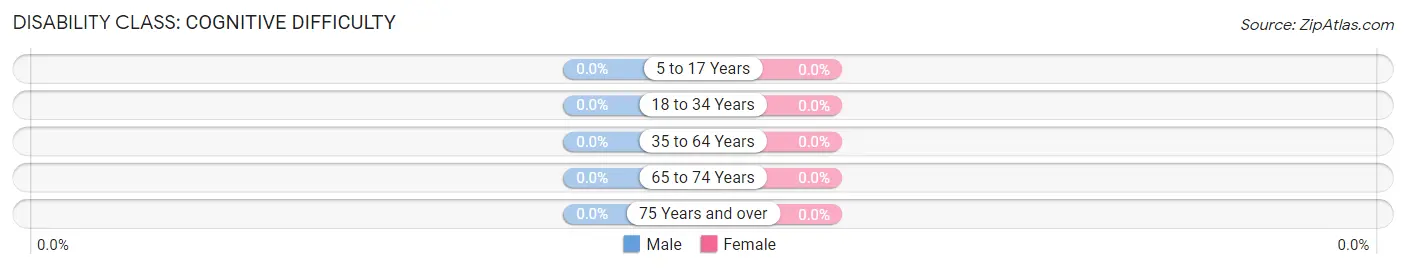
| Age Bracket | Male | Female |
| 5 to 17 Years | 0 (0.0%) | 0 (0.0%) |
| 18 to 34 Years | 0 (0.0%) | 0 (0.0%) |
| 35 to 64 Years | 0 (0.0%) | 0 (0.0%) |
| 65 to 74 Years | 0 (0.0%) | 0 (0.0%) |
| 75 Years and over | 0 (0.0%) | 0 (0.0%) |
Disability Class: Ambulatory Difficulty
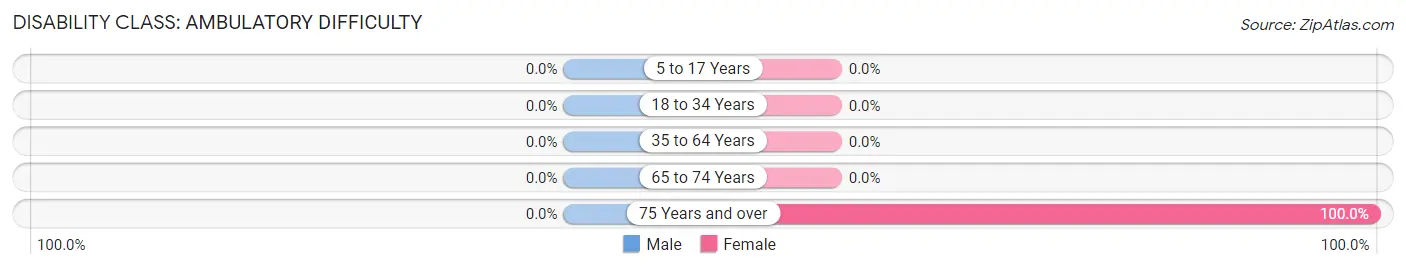
| Age Bracket | Male | Female |
| 5 to 17 Years | 0 (0.0%) | 0 (0.0%) |
| 18 to 34 Years | 0 (0.0%) | 0 (0.0%) |
| 35 to 64 Years | 0 (0.0%) | 0 (0.0%) |
| 65 to 74 Years | 0 (0.0%) | 0 (0.0%) |
| 75 Years and over | 0 (0.0%) | 23 (100.0%) |
Disability Class: Self-Care Difficulty
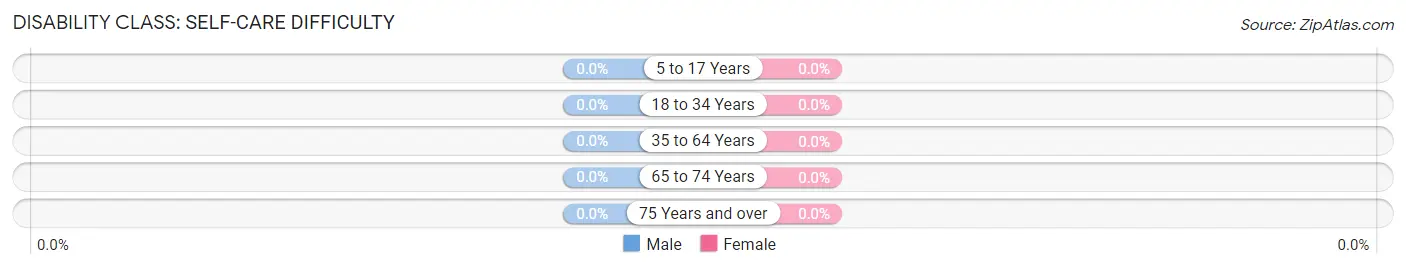
| Age Bracket | Male | Female |
| 5 to 17 Years | 0 (0.0%) | 0 (0.0%) |
| 18 to 34 Years | 0 (0.0%) | 0 (0.0%) |
| 35 to 64 Years | 0 (0.0%) | 0 (0.0%) |
| 65 to 74 Years | 0 (0.0%) | 0 (0.0%) |
| 75 Years and over | 0 (0.0%) | 0 (0.0%) |
Technology Access in Harlingen
Computing Device Access in Harlingen
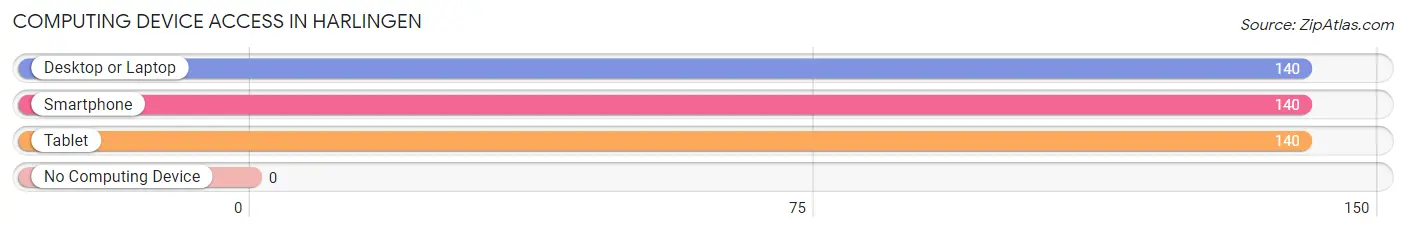
| Device Type | # Households | % Households |
| Desktop or Laptop | 140 | 100.0% |
| Smartphone | 140 | 100.0% |
| Tablet | 140 | 100.0% |
| No Computing Device | 0 | 0.0% |
| Total | 140 | 100.0% |
Internet Access in Harlingen
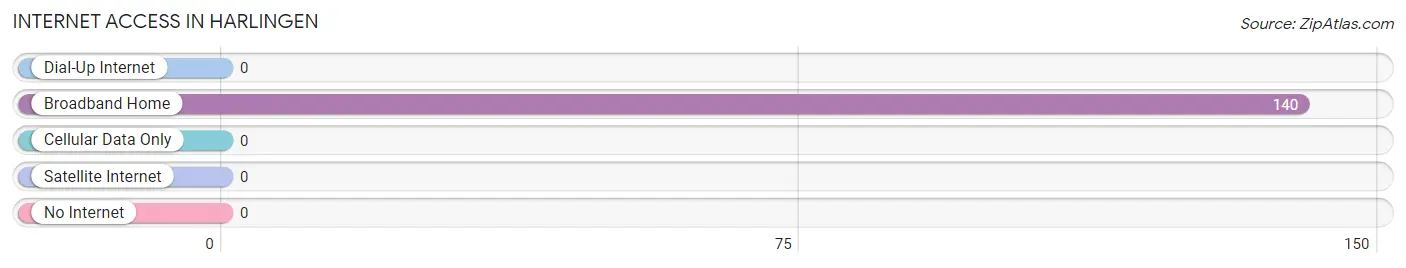
| Internet Type | # Households | % Households |
| Dial-Up Internet | 0 | 0.0% |
| Broadband Home | 140 | 100.0% |
| Cellular Data Only | 0 | 0.0% |
| Satellite Internet | 0 | 0.0% |
| No Internet | 0 | 0.0% |
| Total | 140 | 100.0% |
Harlingen Summary
Harlingen is a small town located in the state of New Jersey, United States. It is situated in the southern part of the state, in the county of Cumberland. The town has a population of approximately 2,000 people, according to the 2010 census.
History
Harlingen was founded in 1790 by a group of Dutch settlers who had migrated from the Netherlands. The town was named after the Dutch city of Harlingen, which is located in the province of Friesland. The settlers were attracted to the area due to its fertile soil and abundant natural resources. The town quickly grew and by the mid-1800s, it had become a thriving agricultural community.
In the late 1800s, the town began to experience a period of industrialization. The first industry to be established in Harlingen was a sawmill, which was followed by a brickyard and a canning factory. These industries provided employment for many of the town’s residents and helped to spur economic growth.
Geography
Harlingen is located in the southern part of New Jersey, in the county of Cumberland. The town is situated on the banks of the Maurice River, which flows through the area. The town is surrounded by a number of small towns and villages, including Port Norris, Millville, and Vineland.
The town has a total area of 1.3 square miles, all of which is land. The terrain is mostly flat, with some rolling hills in the northern part of the town. The climate is humid subtropical, with hot summers and mild winters.
Economy
The economy of Harlingen is largely based on agriculture and manufacturing. The town is home to a number of farms, which produce a variety of crops, including corn, soybeans, and wheat. The town also has a number of manufacturing plants, which produce a variety of products, including furniture, clothing, and electronics.
The town also has a number of small businesses, including restaurants, shops, and services. The town is also home to a number of tourist attractions, including the Maurice River Cruise, which offers boat tours of the area.
Demographics
According to the 2010 census, the population of Harlingen was 2,000. The racial makeup of the town was 94.2% White, 2.2% African American, 0.7% Native American, 0.7% Asian, and 2.2% from other races. The median household income was $45,000, and the median family income was $50,000.
The town has a large number of residents who are of Dutch descent. The town also has a significant Hispanic population, with many of the residents being of Mexican or Puerto Rican descent. The town also has a small population of Native Americans, with many of the residents being of the Lenape tribe.
Conclusion
Harlingen is a small town located in the state of New Jersey, United States. It was founded in 1790 by a group of Dutch settlers and has since grown into a thriving agricultural and industrial community. The town has a population of approximately 2,000 people, according to the 2010 census. The economy of Harlingen is largely based on agriculture and manufacturing, and the town is home to a number of small businesses, tourist attractions, and a diverse population.
Common Questions
What is Per Capita Income in Harlingen?
Per Capita income in Harlingen is $113,550.
What is the Median Family Income in Harlingen?
Median Family Income in Harlingen is $235,000.
What is the Median Household income in Harlingen?
Median Household Income in Harlingen is $235,000.
What is Inequality or Gini Index in Harlingen?
Inequality or Gini Index in Harlingen is 0.34.
What is the Total Population of Harlingen?
Total Population of Harlingen is 429.
What is the Total Male Population of Harlingen?
Total Male Population of Harlingen is 234.
What is the Total Female Population of Harlingen?
Total Female Population of Harlingen is 195.
What is the Ratio of Males per 100 Females in Harlingen?
There are 120.00 Males per 100 Females in Harlingen.
What is the Ratio of Females per 100 Males in Harlingen?
There are 83.33 Females per 100 Males in Harlingen.
What is the Median Population Age in Harlingen?
Median Population Age in Harlingen is 39.7 Years.
What is the Average Family Size in Harlingen
Average Family Size in Harlingen is 3.1 People.
What is the Average Household Size in Harlingen
Average Household Size in Harlingen is 3.1 People.
How Large is the Labor Force in Harlingen?
There are 295 People in the Labor Forcein in Harlingen.
What is the Percentage of People in the Labor Force in Harlingen?
81.3% of People are in the Labor Force in Harlingen.
What is the Unemployment Rate in Harlingen?
Unemployment Rate in Harlingen is 3.4%.