Rocky Hill borough, NJ Map & Demographics
Rocky Hill borough Overview
$82,593
PER CAPITA INCOME
$162,000
AVG FAMILY INCOME
$126,250
AVG HOUSEHOLD INCOME
40.7%
WAGE / INCOME GAP [ % ]
59.3¢/ $1
WAGE / INCOME GAP [ $ ]
0.52
INEQUALITY / GINI INDEX
794
TOTAL POPULATION
431
MALE POPULATION
363
FEMALE POPULATION
118.73
MALES / 100 FEMALES
84.22
FEMALES / 100 MALES
43.4
MEDIAN AGE
3.4
AVG FAMILY SIZE
2.6
AVG HOUSEHOLD SIZE
420
LABOR FORCE [ PEOPLE ]
64.3%
PERCENT IN LABOR FORCE
4.8%
UNEMPLOYMENT RATE
Income in Rocky Hill borough
Income Overview in Rocky Hill borough
Per Capita Income in Rocky Hill borough is $82,593, while median incomes of families and households are $162,000 and $126,250 respectively.
| Characteristic | Number | Measure |
| Per Capita Income | 794 | $82,593 |
| Median Family Income | 190 | $162,000 |
| Mean Family Income | 190 | $271,356 |
| Median Household Income | 295 | $126,250 |
| Mean Household Income | 295 | $221,108 |
| Income Deficit | 190 | $0 |
| Wage / Income Gap (%) | 794 | 40.74% |
| Wage / Income Gap ($) | 794 | 59.26¢ per $1 |
| Gini / Inequality Index | 794 | 0.52 |
Earnings by Sex in Rocky Hill borough
Average Earnings in Rocky Hill borough are $68,594, $78,750 for men and $46,667 for women, a difference of 40.7%.
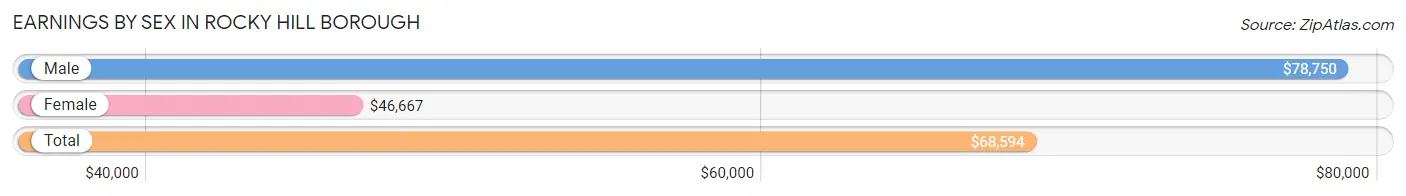
| Sex | Number | Average Earnings |
| Male | 219 (49.2%) | $78,750 |
| Female | 226 (50.8%) | $46,667 |
| Total | 445 (100.0%) | $68,594 |
Earnings by Sex by Income Bracket in Rocky Hill borough
The most common earnings brackets in Rocky Hill borough are $100,000+ for men (93 | 42.5%) and $100,000+ for women (50 | 22.1%).
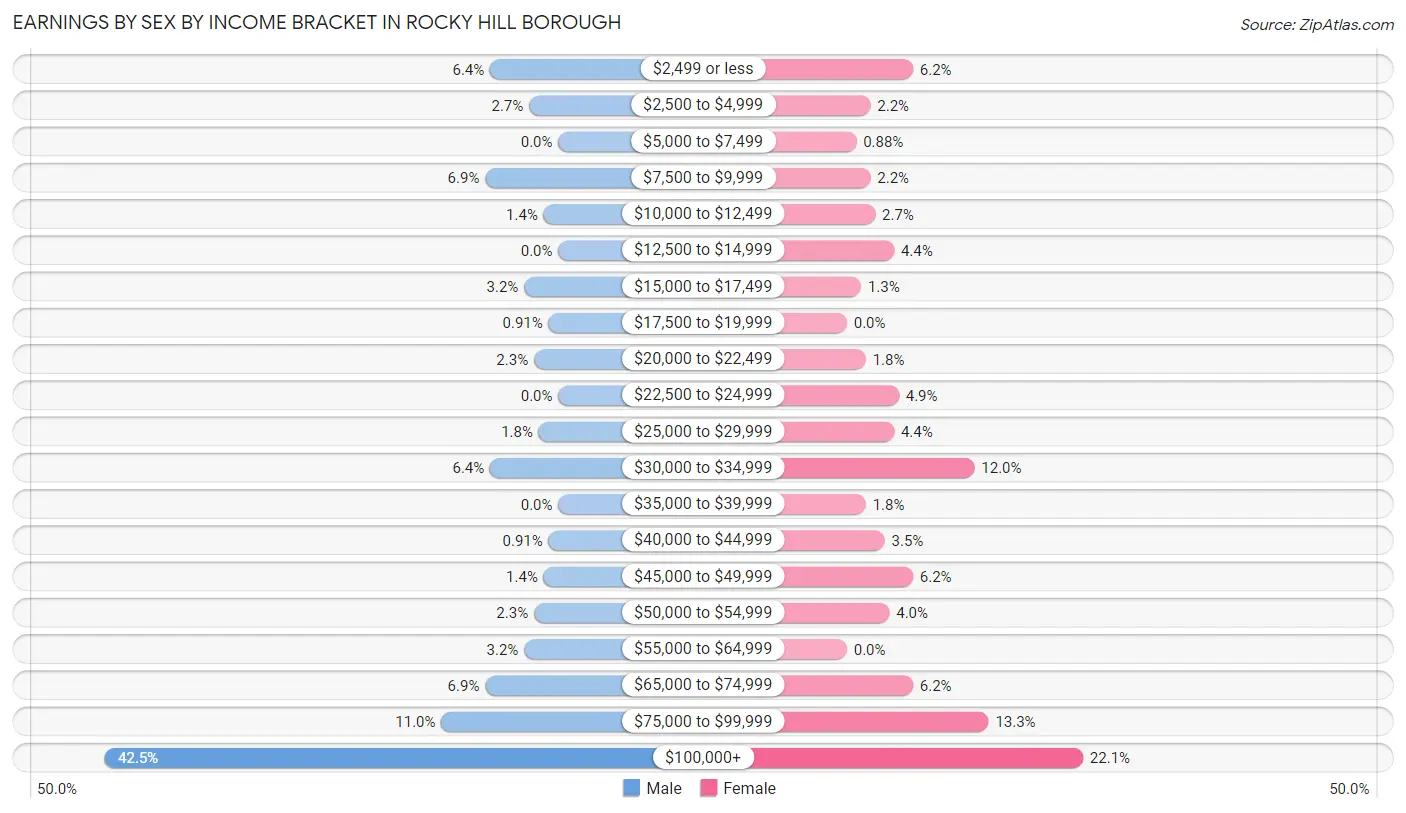
| Income | Male | Female |
| $2,499 or less | 14 (6.4%) | 14 (6.2%) |
| $2,500 to $4,999 | 6 (2.7%) | 5 (2.2%) |
| $5,000 to $7,499 | 0 (0.0%) | 2 (0.9%) |
| $7,500 to $9,999 | 15 (6.9%) | 5 (2.2%) |
| $10,000 to $12,499 | 3 (1.4%) | 6 (2.6%) |
| $12,500 to $14,999 | 0 (0.0%) | 10 (4.4%) |
| $15,000 to $17,499 | 7 (3.2%) | 3 (1.3%) |
| $17,500 to $19,999 | 2 (0.9%) | 0 (0.0%) |
| $20,000 to $22,499 | 5 (2.3%) | 4 (1.8%) |
| $22,500 to $24,999 | 0 (0.0%) | 11 (4.9%) |
| $25,000 to $29,999 | 4 (1.8%) | 10 (4.4%) |
| $30,000 to $34,999 | 14 (6.4%) | 27 (11.9%) |
| $35,000 to $39,999 | 0 (0.0%) | 4 (1.8%) |
| $40,000 to $44,999 | 2 (0.9%) | 8 (3.5%) |
| $45,000 to $49,999 | 3 (1.4%) | 14 (6.2%) |
| $50,000 to $54,999 | 5 (2.3%) | 9 (4.0%) |
| $55,000 to $64,999 | 7 (3.2%) | 0 (0.0%) |
| $65,000 to $74,999 | 15 (6.9%) | 14 (6.2%) |
| $75,000 to $99,999 | 24 (11.0%) | 30 (13.3%) |
| $100,000+ | 93 (42.5%) | 50 (22.1%) |
| Total | 219 (100.0%) | 226 (100.0%) |
Earnings by Sex by Educational Attainment in Rocky Hill borough
Average earnings in Rocky Hill borough are $101,750 for men and $61,250 for women, a difference of 39.8%. Men with an educational attainment of graduate degree enjoy the highest average annual earnings of $128,333, while those with college or associate's degree education earn the least with $33,750. Women with an educational attainment of graduate degree earn the most with the average annual earnings of $100,625, while those with high school diploma education have the smallest earnings of $31,029.
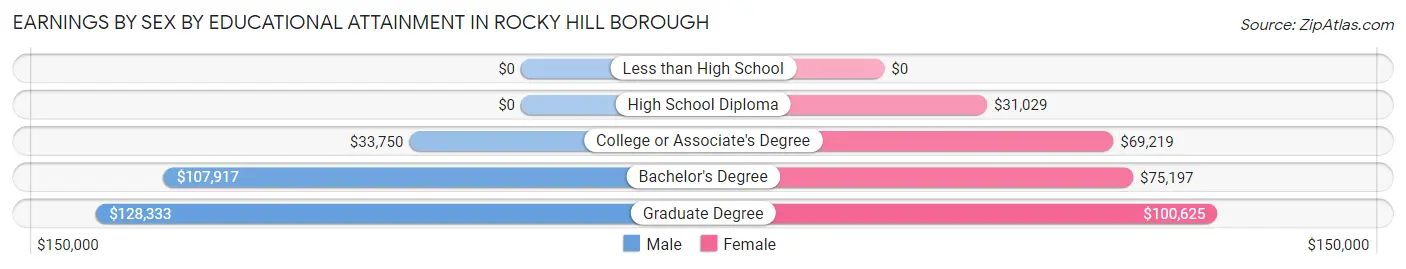
| Educational Attainment | Male Income | Female Income |
| Less than High School | - | - |
| High School Diploma | - | - |
| College or Associate's Degree | $33,750 | $69,219 |
| Bachelor's Degree | $107,917 | $75,197 |
| Graduate Degree | $128,333 | $100,625 |
| Total | $101,750 | $61,250 |
Family Income in Rocky Hill borough
Family Income Brackets in Rocky Hill borough
According to the Rocky Hill borough family income data, there are 81 families falling into the $200,000+ income range, which is the most common income bracket and makes up 42.6% of all families.
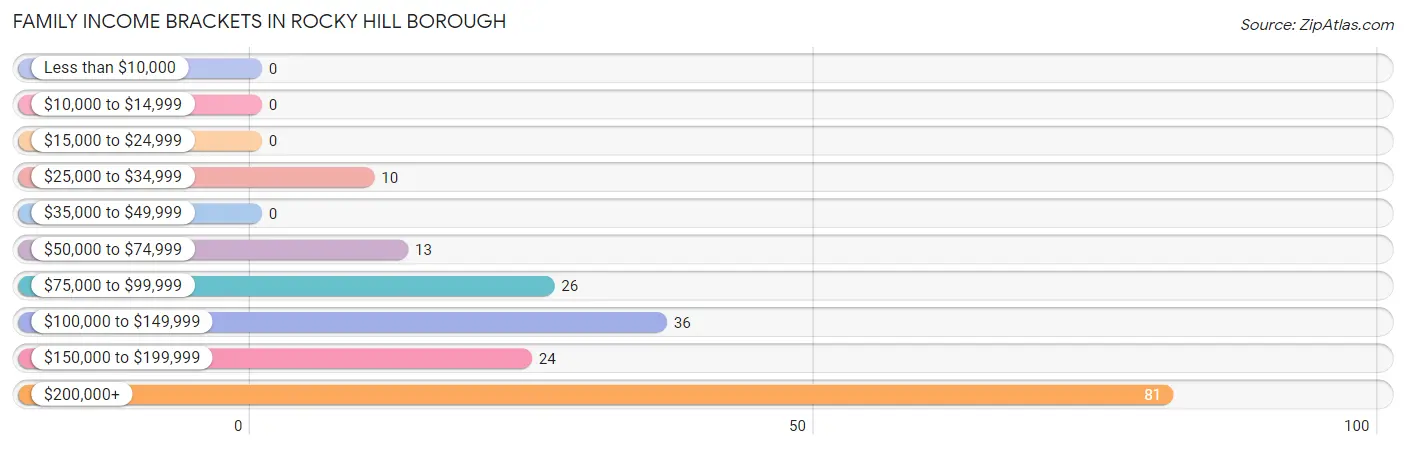
| Income Bracket | # Families | % Families |
| Less than $10,000 | 0 | 0.0% |
| $10,000 to $14,999 | 0 | 0.0% |
| $15,000 to $24,999 | 0 | 0.0% |
| $25,000 to $34,999 | 10 | 5.3% |
| $35,000 to $49,999 | 0 | 0.0% |
| $50,000 to $74,999 | 13 | 6.8% |
| $75,000 to $99,999 | 26 | 13.7% |
| $100,000 to $149,999 | 36 | 18.9% |
| $150,000 to $199,999 | 24 | 12.6% |
| $200,000+ | 81 | 42.6% |
Family Income by Famaliy Size in Rocky Hill borough
5-person families (9 | 4.7%) account for the highest median family income in Rocky Hill borough with $250,001 per family, while 2-person families (84 | 44.2%) have the highest median income of $60,834 per family member.
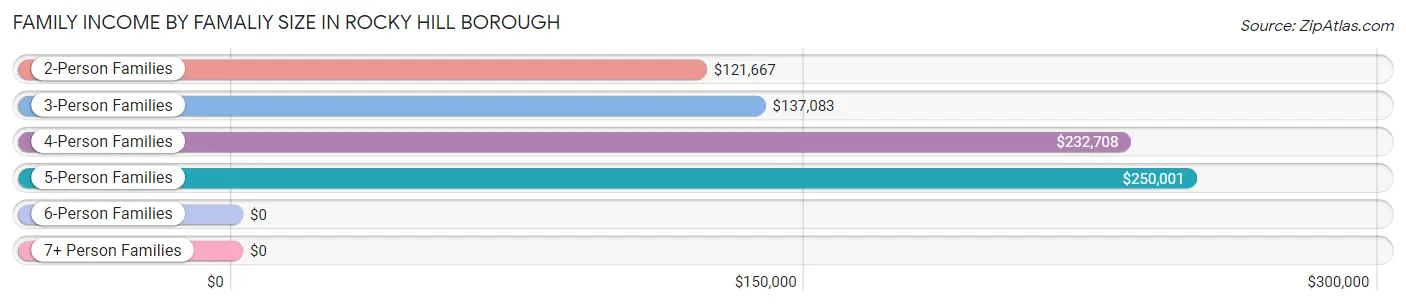
| Income Bracket | # Families | Median Income |
| 2-Person Families | 84 (44.2%) | $121,667 |
| 3-Person Families | 45 (23.7%) | $137,083 |
| 4-Person Families | 43 (22.6%) | $232,708 |
| 5-Person Families | 9 (4.7%) | $250,001 |
| 6-Person Families | 3 (1.6%) | $0 |
| 7+ Person Families | 6 (3.2%) | $0 |
| Total | 190 (100.0%) | $162,000 |
Family Income by Number of Earners in Rocky Hill borough
The median family income in Rocky Hill borough is $162,000, with families comprising 3+ earners (28) having the highest median family income of $222,083, while families with no earners (19) have the lowest median family income of $94,107, accounting for 14.7% and 10.0% of families, respectively.
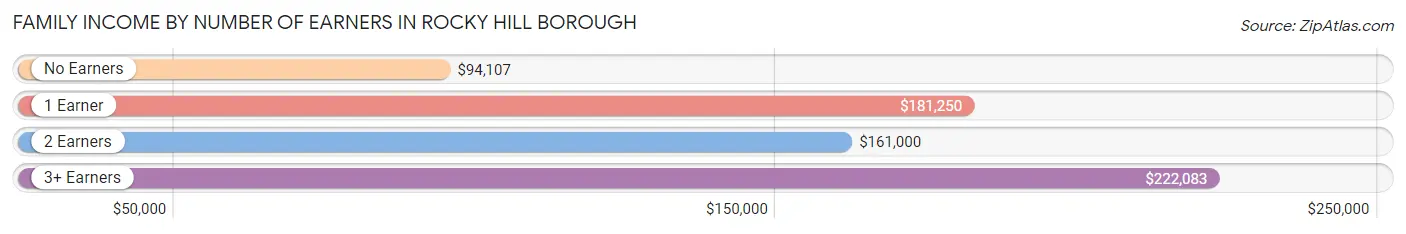
| Number of Earners | # Families | Median Income |
| No Earners | 19 (10.0%) | $94,107 |
| 1 Earner | 49 (25.8%) | $181,250 |
| 2 Earners | 94 (49.5%) | $161,000 |
| 3+ Earners | 28 (14.7%) | $222,083 |
| Total | 190 (100.0%) | $162,000 |
Household Income in Rocky Hill borough
Household Income Brackets in Rocky Hill borough
With 93 households falling in the category, the $200,000+ income range is the most frequent in Rocky Hill borough, accounting for 31.5% of all households.
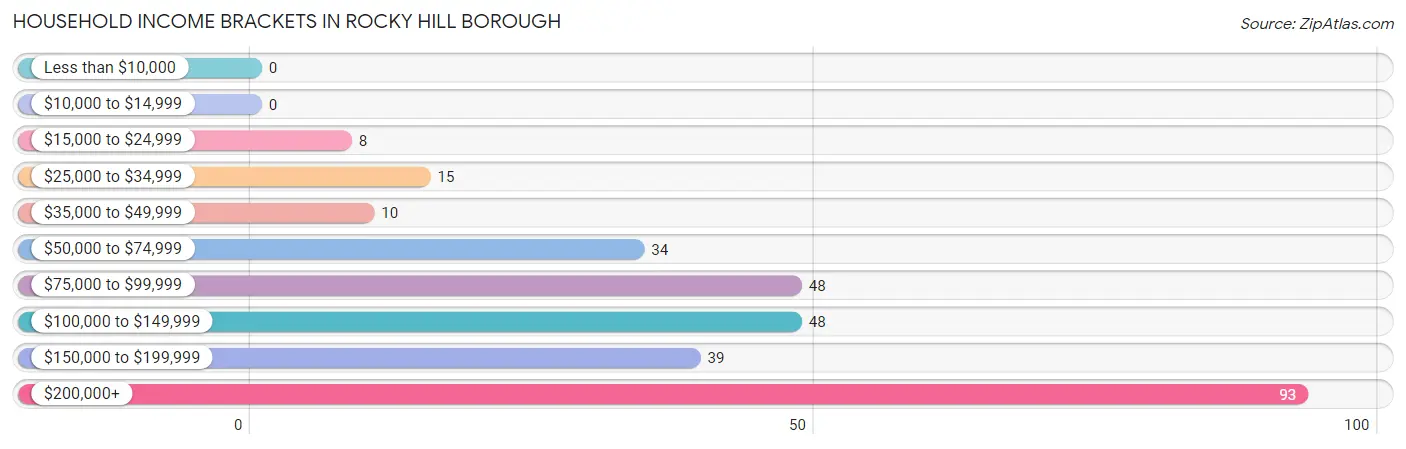
| Income Bracket | # Households | % Households |
| Less than $10,000 | 0 | 0.0% |
| $10,000 to $14,999 | 0 | 0.0% |
| $15,000 to $24,999 | 8 | 2.7% |
| $25,000 to $34,999 | 15 | 5.1% |
| $35,000 to $49,999 | 10 | 3.4% |
| $50,000 to $74,999 | 34 | 11.5% |
| $75,000 to $99,999 | 48 | 16.3% |
| $100,000 to $149,999 | 48 | 16.3% |
| $150,000 to $199,999 | 39 | 13.2% |
| $200,000+ | 93 | 31.5% |
Household Income by Householder Age in Rocky Hill borough
The median household income in Rocky Hill borough is $126,250, with the highest median household income of $197,750 found in the 45 to 64 years age bracket for the primary householder. A total of 124 households (42.0%) fall into this category. Meanwhile, the 15 to 24 years age bracket for the primary householder has the lowest median household income of $0, with 13 households (4.4%) in this group.
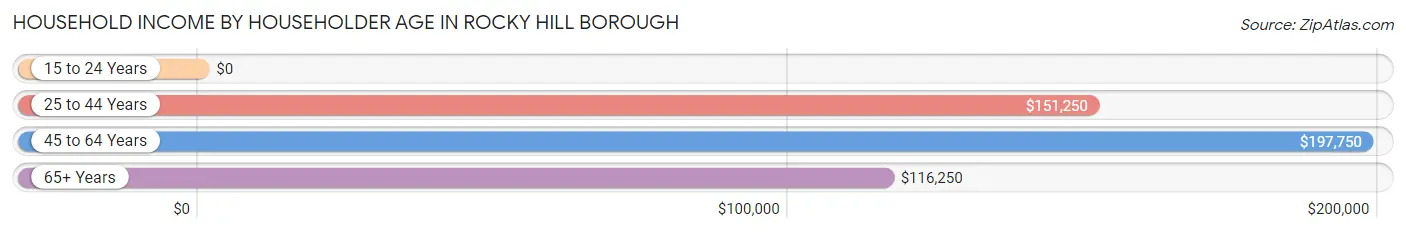
| Income Bracket | # Households | Median Income |
| 15 to 24 Years | 13 (4.4%) | $0 |
| 25 to 44 Years | 51 (17.3%) | $151,250 |
| 45 to 64 Years | 124 (42.0%) | $197,750 |
| 65+ Years | 107 (36.3%) | $116,250 |
| Total | 295 (100.0%) | $126,250 |
Poverty in Rocky Hill borough
Income Below Poverty by Sex and Age in Rocky Hill borough
With 5.3% poverty level for males and 1.7% for females among the residents of Rocky Hill borough, 35 to 44 year old males and 18 to 24 year old females are the most vulnerable to poverty, with 7 males (14.0%) and 3 females (7.1%) in their respective age groups living below the poverty level.
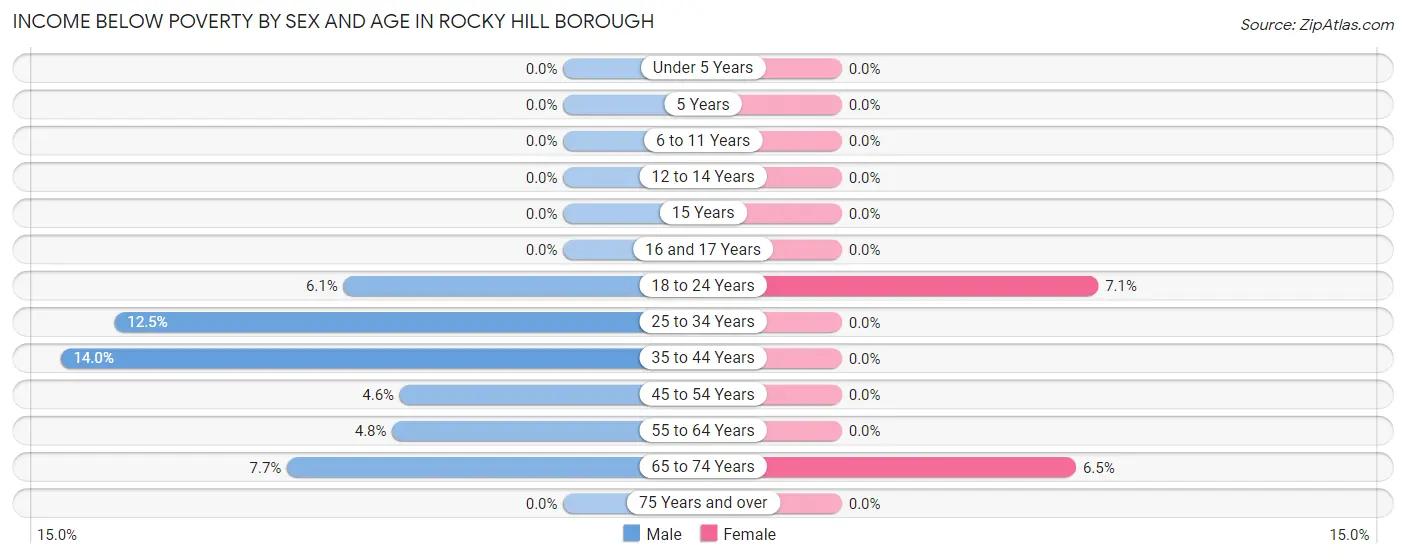
| Age Bracket | Male | Female |
| Under 5 Years | 0 (0.0%) | 0 (0.0%) |
| 5 Years | 0 (0.0%) | 0 (0.0%) |
| 6 to 11 Years | 0 (0.0%) | 0 (0.0%) |
| 12 to 14 Years | 0 (0.0%) | 0 (0.0%) |
| 15 Years | 0 (0.0%) | 0 (0.0%) |
| 16 and 17 Years | 0 (0.0%) | 0 (0.0%) |
| 18 to 24 Years | 3 (6.1%) | 3 (7.1%) |
| 25 to 34 Years | 3 (12.5%) | 0 (0.0%) |
| 35 to 44 Years | 7 (14.0%) | 0 (0.0%) |
| 45 to 54 Years | 2 (4.5%) | 0 (0.0%) |
| 55 to 64 Years | 3 (4.8%) | 0 (0.0%) |
| 65 to 74 Years | 5 (7.7%) | 3 (6.5%) |
| 75 Years and over | 0 (0.0%) | 0 (0.0%) |
| Total | 23 (5.3%) | 6 (1.7%) |
Income Above Poverty by Sex and Age in Rocky Hill borough
According to the poverty statistics in Rocky Hill borough, males aged under 5 years and females aged under 5 years are the age groups that are most secure financially, with 100.0% of males and 100.0% of females in these age groups living above the poverty line.
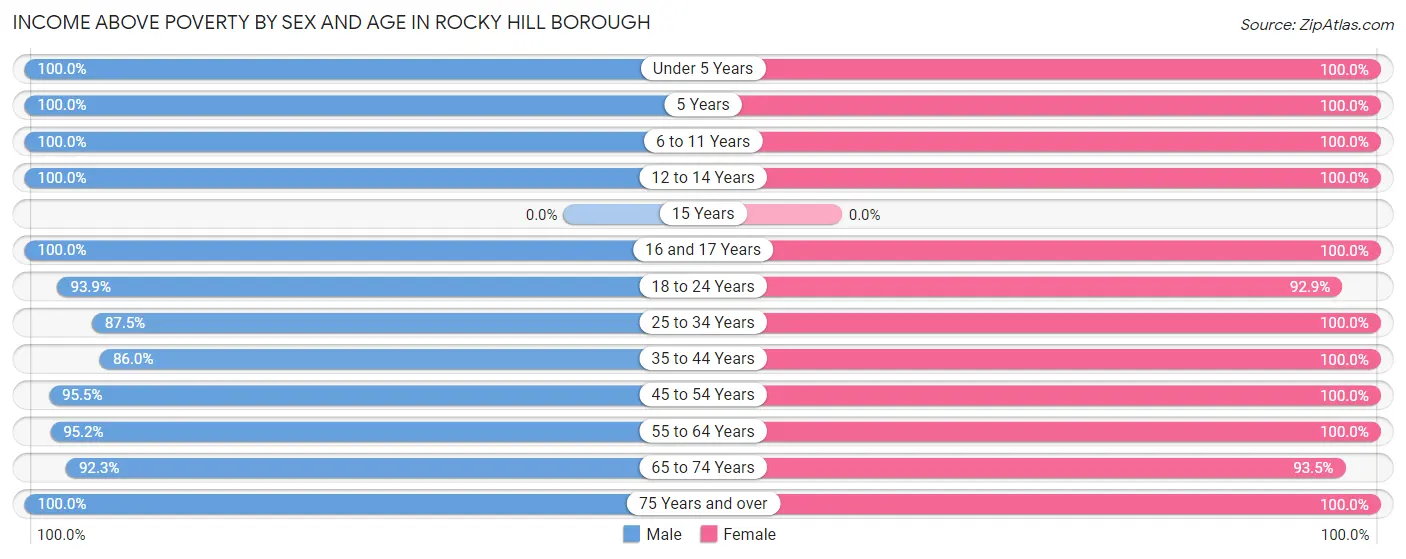
| Age Bracket | Male | Female |
| Under 5 Years | 34 (100.0%) | 24 (100.0%) |
| 5 Years | 3 (100.0%) | 4 (100.0%) |
| 6 to 11 Years | 34 (100.0%) | 14 (100.0%) |
| 12 to 14 Years | 22 (100.0%) | 6 (100.0%) |
| 15 Years | 0 (0.0%) | 0 (0.0%) |
| 16 and 17 Years | 14 (100.0%) | 8 (100.0%) |
| 18 to 24 Years | 46 (93.9%) | 39 (92.9%) |
| 25 to 34 Years | 21 (87.5%) | 36 (100.0%) |
| 35 to 44 Years | 43 (86.0%) | 48 (100.0%) |
| 45 to 54 Years | 42 (95.5%) | 30 (100.0%) |
| 55 to 64 Years | 60 (95.2%) | 85 (100.0%) |
| 65 to 74 Years | 60 (92.3%) | 43 (93.5%) |
| 75 Years and over | 29 (100.0%) | 20 (100.0%) |
| Total | 408 (94.7%) | 357 (98.4%) |
Income Below Poverty Among Married-Couple Families in Rocky Hill borough
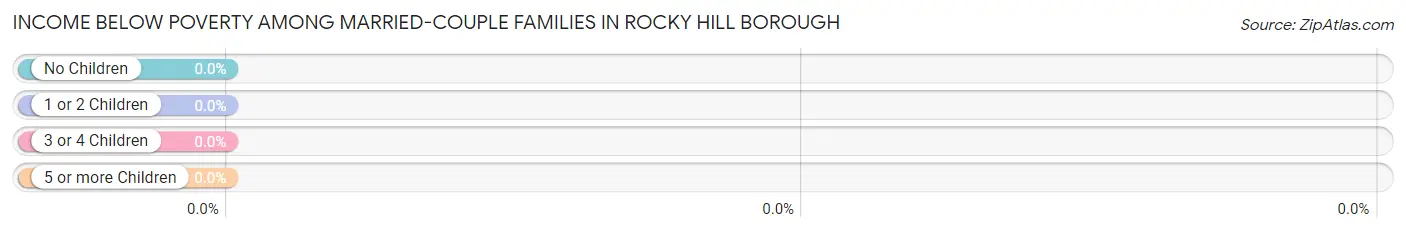
| Children | Above Poverty | Below Poverty |
| No Children | 85 (100.0%) | 0 (0.0%) |
| 1 or 2 Children | 52 (100.0%) | 0 (0.0%) |
| 3 or 4 Children | 12 (100.0%) | 0 (0.0%) |
| 5 or more Children | 3 (100.0%) | 0 (0.0%) |
| Total | 152 (100.0%) | 0 (0.0%) |
Income Below Poverty Among Single-Parent Households in Rocky Hill borough
| Children | Single Father | Single Mother |
| No Children | 0 (0.0%) | 0 (0.0%) |
| 1 or 2 Children | 0 (0.0%) | 0 (0.0%) |
| 3 or 4 Children | 0 (0.0%) | 0 (0.0%) |
| 5 or more Children | 0 (0.0%) | 0 (0.0%) |
| Total | 0 (0.0%) | 0 (0.0%) |
Income Below Poverty Among Married-Couple vs Single-Parent Households in Rocky Hill borough
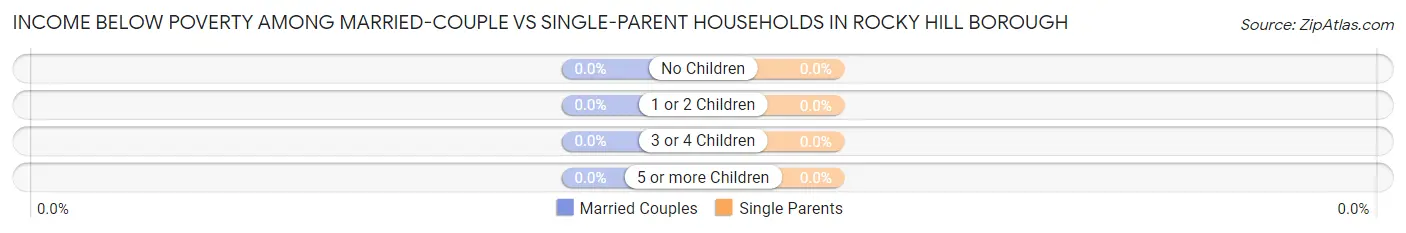
| Children | Married-Couple Families | Single-Parent Households |
| No Children | 0 (0.0%) | 0 (0.0%) |
| 1 or 2 Children | 0 (0.0%) | 0 (0.0%) |
| 3 or 4 Children | 0 (0.0%) | 0 (0.0%) |
| 5 or more Children | 0 (0.0%) | 0 (0.0%) |
| Total | 0 (0.0%) | 0 (0.0%) |
Race in Rocky Hill borough
The most populous races in Rocky Hill borough are White / Caucasian (706 | 88.9%), Hispanic or Latino (55 | 6.9%), and Two or more Races (43 | 5.4%).
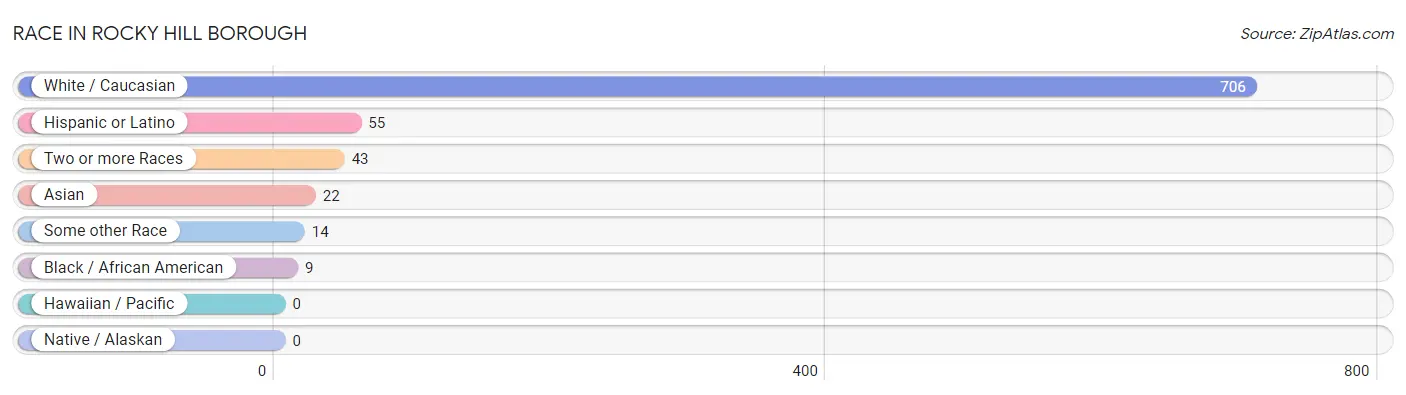
| Race | # Population | % Population |
| Asian | 22 | 2.8% |
| Black / African American | 9 | 1.1% |
| Hawaiian / Pacific | 0 | 0.0% |
| Hispanic or Latino | 55 | 6.9% |
| Native / Alaskan | 0 | 0.0% |
| White / Caucasian | 706 | 88.9% |
| Two or more Races | 43 | 5.4% |
| Some other Race | 14 | 1.8% |
| Total | 794 | 100.0% |
Ancestry in Rocky Hill borough
The most populous ancestries reported in Rocky Hill borough are German (110 | 13.9%), Italian (99 | 12.5%), Irish (97 | 12.2%), French (72 | 9.1%), and English (60 | 7.6%), together accounting for 55.2% of all Rocky Hill borough residents.
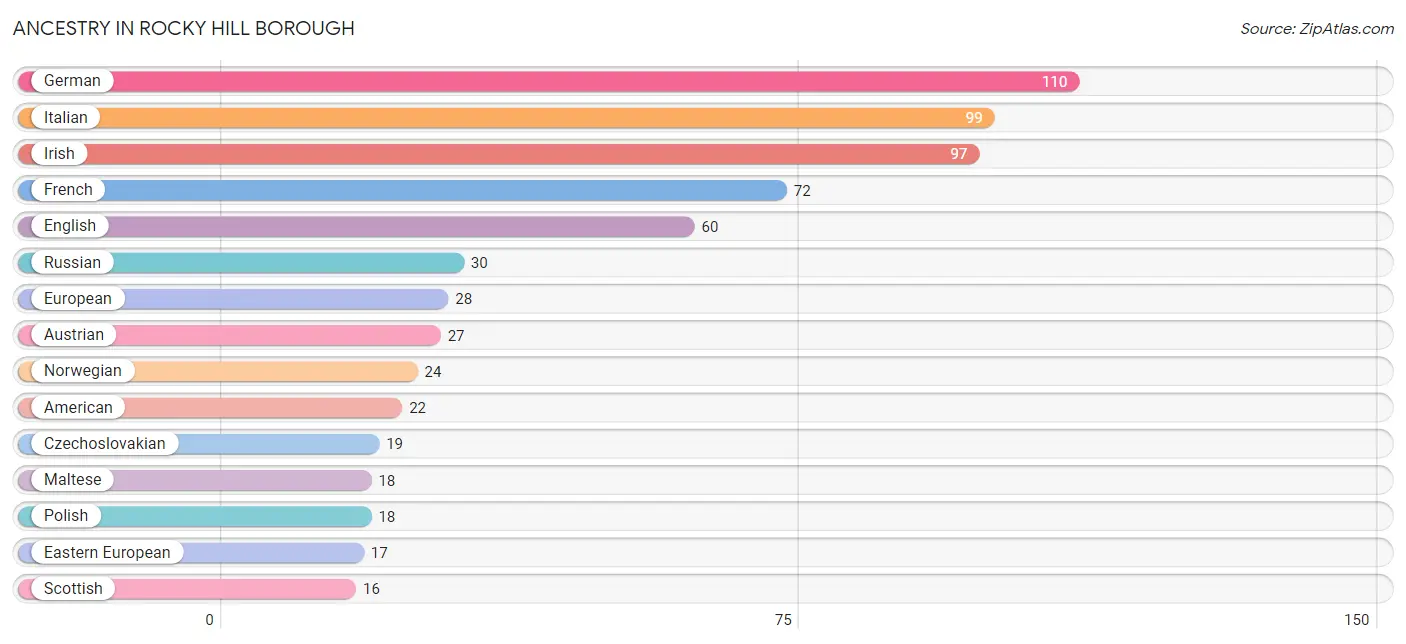
| Ancestry | # Population | % Population |
| American | 22 | 2.8% |
| Arab | 6 | 0.8% |
| Austrian | 27 | 3.4% |
| Belgian | 2 | 0.3% |
| Brazilian | 3 | 0.4% |
| British | 9 | 1.1% |
| Burmese | 2 | 0.3% |
| Canadian | 8 | 1.0% |
| Central American | 10 | 1.3% |
| Cherokee | 1 | 0.1% |
| Croatian | 3 | 0.4% |
| Cuban | 14 | 1.8% |
| Czech | 9 | 1.1% |
| Czechoslovakian | 19 | 2.4% |
| Dominican | 8 | 1.0% |
| Dutch | 15 | 1.9% |
| Eastern European | 17 | 2.1% |
| English | 60 | 7.6% |
| European | 28 | 3.5% |
| Filipino | 2 | 0.3% |
| Finnish | 2 | 0.3% |
| French | 72 | 9.1% |
| French Canadian | 7 | 0.9% |
| German | 110 | 13.9% |
| Indian (Asian) | 12 | 1.5% |
| Iraqi | 3 | 0.4% |
| Irish | 97 | 12.2% |
| Italian | 99 | 12.5% |
| Maltese | 18 | 2.3% |
| Mexican | 6 | 0.8% |
| Nicaraguan | 10 | 1.3% |
| Norwegian | 24 | 3.0% |
| Peruvian | 9 | 1.1% |
| Polish | 18 | 2.3% |
| Portuguese | 6 | 0.8% |
| Puerto Rican | 4 | 0.5% |
| Romanian | 2 | 0.3% |
| Russian | 30 | 3.8% |
| Scotch-Irish | 4 | 0.5% |
| Scottish | 16 | 2.0% |
| Slavic | 4 | 0.5% |
| Slovak | 5 | 0.6% |
| South American | 9 | 1.1% |
| Swedish | 3 | 0.4% |
| Swiss | 5 | 0.6% |
| Thai | 16 | 2.0% |
| Ukrainian | 3 | 0.4% |
| Welsh | 6 | 0.8% | View All 48 Rows |
Immigrants in Rocky Hill borough
The most numerous immigrant groups reported in Rocky Hill borough came from Europe (82 | 10.3%), Western Europe (77 | 9.7%), France (66 | 8.3%), Asia (20 | 2.5%), and China (10 | 1.3%), together accounting for 32.1% of all Rocky Hill borough residents.
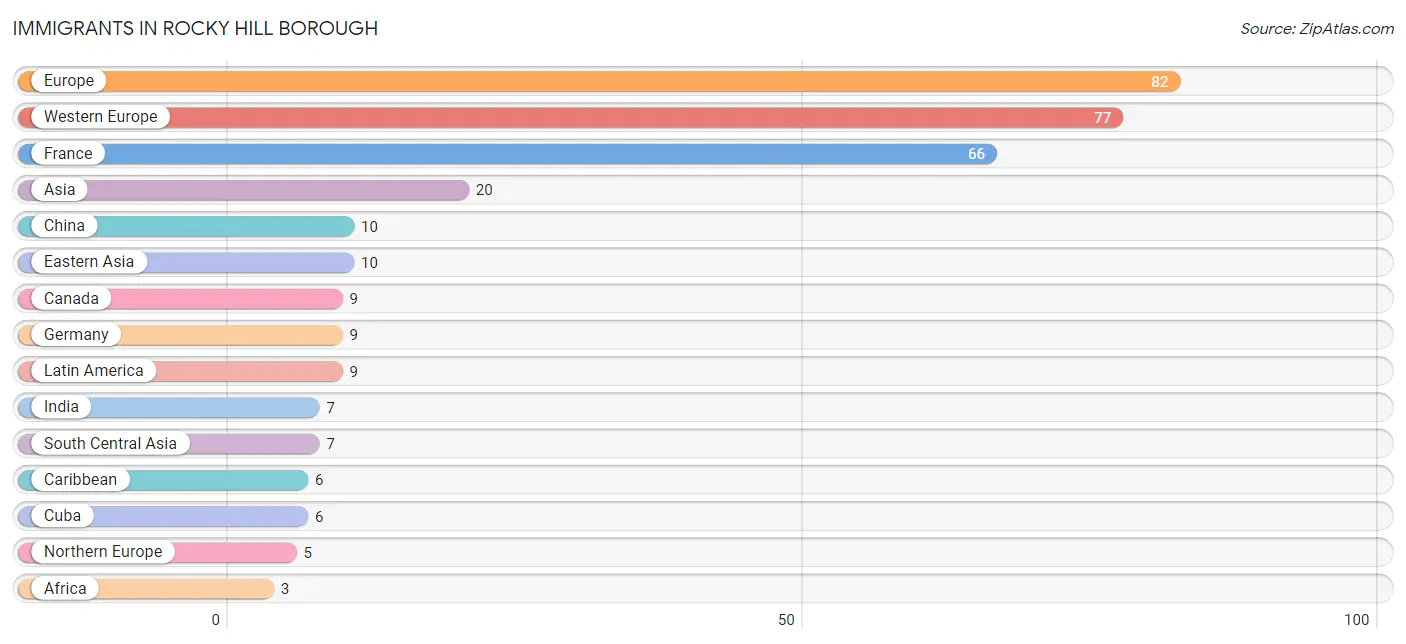
| Immigration Origin | # Population | % Population |
| Africa | 3 | 0.4% |
| Asia | 20 | 2.5% |
| Belgium | 2 | 0.3% |
| Brazil | 3 | 0.4% |
| Canada | 9 | 1.1% |
| Caribbean | 6 | 0.8% |
| China | 10 | 1.3% |
| Cuba | 6 | 0.8% |
| Eastern Africa | 3 | 0.4% |
| Eastern Asia | 10 | 1.3% |
| England | 2 | 0.3% |
| Europe | 82 | 10.3% |
| France | 66 | 8.3% |
| Germany | 9 | 1.1% |
| India | 7 | 0.9% |
| Israel | 3 | 0.4% |
| Latin America | 9 | 1.1% |
| Northern Europe | 5 | 0.6% |
| South America | 3 | 0.4% |
| South Central Asia | 7 | 0.9% |
| Western Asia | 3 | 0.4% |
| Western Europe | 77 | 9.7% |
| Zimbabwe | 3 | 0.4% | View All 23 Rows |
Sex and Age in Rocky Hill borough
Sex and Age in Rocky Hill borough
The most populous age groups in Rocky Hill borough are 20 to 24 Years (39 | 9.0%) for men and 60 to 64 Years (43 | 11.8%) for women.
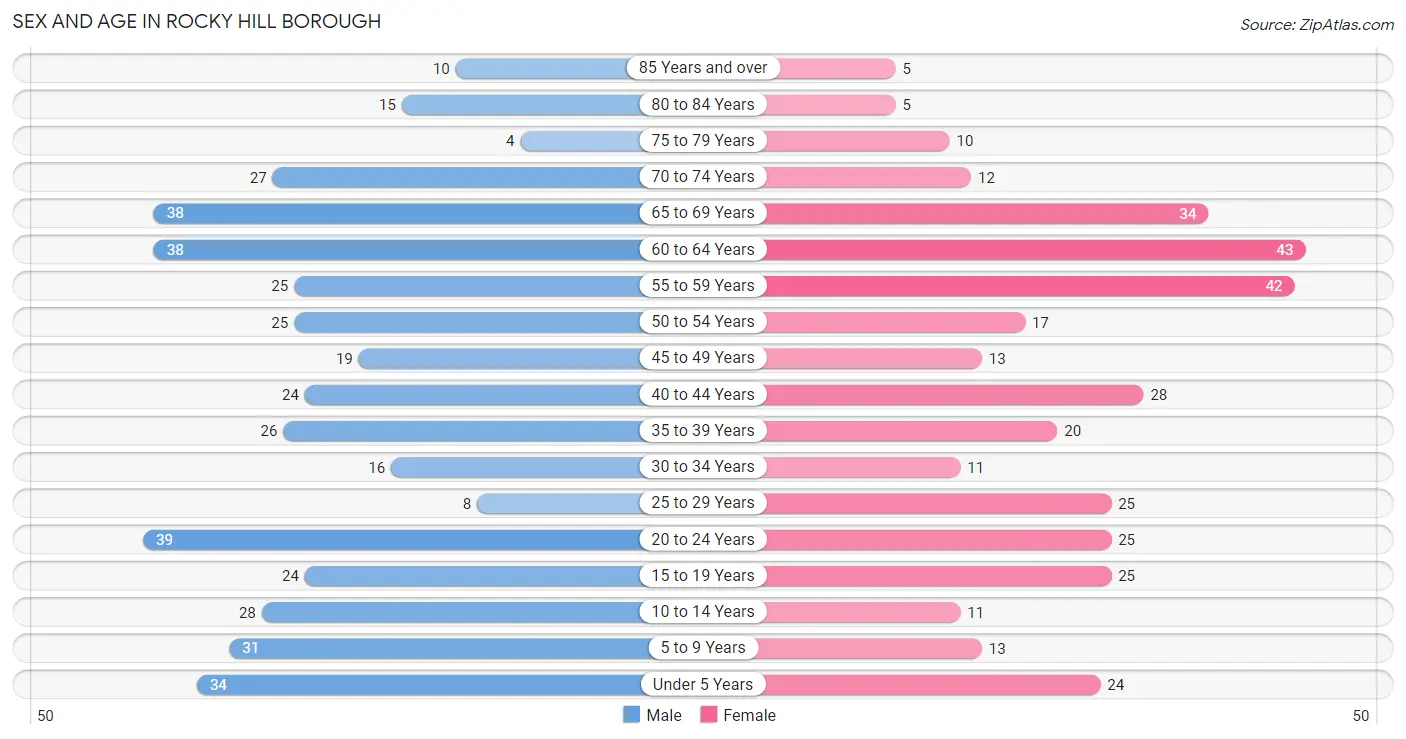
| Age Bracket | Male | Female |
| Under 5 Years | 34 (7.9%) | 24 (6.6%) |
| 5 to 9 Years | 31 (7.2%) | 13 (3.6%) |
| 10 to 14 Years | 28 (6.5%) | 11 (3.0%) |
| 15 to 19 Years | 24 (5.6%) | 25 (6.9%) |
| 20 to 24 Years | 39 (9.0%) | 25 (6.9%) |
| 25 to 29 Years | 8 (1.9%) | 25 (6.9%) |
| 30 to 34 Years | 16 (3.7%) | 11 (3.0%) |
| 35 to 39 Years | 26 (6.0%) | 20 (5.5%) |
| 40 to 44 Years | 24 (5.6%) | 28 (7.7%) |
| 45 to 49 Years | 19 (4.4%) | 13 (3.6%) |
| 50 to 54 Years | 25 (5.8%) | 17 (4.7%) |
| 55 to 59 Years | 25 (5.8%) | 42 (11.6%) |
| 60 to 64 Years | 38 (8.8%) | 43 (11.8%) |
| 65 to 69 Years | 38 (8.8%) | 34 (9.4%) |
| 70 to 74 Years | 27 (6.3%) | 12 (3.3%) |
| 75 to 79 Years | 4 (0.9%) | 10 (2.8%) |
| 80 to 84 Years | 15 (3.5%) | 5 (1.4%) |
| 85 Years and over | 10 (2.3%) | 5 (1.4%) |
| Total | 431 (100.0%) | 363 (100.0%) |
Families and Households in Rocky Hill borough
Median Family Size in Rocky Hill borough
The median family size in Rocky Hill borough is 3.36 persons per family, with single male/father families (14 | 7.4%) accounting for the largest median family size of 3.64 persons per family. On the other hand, single female/mother families (24 | 12.6%) represent the smallest median family size with 2.33 persons per family.
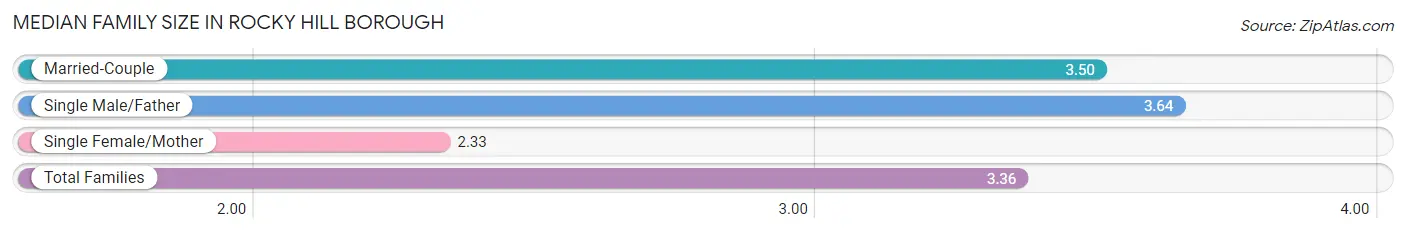
| Family Type | # Families | Family Size |
| Married-Couple | 152 (80.0%) | 3.50 |
| Single Male/Father | 14 (7.4%) | 3.64 |
| Single Female/Mother | 24 (12.6%) | 2.33 |
| Total Families | 190 (100.0%) | 3.36 |
Median Household Size in Rocky Hill borough
The median household size in Rocky Hill borough is 2.64 persons per household, with single male/father households (14 | 4.8%) accounting for the largest median household size of 3.64 persons per household. non-family households (105 | 35.6%) represent the smallest median household size with 1.22 persons per household.
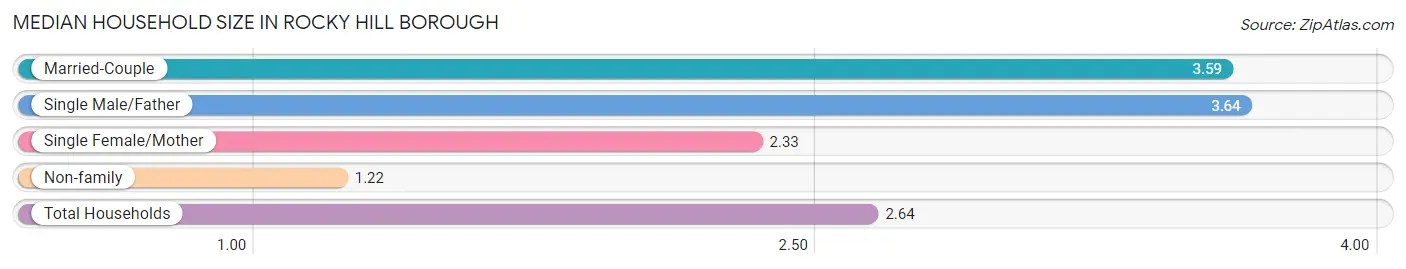
| Household Type | # Households | Household Size |
| Married-Couple | 152 (51.5%) | 3.59 |
| Single Male/Father | 14 (4.8%) | 3.64 |
| Single Female/Mother | 24 (8.1%) | 2.33 |
| Non-family | 105 (35.6%) | 1.22 |
| Total Households | 295 (100.0%) | 2.64 |
Household Size by Marriage Status in Rocky Hill borough
Out of a total of 295 households in Rocky Hill borough, 190 (64.4%) are family households, while 105 (35.6%) are nonfamily households. The most numerous type of family households are 2-person households, comprising 84, and the most common type of nonfamily households are 1-person households, comprising 83.
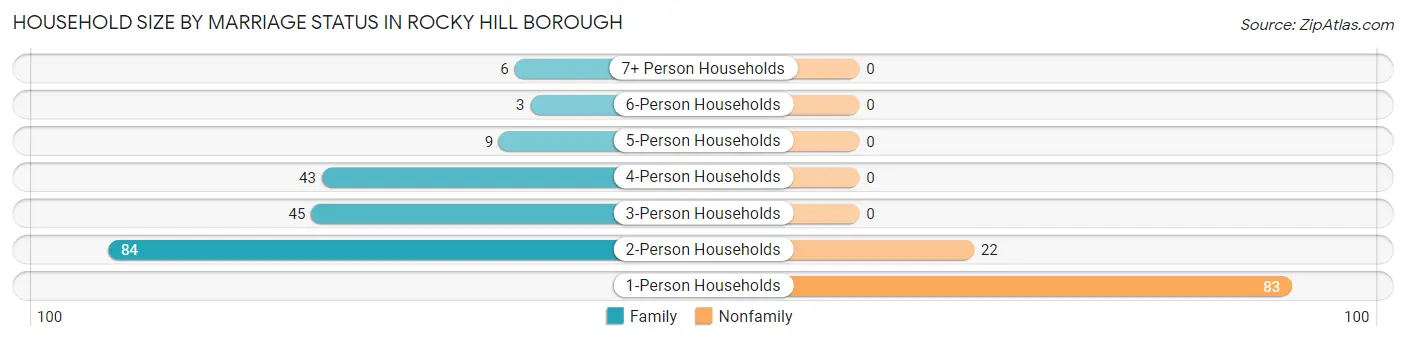
| Household Size | Family Households | Nonfamily Households |
| 1-Person Households | - | 83 (28.1%) |
| 2-Person Households | 84 (28.5%) | 22 (7.5%) |
| 3-Person Households | 45 (15.2%) | 0 (0.0%) |
| 4-Person Households | 43 (14.6%) | 0 (0.0%) |
| 5-Person Households | 9 (3.0%) | 0 (0.0%) |
| 6-Person Households | 3 (1.0%) | 0 (0.0%) |
| 7+ Person Households | 6 (2.0%) | 0 (0.0%) |
| Total | 190 (64.4%) | 105 (35.6%) |
Female Fertility in Rocky Hill borough
Fertility by Age in Rocky Hill borough
Average fertility rate in Rocky Hill borough is 40.0 births per 1,000 women. Women in the age bracket of 20 to 34 years have the highest fertility rate with 98.0 births per 1,000 women. Women in the age bracket of 20 to 34 years acount for 100.0% of all women with births.
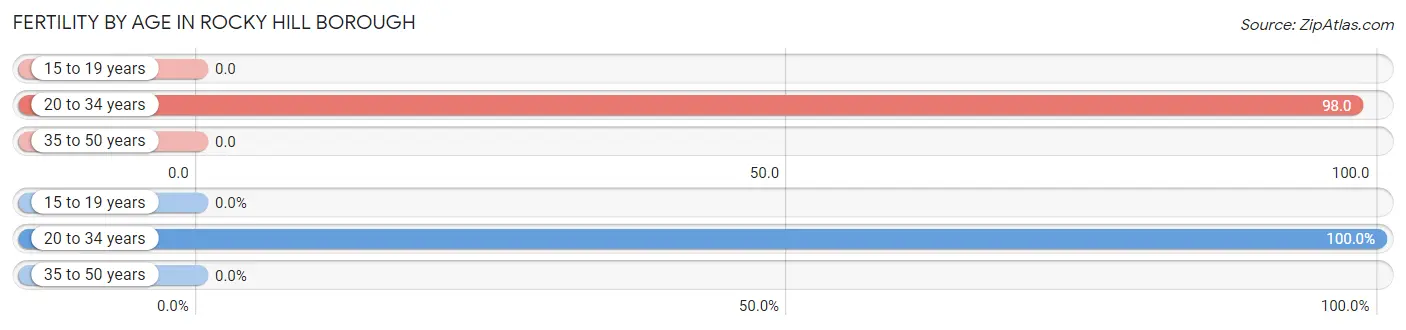
| Age Bracket | Women with Births | Births / 1,000 Women |
| 15 to 19 years | 0 (0.0%) | 0.0 |
| 20 to 34 years | 6 (100.0%) | 98.0 |
| 35 to 50 years | 0 (0.0%) | 0.0 |
| Total | 6 (100.0%) | 40.0 |
Fertility by Age by Marriage Status in Rocky Hill borough
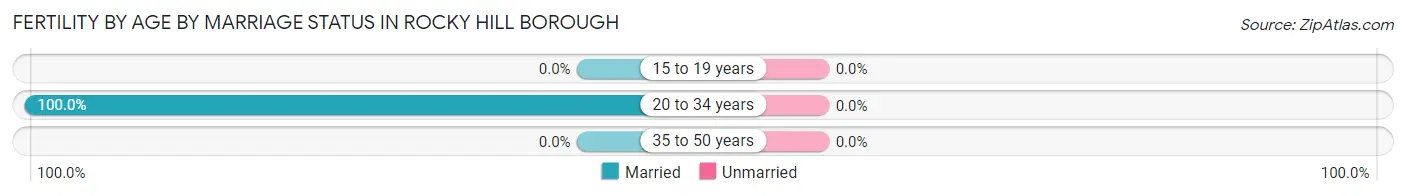
| Age Bracket | Married | Unmarried |
| 15 to 19 years | 0 (0.0%) | 0 (0.0%) |
| 20 to 34 years | 6 (100.0%) | 0 (0.0%) |
| 35 to 50 years | 0 (0.0%) | 0 (0.0%) |
| Total | 6 (100.0%) | 0 (0.0%) |
Fertility by Education in Rocky Hill borough
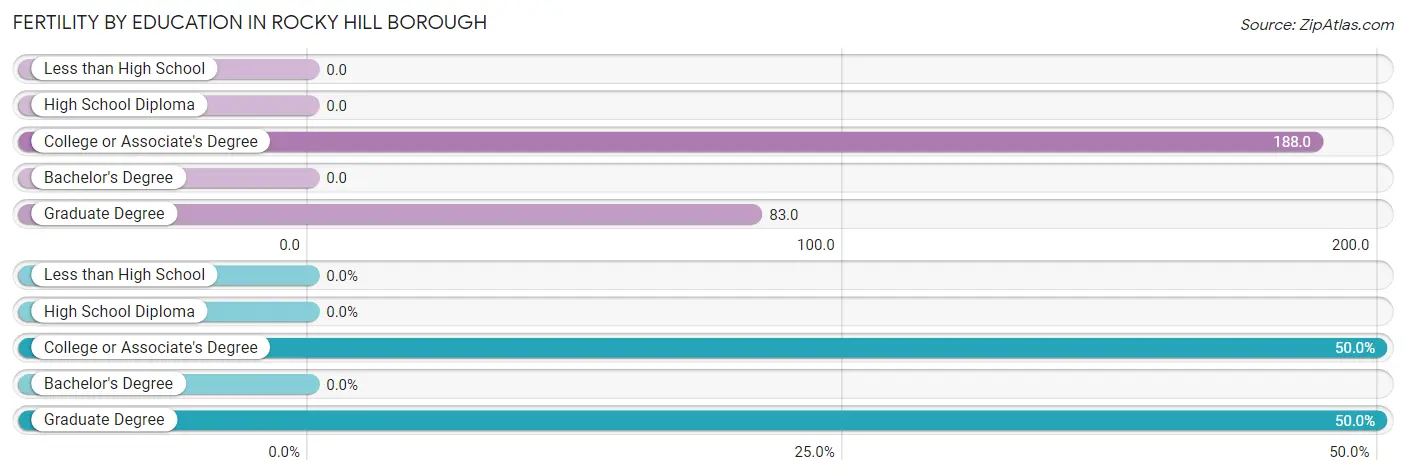
| Educational Attainment | Women with Births | Births / 1,000 Women |
| Less than High School | 0 (0.0%) | 0.0 |
| High School Diploma | 0 (0.0%) | 0.0 |
| College or Associate's Degree | 3 (50.0%) | 188.0 |
| Bachelor's Degree | 0 (0.0%) | 0.0 |
| Graduate Degree | 3 (50.0%) | 83.0 |
| Total | 6 (100.0%) | 40.0 |
Fertility by Education by Marriage Status in Rocky Hill borough
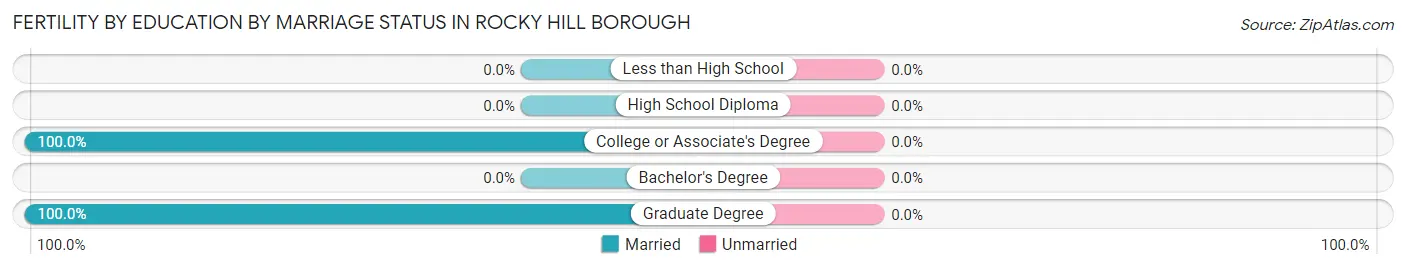
| Educational Attainment | Married | Unmarried |
| Less than High School | 0 (0.0%) | 0 (0.0%) |
| High School Diploma | 0 (0.0%) | 0 (0.0%) |
| College or Associate's Degree | 3 (100.0%) | 0 (0.0%) |
| Bachelor's Degree | 0 (0.0%) | 0 (0.0%) |
| Graduate Degree | 3 (100.0%) | 0 (0.0%) |
| Total | 6 (100.0%) | 0 (0.0%) |
Employment Characteristics in Rocky Hill borough
Employment by Class of Employer in Rocky Hill borough
Among the 398 employed individuals in Rocky Hill borough, private company employees (233 | 58.5%), not-for-profit organizations (84 | 21.1%), and self-employed (not incorporated) (36 | 9.0%) make up the most common classes of employment.
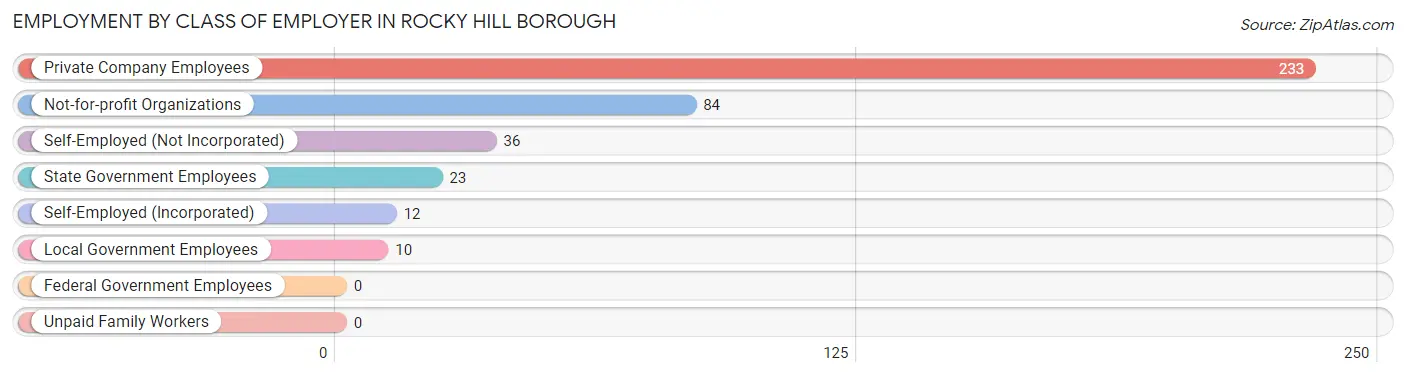
| Employer Class | # Employees | % Employees |
| Private Company Employees | 233 | 58.5% |
| Self-Employed (Incorporated) | 12 | 3.0% |
| Self-Employed (Not Incorporated) | 36 | 9.0% |
| Not-for-profit Organizations | 84 | 21.1% |
| Local Government Employees | 10 | 2.5% |
| State Government Employees | 23 | 5.8% |
| Federal Government Employees | 0 | 0.0% |
| Unpaid Family Workers | 0 | 0.0% |
| Total | 398 | 100.0% |
Employment Status by Age in Rocky Hill borough
According to the labor force statistics for Rocky Hill borough, out of the total population over 16 years of age (653), 64.3% or 420 individuals are in the labor force, with 4.8% or 20 of them unemployed. The age group with the highest labor force participation rate is 45 to 54 years, with 87.8% or 65 individuals in the labor force. Within the labor force, the 75 years and over age range has the highest percentage of unemployed individuals, with 50.0% or 2 of them being unemployed.
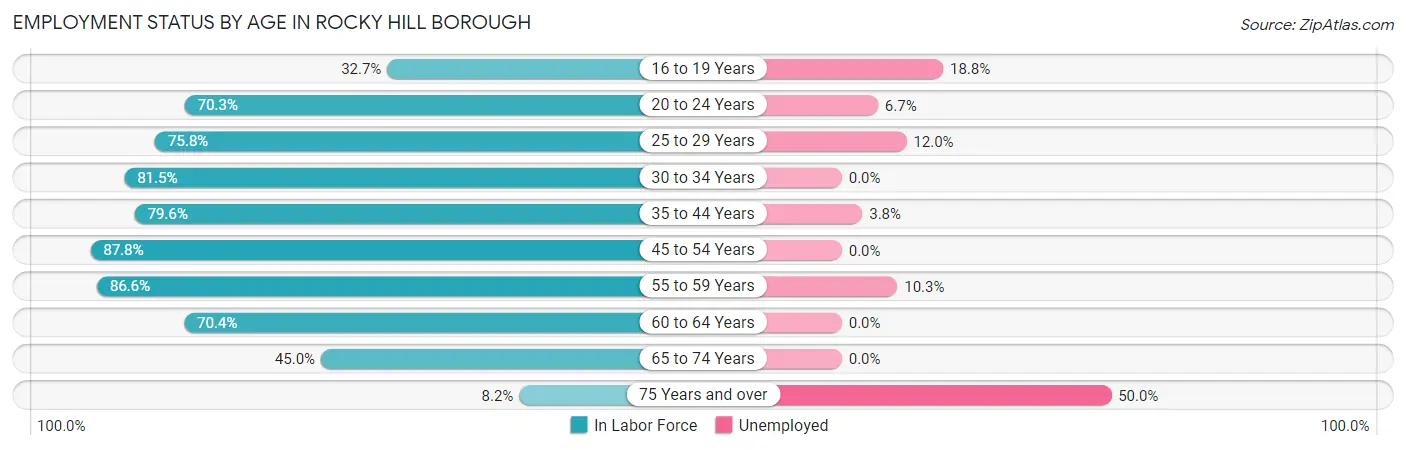
| Age Bracket | In Labor Force | Unemployed |
| 16 to 19 Years | 16 (32.7%) | 3 (18.8%) |
| 20 to 24 Years | 45 (70.3%) | 3 (6.7%) |
| 25 to 29 Years | 25 (75.8%) | 3 (12.0%) |
| 30 to 34 Years | 22 (81.5%) | 0 (0.0%) |
| 35 to 44 Years | 78 (79.6%) | 3 (3.8%) |
| 45 to 54 Years | 65 (87.8%) | 0 (0.0%) |
| 55 to 59 Years | 58 (86.6%) | 6 (10.3%) |
| 60 to 64 Years | 57 (70.4%) | 0 (0.0%) |
| 65 to 74 Years | 50 (45.0%) | 0 (0.0%) |
| 75 Years and over | 4 (8.2%) | 2 (50.0%) |
| Total | 420 (64.3%) | 20 (4.8%) |
Employment Status by Educational Attainment in Rocky Hill borough
According to labor force statistics for Rocky Hill borough, 80.3% of individuals (305) out of the total population between 25 and 64 years of age (380) are in the labor force, with 3.9% or 12 of them being unemployed. The group with the highest labor force participation rate are those with the educational attainment of college / associate degree, with 92.5% or 37 individuals in the labor force. Within the labor force, individuals with college / associate degree education have the highest percentage of unemployment, with 5.4% or 2 of them being unemployed.
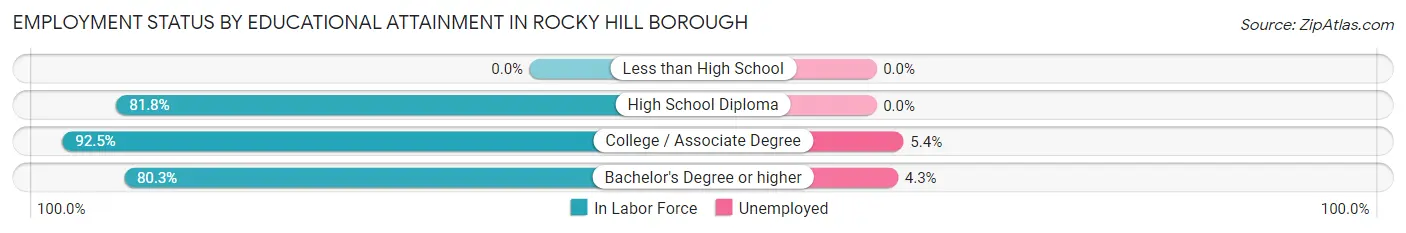
| Educational Attainment | In Labor Force | Unemployed |
| Less than High School | 0 (0.0%) | 0 (0.0%) |
| High School Diploma | 36 (81.8%) | 0 (0.0%) |
| College / Associate Degree | 37 (92.5%) | 2 (5.4%) |
| Bachelor's Degree or higher | 232 (80.3%) | 12 (4.3%) |
| Total | 305 (80.3%) | 15 (3.9%) |
Employment Occupations by Sex in Rocky Hill borough
Management, Business, Science and Arts Occupations
The most common Management, Business, Science and Arts occupations in Rocky Hill borough are Community & Social Service (108 | 27.0%), Education Instruction & Library (66 | 16.5%), Business & Financial (54 | 13.5%), Computers, Engineering & Science (46 | 11.5%), and Management (39 | 9.8%).
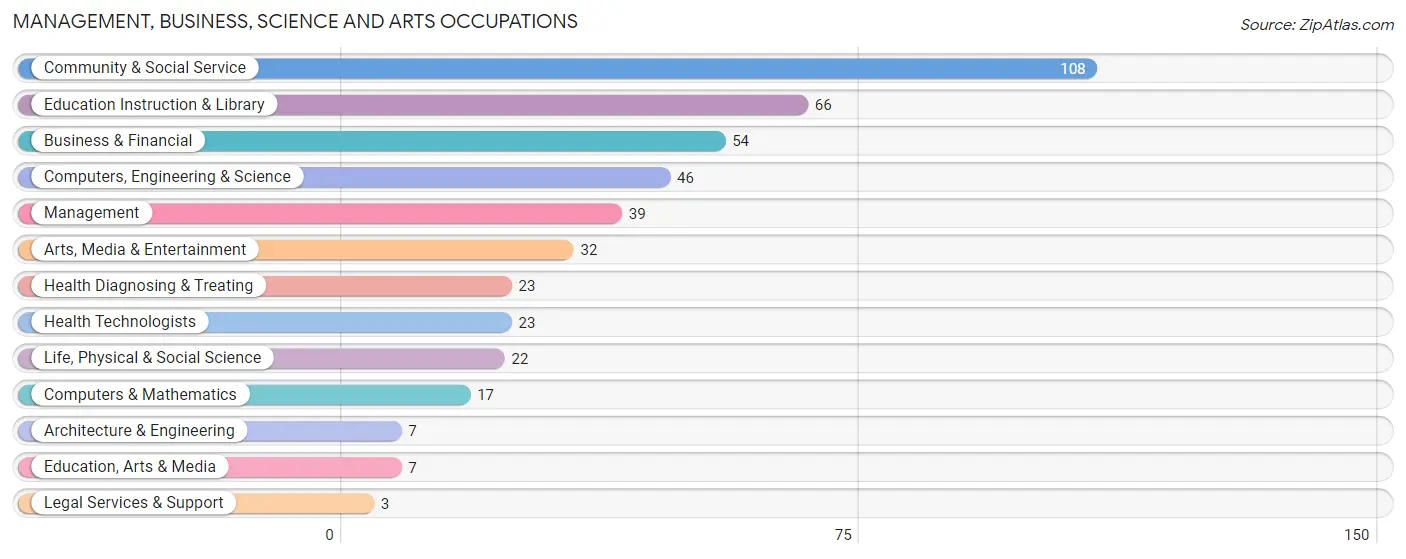
Management, Business, Science and Arts Occupations by Sex
Within the Management, Business, Science and Arts occupations in Rocky Hill borough, the most male-oriented occupations are Architecture & Engineering (100.0%), Computers & Mathematics (82.4%), and Computers, Engineering & Science (73.9%), while the most female-oriented occupations are Legal Services & Support (100.0%), Arts, Media & Entertainment (78.1%), and Community & Social Service (65.7%).
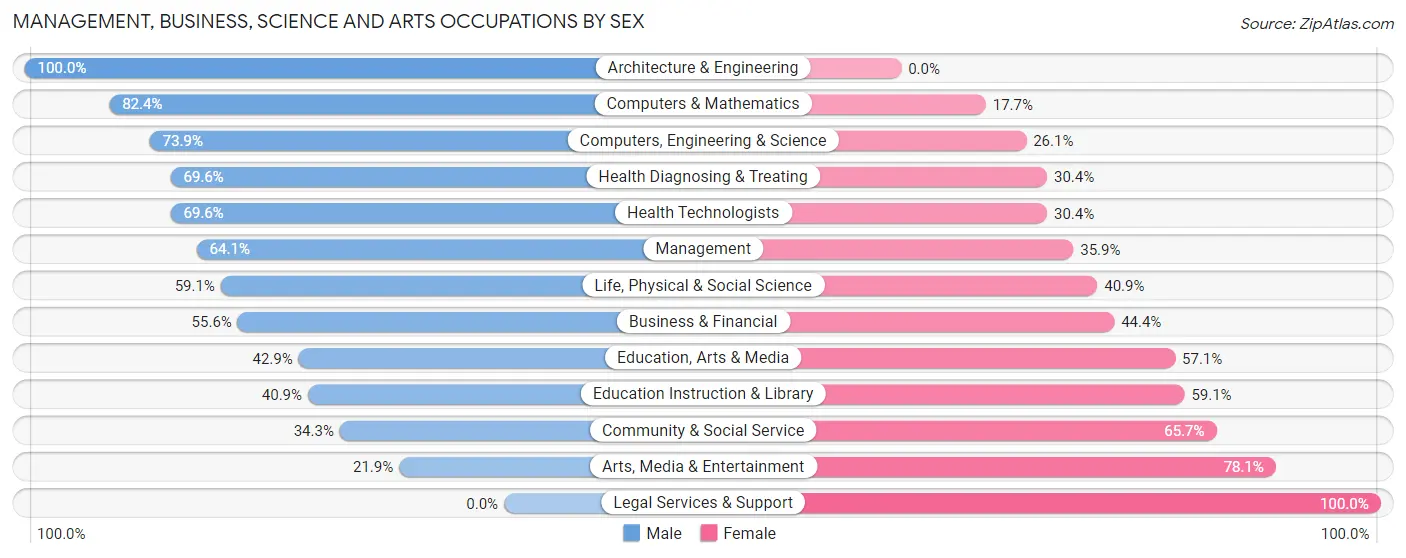
| Occupation | Male | Female |
| Management | 25 (64.1%) | 14 (35.9%) |
| Business & Financial | 30 (55.6%) | 24 (44.4%) |
| Computers, Engineering & Science | 34 (73.9%) | 12 (26.1%) |
| Computers & Mathematics | 14 (82.4%) | 3 (17.6%) |
| Architecture & Engineering | 7 (100.0%) | 0 (0.0%) |
| Life, Physical & Social Science | 13 (59.1%) | 9 (40.9%) |
| Community & Social Service | 37 (34.3%) | 71 (65.7%) |
| Education, Arts & Media | 3 (42.9%) | 4 (57.1%) |
| Legal Services & Support | 0 (0.0%) | 3 (100.0%) |
| Education Instruction & Library | 27 (40.9%) | 39 (59.1%) |
| Arts, Media & Entertainment | 7 (21.9%) | 25 (78.1%) |
| Health Diagnosing & Treating | 16 (69.6%) | 7 (30.4%) |
| Health Technologists | 16 (69.6%) | 7 (30.4%) |
| Total (Category) | 142 (52.6%) | 128 (47.4%) |
| Total (Overall) | 194 (48.5%) | 206 (51.5%) |
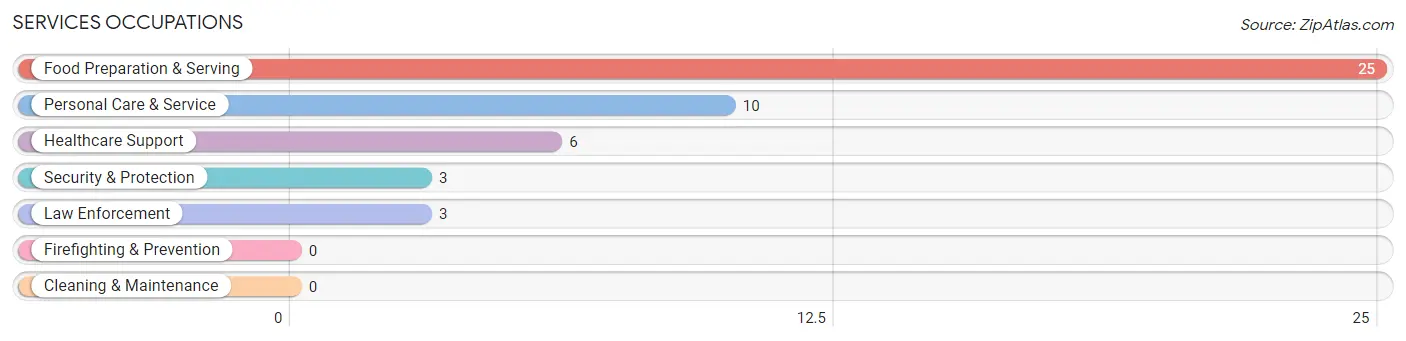
Services Occupations
The most common Services occupations in Rocky Hill borough are Food Preparation & Serving (25 | 6.2%), Personal Care & Service (10 | 2.5%), Healthcare Support (6 | 1.5%), Security & Protection (3 | 0.7%), and Law Enforcement (3 | 0.7%).
Services Occupations by Sex
Within the Services occupations in Rocky Hill borough, the most male-oriented occupations are Healthcare Support (100.0%), Security & Protection (100.0%), and Law Enforcement (100.0%), while the most female-oriented occupations are Personal Care & Service (100.0%), and Food Preparation & Serving (68.0%).
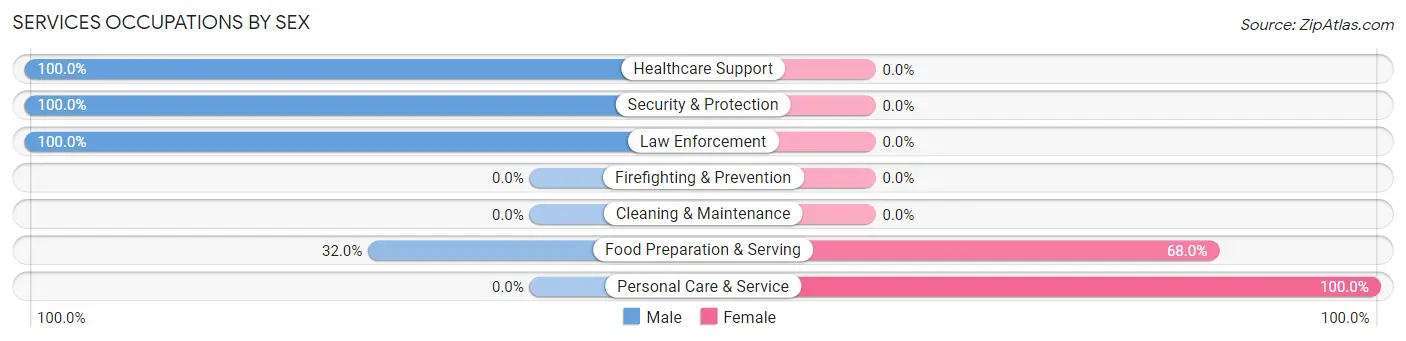
| Occupation | Male | Female |
| Healthcare Support | 6 (100.0%) | 0 (0.0%) |
| Security & Protection | 3 (100.0%) | 0 (0.0%) |
| Firefighting & Prevention | 0 (0.0%) | 0 (0.0%) |
| Law Enforcement | 3 (100.0%) | 0 (0.0%) |
| Food Preparation & Serving | 8 (32.0%) | 17 (68.0%) |
| Cleaning & Maintenance | 0 (0.0%) | 0 (0.0%) |
| Personal Care & Service | 0 (0.0%) | 10 (100.0%) |
| Total (Category) | 17 (38.6%) | 27 (61.4%) |
| Total (Overall) | 194 (48.5%) | 206 (51.5%) |
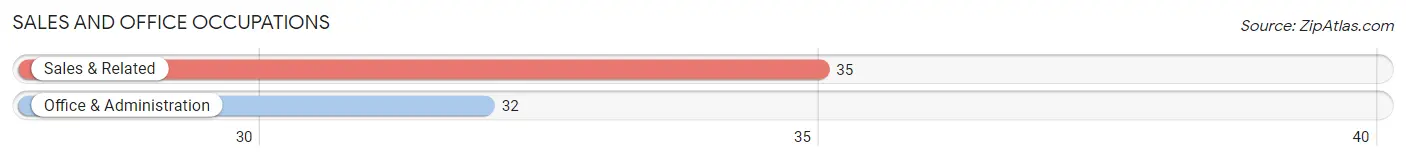
Sales and Office Occupations
The most common Sales and Office occupations in Rocky Hill borough are Sales & Related (35 | 8.7%), and Office & Administration (32 | 8.0%).
Sales and Office Occupations by Sex
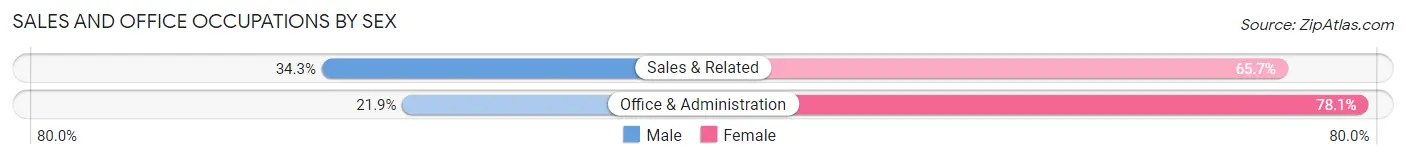
| Occupation | Male | Female |
| Sales & Related | 12 (34.3%) | 23 (65.7%) |
| Office & Administration | 7 (21.9%) | 25 (78.1%) |
| Total (Category) | 19 (28.4%) | 48 (71.6%) |
| Total (Overall) | 194 (48.5%) | 206 (51.5%) |
Natural Resources, Construction and Maintenance Occupations
The most common Natural Resources, Construction and Maintenance occupations in Rocky Hill borough are , and Construction & Extraction (8 | 2.0%).
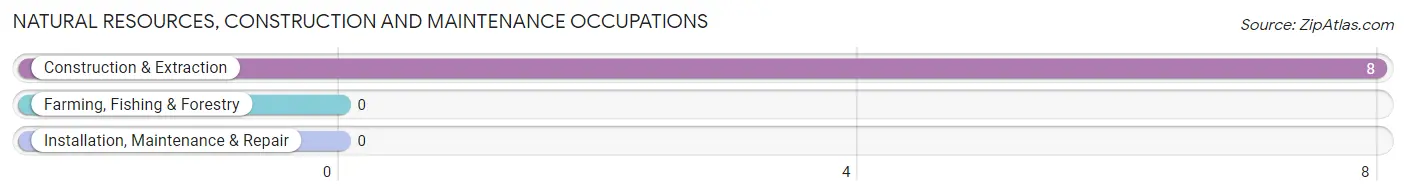
Natural Resources, Construction and Maintenance Occupations by Sex
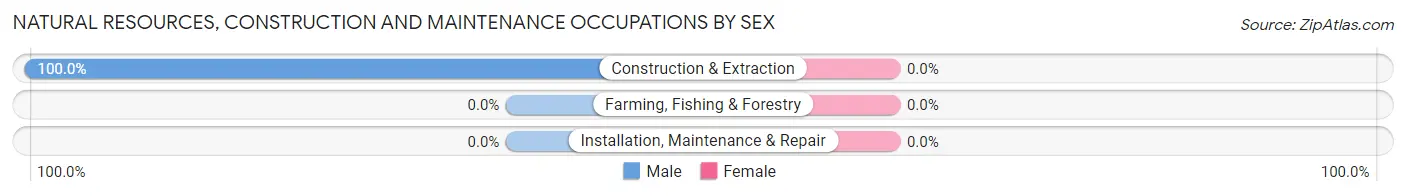
| Occupation | Male | Female |
| Farming, Fishing & Forestry | 0 (0.0%) | 0 (0.0%) |
| Construction & Extraction | 8 (100.0%) | 0 (0.0%) |
| Installation, Maintenance & Repair | 0 (0.0%) | 0 (0.0%) |
| Total (Category) | 8 (100.0%) | 0 (0.0%) |
| Total (Overall) | 194 (48.5%) | 206 (51.5%) |
Production, Transportation and Moving Occupations
The most common Production, Transportation and Moving occupations in Rocky Hill borough are Transportation (6 | 1.5%), Production (3 | 0.7%), and Material Moving (2 | 0.5%).
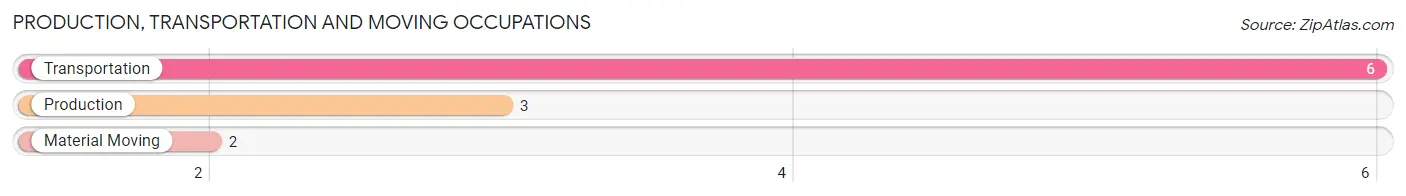
Production, Transportation and Moving Occupations by Sex
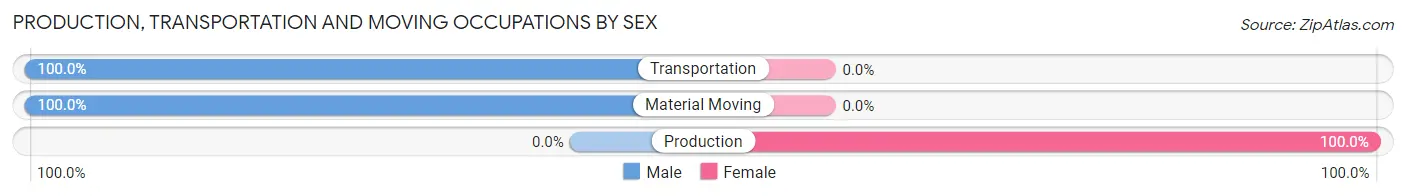
| Occupation | Male | Female |
| Production | 0 (0.0%) | 3 (100.0%) |
| Transportation | 6 (100.0%) | 0 (0.0%) |
| Material Moving | 2 (100.0%) | 0 (0.0%) |
| Total (Category) | 8 (72.7%) | 3 (27.3%) |
| Total (Overall) | 194 (48.5%) | 206 (51.5%) |
Employment Industries by Sex in Rocky Hill borough
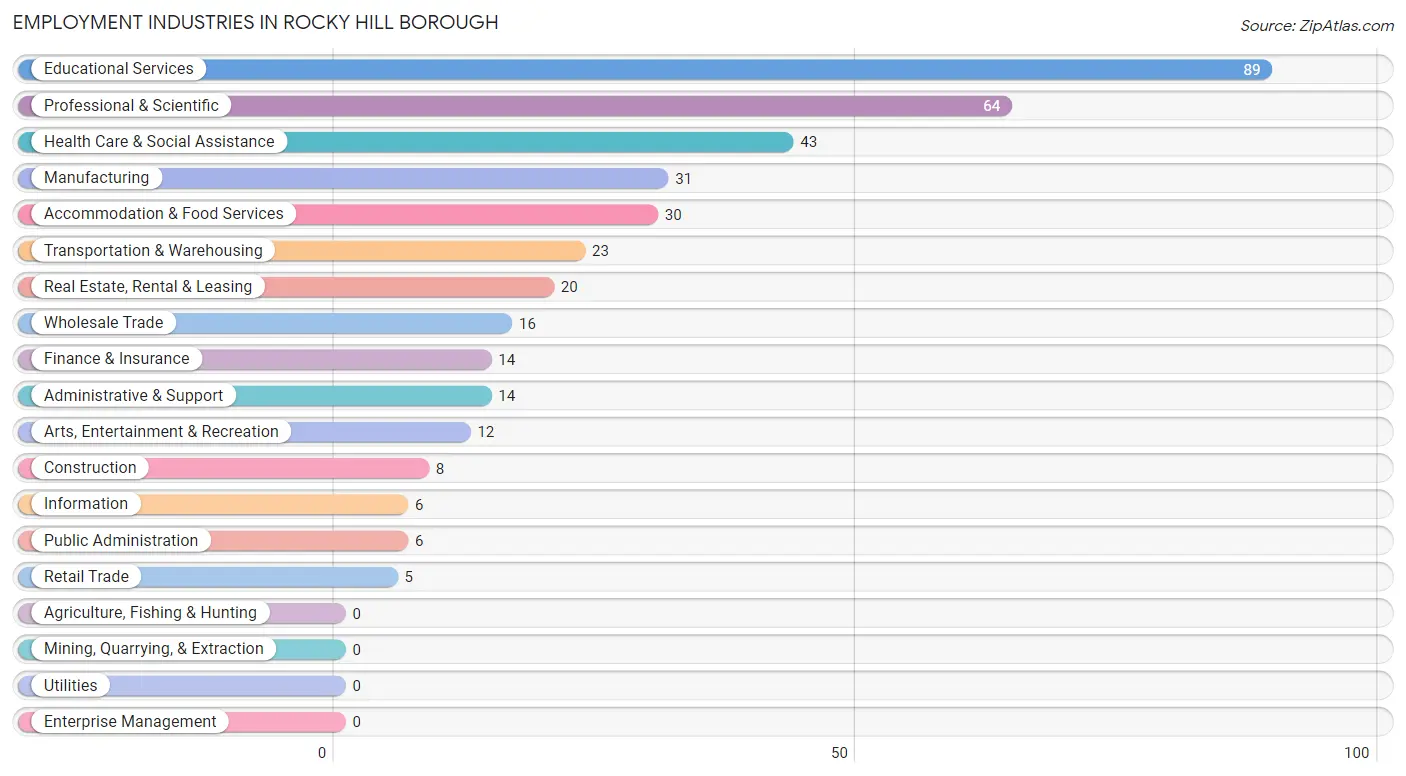
Employment Industries in Rocky Hill borough
The major employment industries in Rocky Hill borough include Educational Services (89 | 22.3%), Professional & Scientific (64 | 16.0%), Health Care & Social Assistance (43 | 10.7%), Manufacturing (31 | 7.7%), and Accommodation & Food Services (30 | 7.5%).
Employment Industries by Sex in Rocky Hill borough
The Rocky Hill borough industries that see more men than women are Construction (100.0%), Retail Trade (100.0%), and Finance & Insurance (100.0%), whereas the industries that tend to have a higher number of women are Real Estate, Rental & Leasing (100.0%), Arts, Entertainment & Recreation (100.0%), and Information (66.7%).
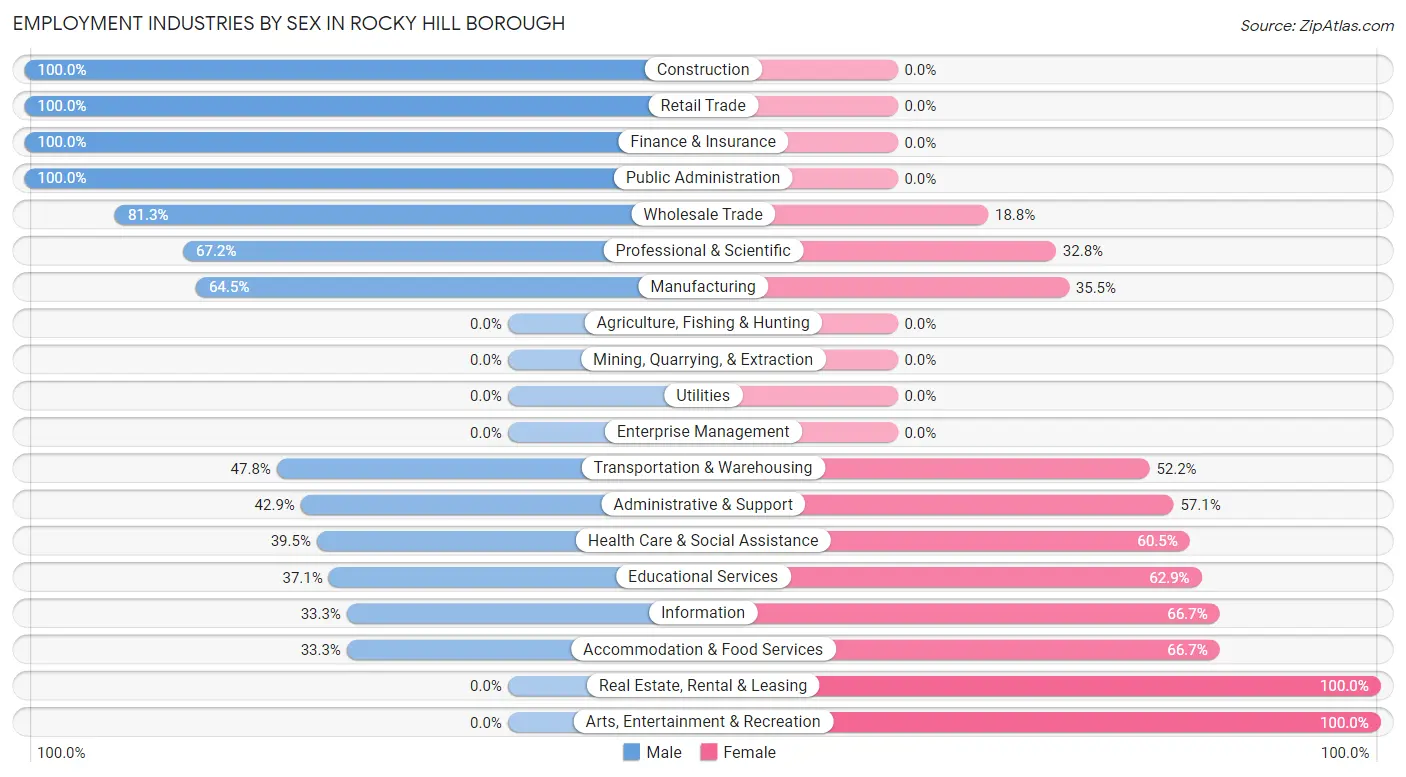
| Industry | Male | Female |
| Agriculture, Fishing & Hunting | 0 (0.0%) | 0 (0.0%) |
| Mining, Quarrying, & Extraction | 0 (0.0%) | 0 (0.0%) |
| Construction | 8 (100.0%) | 0 (0.0%) |
| Manufacturing | 20 (64.5%) | 11 (35.5%) |
| Wholesale Trade | 13 (81.2%) | 3 (18.8%) |
| Retail Trade | 5 (100.0%) | 0 (0.0%) |
| Transportation & Warehousing | 11 (47.8%) | 12 (52.2%) |
| Utilities | 0 (0.0%) | 0 (0.0%) |
| Information | 2 (33.3%) | 4 (66.7%) |
| Finance & Insurance | 14 (100.0%) | 0 (0.0%) |
| Real Estate, Rental & Leasing | 0 (0.0%) | 20 (100.0%) |
| Professional & Scientific | 43 (67.2%) | 21 (32.8%) |
| Enterprise Management | 0 (0.0%) | 0 (0.0%) |
| Administrative & Support | 6 (42.9%) | 8 (57.1%) |
| Educational Services | 33 (37.1%) | 56 (62.9%) |
| Health Care & Social Assistance | 17 (39.5%) | 26 (60.5%) |
| Arts, Entertainment & Recreation | 0 (0.0%) | 12 (100.0%) |
| Accommodation & Food Services | 10 (33.3%) | 20 (66.7%) |
| Public Administration | 6 (100.0%) | 0 (0.0%) |
| Total | 194 (48.5%) | 206 (51.5%) |
Education in Rocky Hill borough
School Enrollment in Rocky Hill borough
The most common levels of schooling among the 200 students in Rocky Hill borough are high school (40 | 20.0%), elementary school (37 | 18.5%), and college / undergraduate (35 | 17.5%).
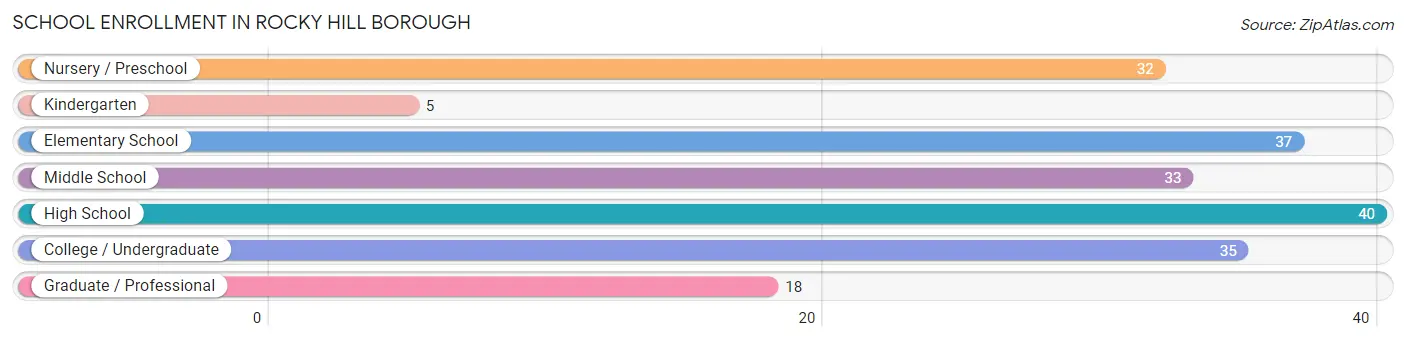
| School Level | # Students | % Students |
| Nursery / Preschool | 32 | 16.0% |
| Kindergarten | 5 | 2.5% |
| Elementary School | 37 | 18.5% |
| Middle School | 33 | 16.5% |
| High School | 40 | 20.0% |
| College / Undergraduate | 35 | 17.5% |
| Graduate / Professional | 18 | 9.0% |
| Total | 200 | 100.0% |
School Enrollment by Age by Funding Source in Rocky Hill borough
Out of a total of 200 students who are enrolled in schools in Rocky Hill borough, 67 (33.5%) attend a private institution, while the remaining 133 (66.5%) are enrolled in public schools. The age group of 35 years and over has the highest likelihood of being enrolled in private schools, with 6 (100.0% in the age bracket) enrolled. Conversely, the age group of 25 to 34 year olds has the lowest likelihood of being enrolled in a private school, with 18 (100.0% in the age bracket) attending a public institution.
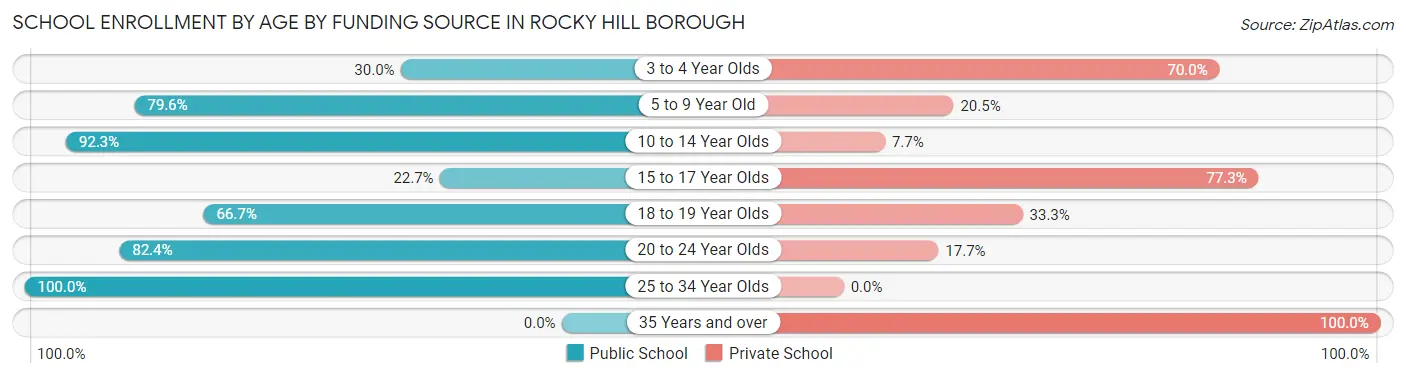
| Age Bracket | Public School | Private School |
| 3 to 4 Year Olds | 9 (30.0%) | 21 (70.0%) |
| 5 to 9 Year Old | 35 (79.5%) | 9 (20.4%) |
| 10 to 14 Year Olds | 36 (92.3%) | 3 (7.7%) |
| 15 to 17 Year Olds | 5 (22.7%) | 17 (77.3%) |
| 18 to 19 Year Olds | 16 (66.7%) | 8 (33.3%) |
| 20 to 24 Year Olds | 14 (82.4%) | 3 (17.6%) |
| 25 to 34 Year Olds | 18 (100.0%) | 0 (0.0%) |
| 35 Years and over | 0 (0.0%) | 6 (100.0%) |
| Total | 133 (66.5%) | 67 (33.5%) |
Educational Attainment by Field of Study in Rocky Hill borough
Business (68 | 14.9%), social sciences (65 | 14.3%), education (38 | 8.4%), engineering (37 | 8.1%), and literature & languages (34 | 7.5%) are the most common fields of study among 455 individuals in Rocky Hill borough who have obtained a bachelor's degree or higher.
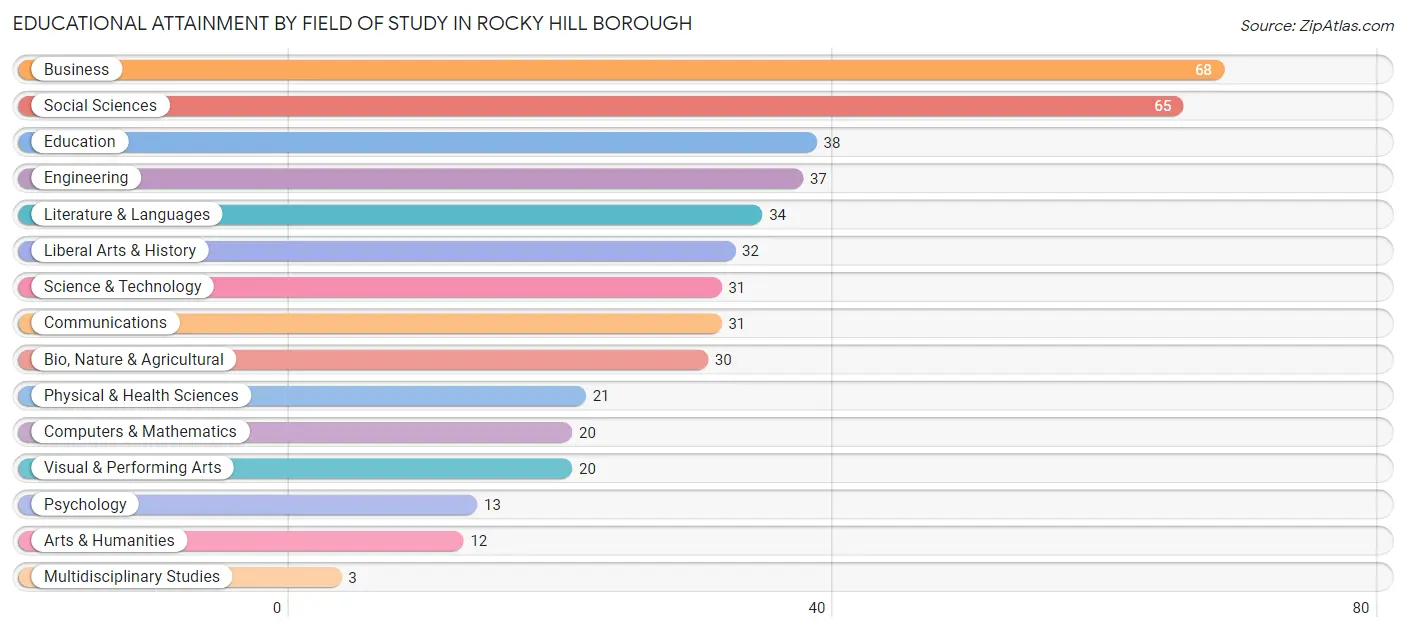
| Field of Study | # Graduates | % Graduates |
| Computers & Mathematics | 20 | 4.4% |
| Bio, Nature & Agricultural | 30 | 6.6% |
| Physical & Health Sciences | 21 | 4.6% |
| Psychology | 13 | 2.9% |
| Social Sciences | 65 | 14.3% |
| Engineering | 37 | 8.1% |
| Multidisciplinary Studies | 3 | 0.7% |
| Science & Technology | 31 | 6.8% |
| Business | 68 | 14.9% |
| Education | 38 | 8.4% |
| Literature & Languages | 34 | 7.5% |
| Liberal Arts & History | 32 | 7.0% |
| Visual & Performing Arts | 20 | 4.4% |
| Communications | 31 | 6.8% |
| Arts & Humanities | 12 | 2.6% |
| Total | 455 | 100.0% |
Transportation & Commute in Rocky Hill borough
Vehicle Availability by Sex in Rocky Hill borough
The most prevalent vehicle ownership categories in Rocky Hill borough are males with 2 vehicles (96, accounting for 49.5%) and females with 2 vehicles (93, making up 47.1%).
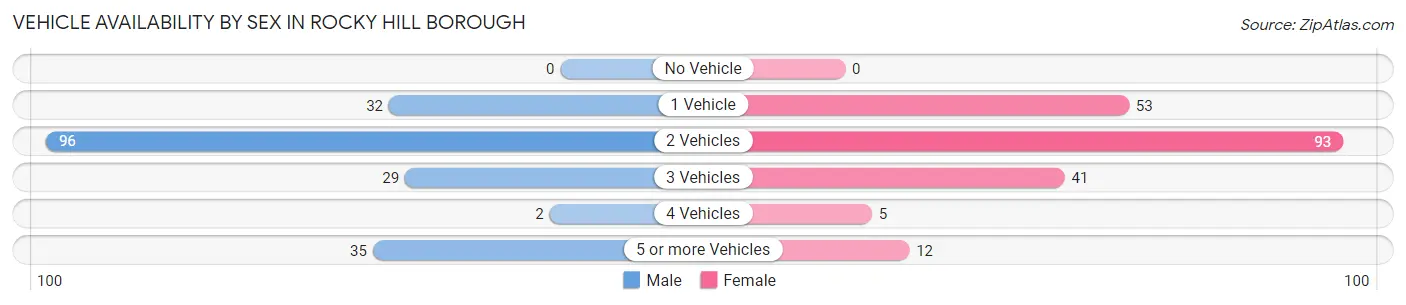
| Vehicles Available | Male | Female |
| No Vehicle | 0 (0.0%) | 0 (0.0%) |
| 1 Vehicle | 32 (16.5%) | 53 (26.0%) |
| 2 Vehicles | 96 (49.5%) | 93 (45.6%) |
| 3 Vehicles | 29 (14.9%) | 41 (20.1%) |
| 4 Vehicles | 2 (1.0%) | 5 (2.5%) |
| 5 or more Vehicles | 35 (18.0%) | 12 (5.9%) |
| Total | 194 (100.0%) | 204 (100.0%) |
Commute Time in Rocky Hill borough
The most frequently occuring commute durations in Rocky Hill borough are 5 to 9 minutes (52 commuters, 17.3%), 10 to 14 minutes (50 commuters, 16.6%), and 15 to 19 minutes (40 commuters, 13.3%).
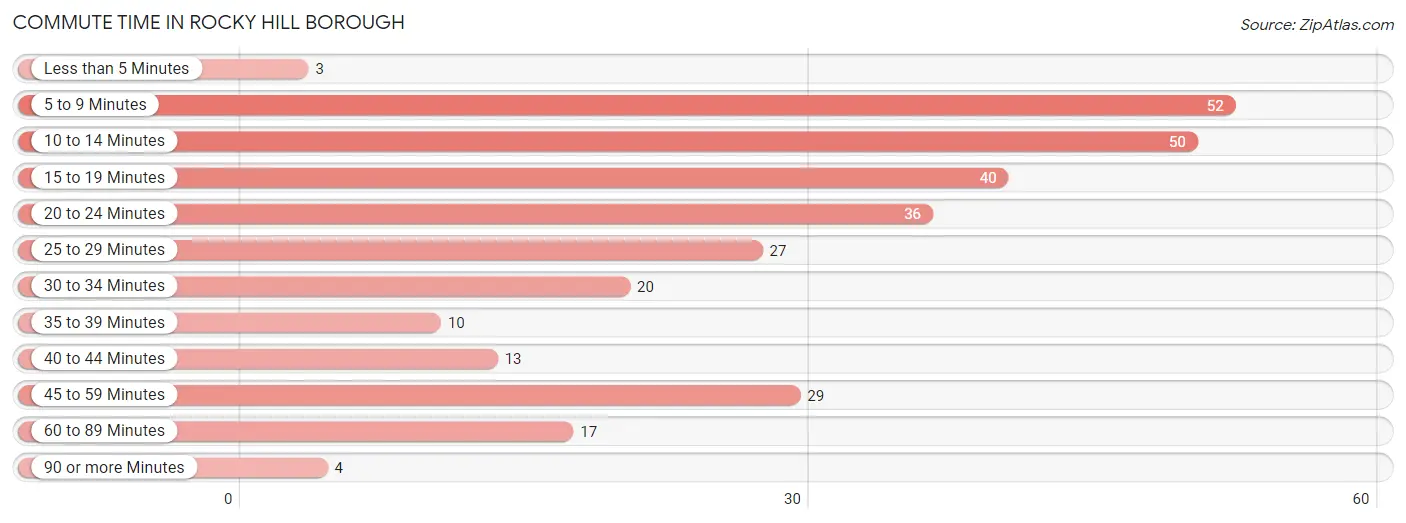
| Commute Time | # Commuters | % Commuters |
| Less than 5 Minutes | 3 | 1.0% |
| 5 to 9 Minutes | 52 | 17.3% |
| 10 to 14 Minutes | 50 | 16.6% |
| 15 to 19 Minutes | 40 | 13.3% |
| 20 to 24 Minutes | 36 | 12.0% |
| 25 to 29 Minutes | 27 | 9.0% |
| 30 to 34 Minutes | 20 | 6.6% |
| 35 to 39 Minutes | 10 | 3.3% |
| 40 to 44 Minutes | 13 | 4.3% |
| 45 to 59 Minutes | 29 | 9.6% |
| 60 to 89 Minutes | 17 | 5.7% |
| 90 or more Minutes | 4 | 1.3% |
Commute Time by Sex in Rocky Hill borough
The most common commute times in Rocky Hill borough are 10 to 14 minutes (31 commuters, 23.0%) for males and 5 to 9 minutes (32 commuters, 19.3%) for females.
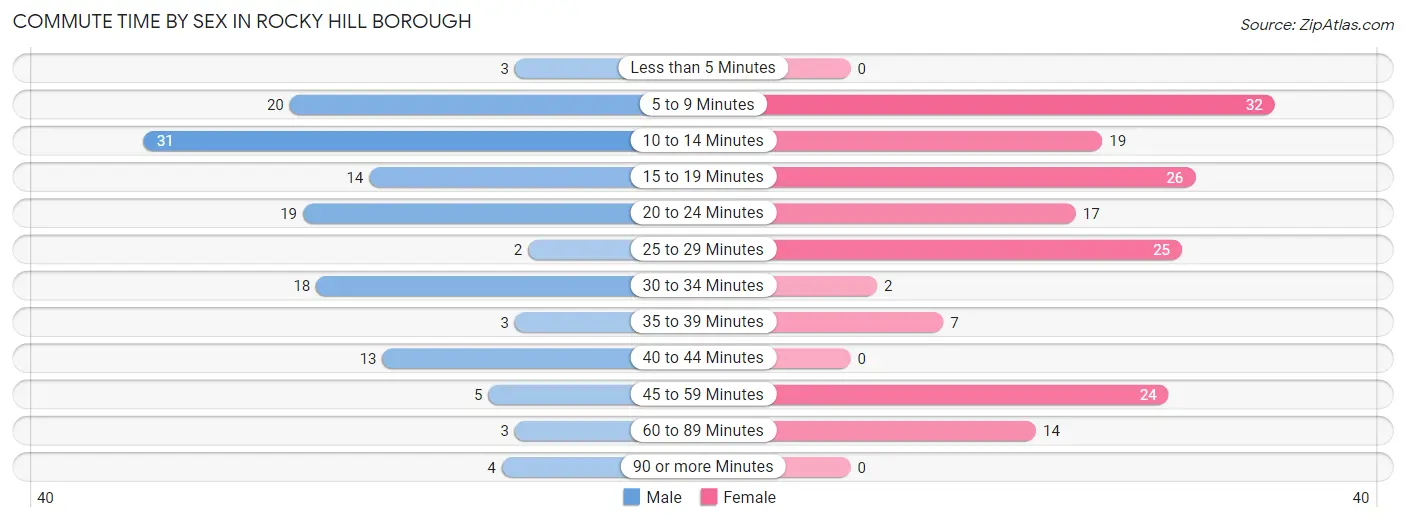
| Commute Time | Male | Female |
| Less than 5 Minutes | 3 (2.2%) | 0 (0.0%) |
| 5 to 9 Minutes | 20 (14.8%) | 32 (19.3%) |
| 10 to 14 Minutes | 31 (23.0%) | 19 (11.5%) |
| 15 to 19 Minutes | 14 (10.4%) | 26 (15.7%) |
| 20 to 24 Minutes | 19 (14.1%) | 17 (10.2%) |
| 25 to 29 Minutes | 2 (1.5%) | 25 (15.1%) |
| 30 to 34 Minutes | 18 (13.3%) | 2 (1.2%) |
| 35 to 39 Minutes | 3 (2.2%) | 7 (4.2%) |
| 40 to 44 Minutes | 13 (9.6%) | 0 (0.0%) |
| 45 to 59 Minutes | 5 (3.7%) | 24 (14.5%) |
| 60 to 89 Minutes | 3 (2.2%) | 14 (8.4%) |
| 90 or more Minutes | 4 (3.0%) | 0 (0.0%) |
Time of Departure to Work by Sex in Rocky Hill borough
The most frequent times of departure to work in Rocky Hill borough are 7:00 AM to 7:29 AM (32, 23.7%) for males and 9:00 AM to 9:59 AM (40, 24.1%) for females.
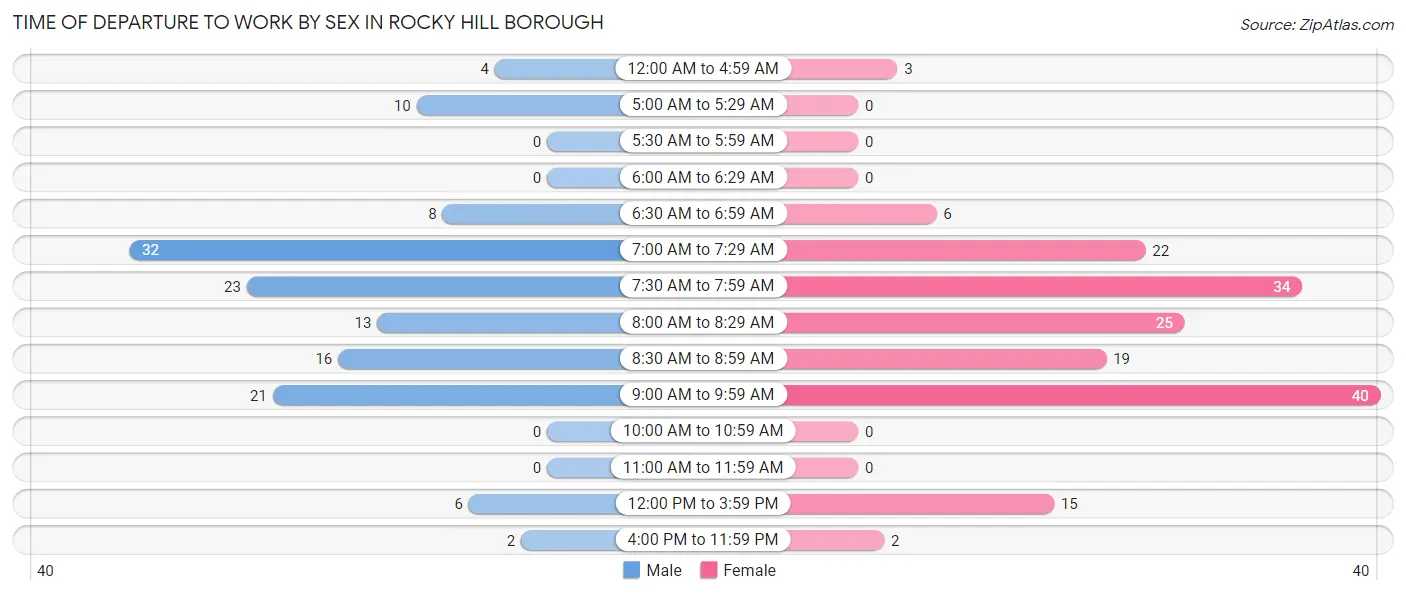
| Time of Departure | Male | Female |
| 12:00 AM to 4:59 AM | 4 (3.0%) | 3 (1.8%) |
| 5:00 AM to 5:29 AM | 10 (7.4%) | 0 (0.0%) |
| 5:30 AM to 5:59 AM | 0 (0.0%) | 0 (0.0%) |
| 6:00 AM to 6:29 AM | 0 (0.0%) | 0 (0.0%) |
| 6:30 AM to 6:59 AM | 8 (5.9%) | 6 (3.6%) |
| 7:00 AM to 7:29 AM | 32 (23.7%) | 22 (13.3%) |
| 7:30 AM to 7:59 AM | 23 (17.0%) | 34 (20.5%) |
| 8:00 AM to 8:29 AM | 13 (9.6%) | 25 (15.1%) |
| 8:30 AM to 8:59 AM | 16 (11.8%) | 19 (11.5%) |
| 9:00 AM to 9:59 AM | 21 (15.6%) | 40 (24.1%) |
| 10:00 AM to 10:59 AM | 0 (0.0%) | 0 (0.0%) |
| 11:00 AM to 11:59 AM | 0 (0.0%) | 0 (0.0%) |
| 12:00 PM to 3:59 PM | 6 (4.4%) | 15 (9.0%) |
| 4:00 PM to 11:59 PM | 2 (1.5%) | 2 (1.2%) |
| Total | 135 (100.0%) | 166 (100.0%) |
Housing Occupancy in Rocky Hill borough
Occupancy by Ownership in Rocky Hill borough
Of the total 295 dwellings in Rocky Hill borough, owner-occupied units account for 254 (86.1%), while renter-occupied units make up 41 (13.9%).
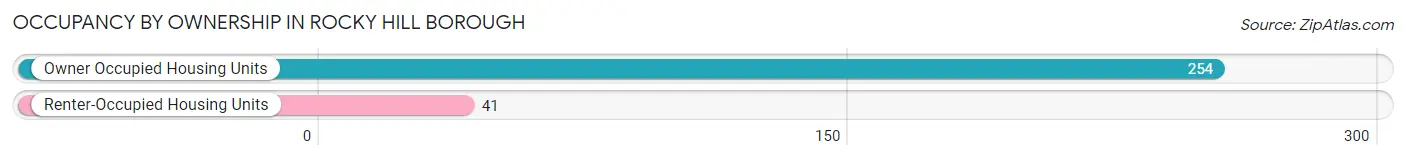
| Occupancy | # Housing Units | % Housing Units |
| Owner Occupied Housing Units | 254 | 86.1% |
| Renter-Occupied Housing Units | 41 | 13.9% |
| Total Occupied Housing Units | 295 | 100.0% |
Occupancy by Household Size in Rocky Hill borough
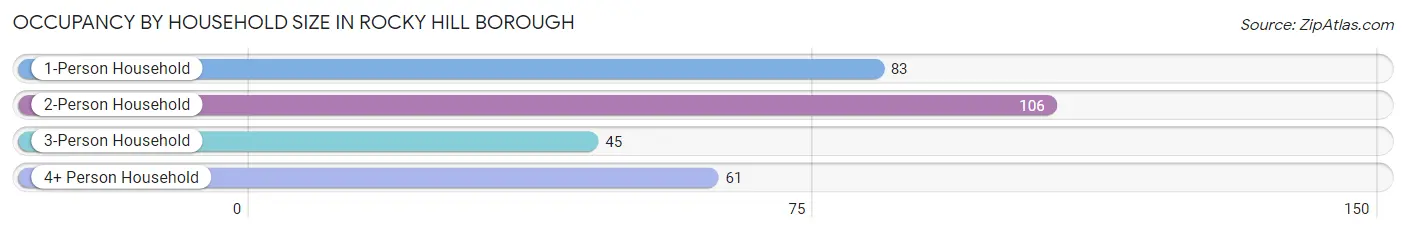
| Household Size | # Housing Units | % Housing Units |
| 1-Person Household | 83 | 28.1% |
| 2-Person Household | 106 | 35.9% |
| 3-Person Household | 45 | 15.2% |
| 4+ Person Household | 61 | 20.7% |
| Total Housing Units | 295 | 100.0% |
Occupancy by Ownership by Household Size in Rocky Hill borough
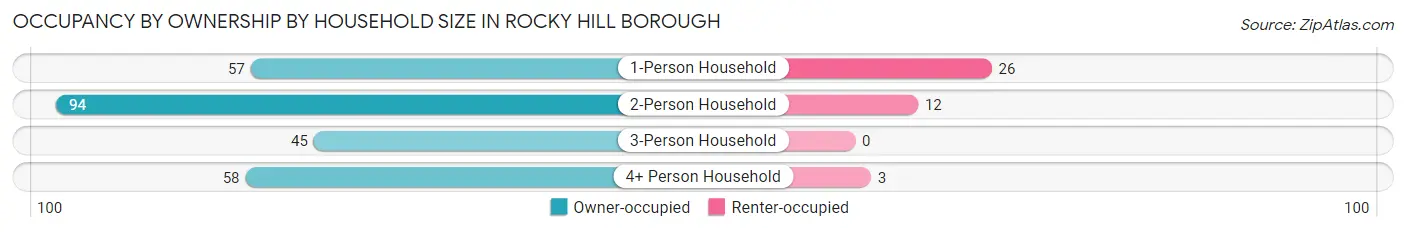
| Household Size | Owner-occupied | Renter-occupied |
| 1-Person Household | 57 (68.7%) | 26 (31.3%) |
| 2-Person Household | 94 (88.7%) | 12 (11.3%) |
| 3-Person Household | 45 (100.0%) | 0 (0.0%) |
| 4+ Person Household | 58 (95.1%) | 3 (4.9%) |
| Total Housing Units | 254 (86.1%) | 41 (13.9%) |
Occupancy by Educational Attainment in Rocky Hill borough
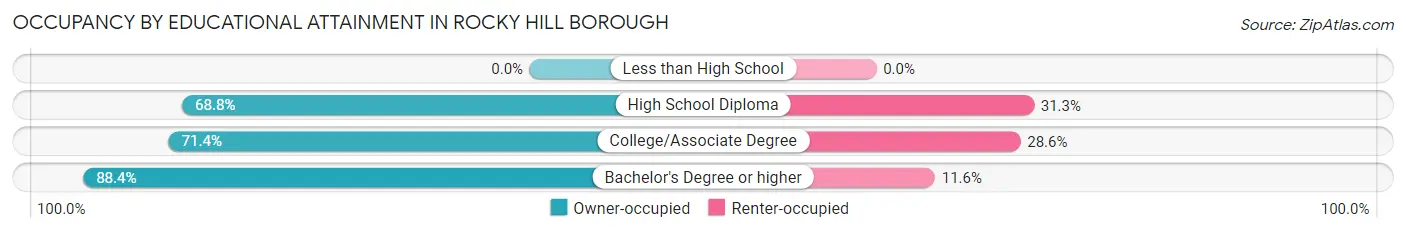
| Household Size | Owner-occupied | Renter-occupied |
| Less than High School | 0 (0.0%) | 0 (0.0%) |
| High School Diploma | 11 (68.8%) | 5 (31.2%) |
| College/Associate Degree | 15 (71.4%) | 6 (28.6%) |
| Bachelor's Degree or higher | 228 (88.4%) | 30 (11.6%) |
Occupancy by Age of Householder in Rocky Hill borough
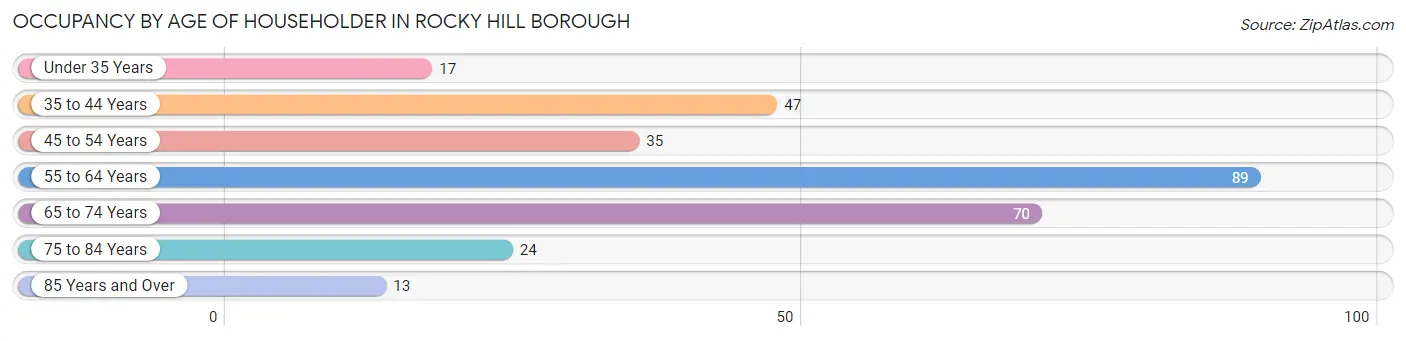
| Age Bracket | # Households | % Households |
| Under 35 Years | 17 | 5.8% |
| 35 to 44 Years | 47 | 15.9% |
| 45 to 54 Years | 35 | 11.9% |
| 55 to 64 Years | 89 | 30.2% |
| 65 to 74 Years | 70 | 23.7% |
| 75 to 84 Years | 24 | 8.1% |
| 85 Years and Over | 13 | 4.4% |
| Total | 295 | 100.0% |
Housing Finances in Rocky Hill borough
Median Income by Occupancy in Rocky Hill borough
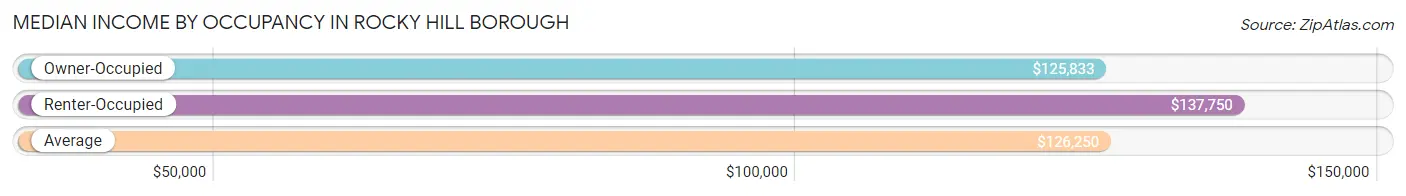
| Occupancy Type | # Households | Median Income |
| Owner-Occupied | 254 (86.1%) | $125,833 |
| Renter-Occupied | 41 (13.9%) | $137,750 |
| Average | 295 (100.0%) | $126,250 |
Occupancy by Householder Income Bracket in Rocky Hill borough
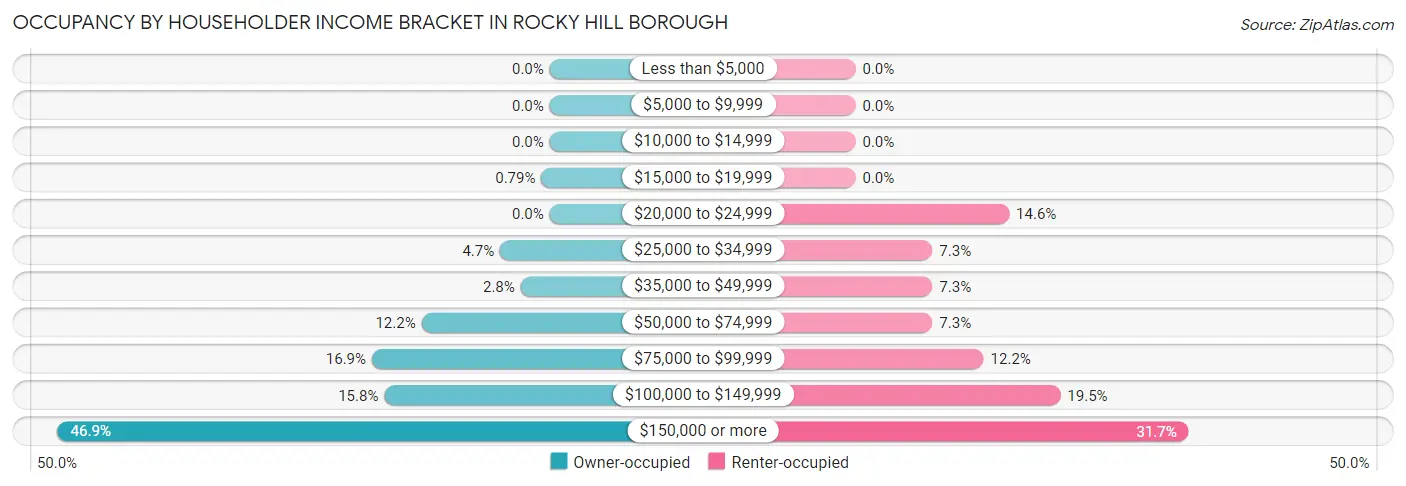
| Income Bracket | Owner-occupied | Renter-occupied |
| Less than $5,000 | 0 (0.0%) | 0 (0.0%) |
| $5,000 to $9,999 | 0 (0.0%) | 0 (0.0%) |
| $10,000 to $14,999 | 0 (0.0%) | 0 (0.0%) |
| $15,000 to $19,999 | 2 (0.8%) | 0 (0.0%) |
| $20,000 to $24,999 | 0 (0.0%) | 6 (14.6%) |
| $25,000 to $34,999 | 12 (4.7%) | 3 (7.3%) |
| $35,000 to $49,999 | 7 (2.8%) | 3 (7.3%) |
| $50,000 to $74,999 | 31 (12.2%) | 3 (7.3%) |
| $75,000 to $99,999 | 43 (16.9%) | 5 (12.2%) |
| $100,000 to $149,999 | 40 (15.8%) | 8 (19.5%) |
| $150,000 or more | 119 (46.9%) | 13 (31.7%) |
| Total | 254 (100.0%) | 41 (100.0%) |
Monthly Housing Cost Tiers in Rocky Hill borough
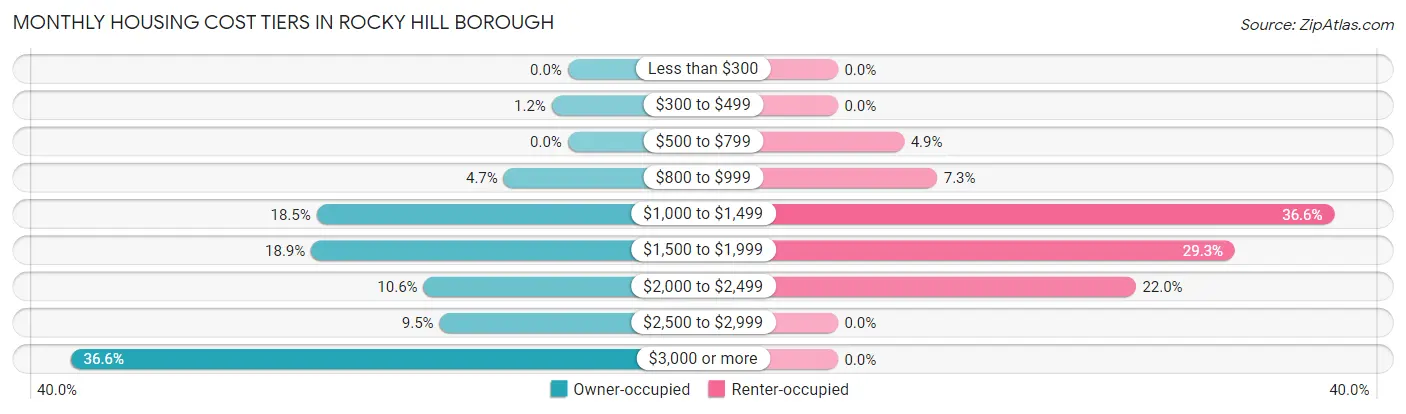
| Monthly Cost | Owner-occupied | Renter-occupied |
| Less than $300 | 0 (0.0%) | 0 (0.0%) |
| $300 to $499 | 3 (1.2%) | 0 (0.0%) |
| $500 to $799 | 0 (0.0%) | 2 (4.9%) |
| $800 to $999 | 12 (4.7%) | 3 (7.3%) |
| $1,000 to $1,499 | 47 (18.5%) | 15 (36.6%) |
| $1,500 to $1,999 | 48 (18.9%) | 12 (29.3%) |
| $2,000 to $2,499 | 27 (10.6%) | 9 (22.0%) |
| $2,500 to $2,999 | 24 (9.5%) | 0 (0.0%) |
| $3,000 or more | 93 (36.6%) | 0 (0.0%) |
| Total | 254 (100.0%) | 41 (100.0%) |
Physical Housing Characteristics in Rocky Hill borough
Housing Structures in Rocky Hill borough
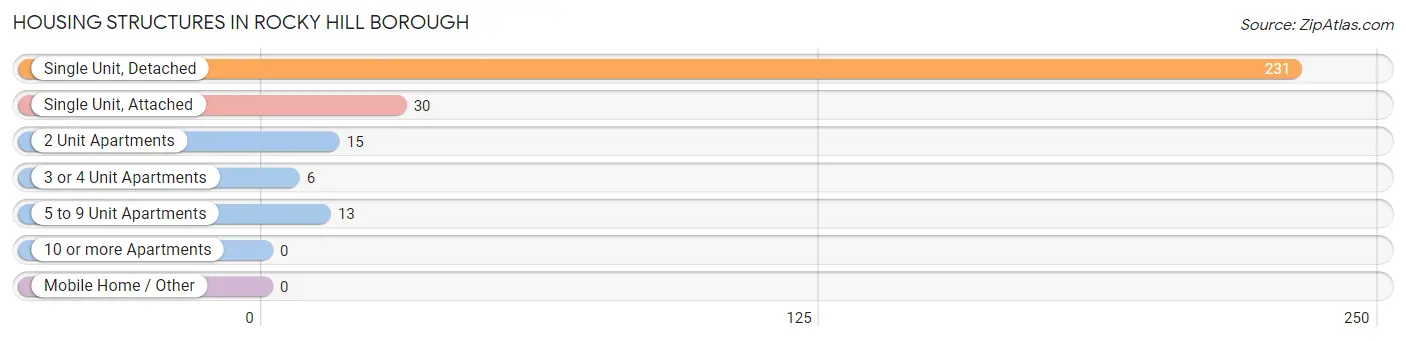
| Structure Type | # Housing Units | % Housing Units |
| Single Unit, Detached | 231 | 78.3% |
| Single Unit, Attached | 30 | 10.2% |
| 2 Unit Apartments | 15 | 5.1% |
| 3 or 4 Unit Apartments | 6 | 2.0% |
| 5 to 9 Unit Apartments | 13 | 4.4% |
| 10 or more Apartments | 0 | 0.0% |
| Mobile Home / Other | 0 | 0.0% |
| Total | 295 | 100.0% |
Housing Structures by Occupancy in Rocky Hill borough
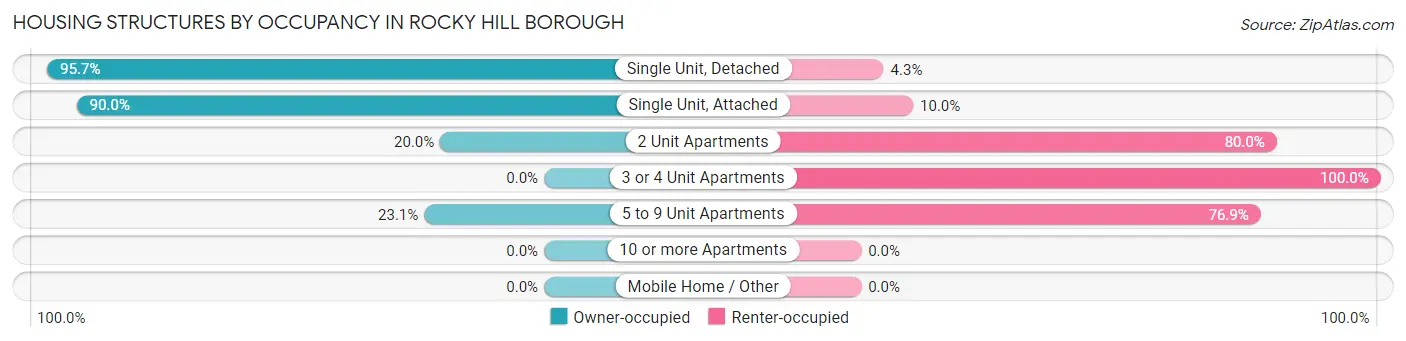
| Structure Type | Owner-occupied | Renter-occupied |
| Single Unit, Detached | 221 (95.7%) | 10 (4.3%) |
| Single Unit, Attached | 27 (90.0%) | 3 (10.0%) |
| 2 Unit Apartments | 3 (20.0%) | 12 (80.0%) |
| 3 or 4 Unit Apartments | 0 (0.0%) | 6 (100.0%) |
| 5 to 9 Unit Apartments | 3 (23.1%) | 10 (76.9%) |
| 10 or more Apartments | 0 (0.0%) | 0 (0.0%) |
| Mobile Home / Other | 0 (0.0%) | 0 (0.0%) |
| Total | 254 (86.1%) | 41 (13.9%) |
Housing Structures by Number of Rooms in Rocky Hill borough
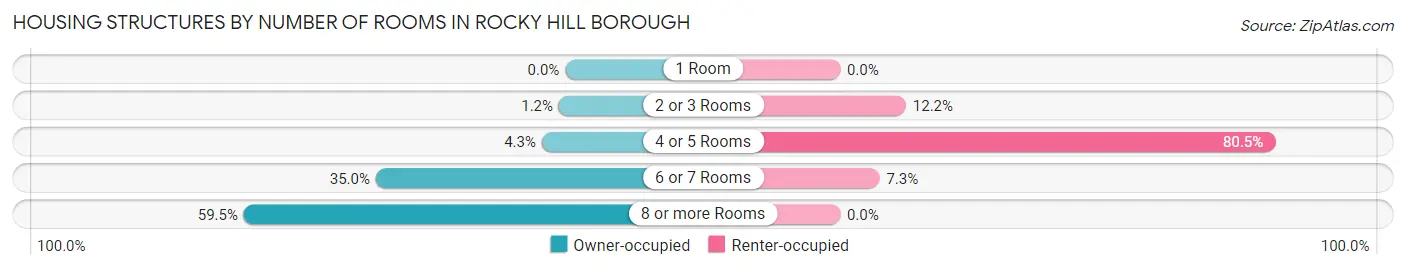
| Number of Rooms | Owner-occupied | Renter-occupied |
| 1 Room | 0 (0.0%) | 0 (0.0%) |
| 2 or 3 Rooms | 3 (1.2%) | 5 (12.2%) |
| 4 or 5 Rooms | 11 (4.3%) | 33 (80.5%) |
| 6 or 7 Rooms | 89 (35.0%) | 3 (7.3%) |
| 8 or more Rooms | 151 (59.5%) | 0 (0.0%) |
| Total | 254 (100.0%) | 41 (100.0%) |
Housing Structure by Heating Type in Rocky Hill borough
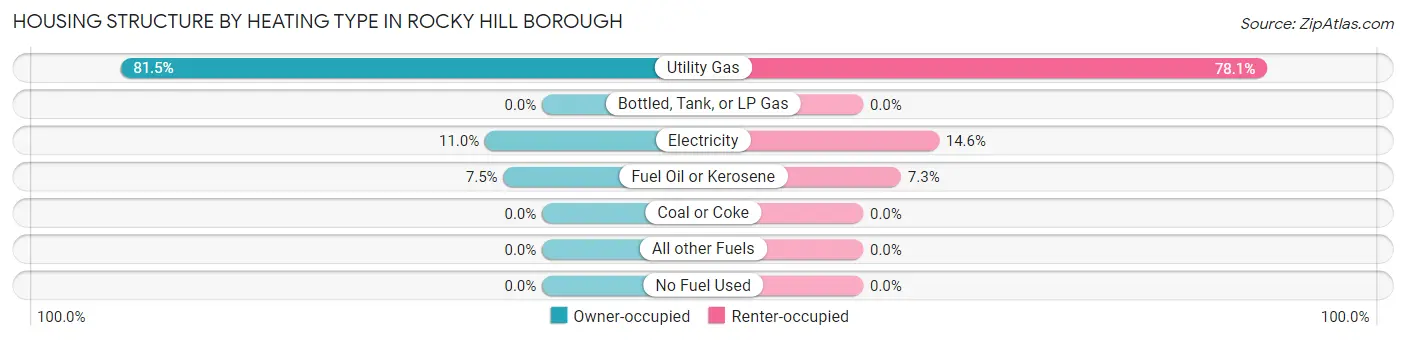
| Heating Type | Owner-occupied | Renter-occupied |
| Utility Gas | 207 (81.5%) | 32 (78.0%) |
| Bottled, Tank, or LP Gas | 0 (0.0%) | 0 (0.0%) |
| Electricity | 28 (11.0%) | 6 (14.6%) |
| Fuel Oil or Kerosene | 19 (7.5%) | 3 (7.3%) |
| Coal or Coke | 0 (0.0%) | 0 (0.0%) |
| All other Fuels | 0 (0.0%) | 0 (0.0%) |
| No Fuel Used | 0 (0.0%) | 0 (0.0%) |
| Total | 254 (100.0%) | 41 (100.0%) |
Household Vehicle Usage in Rocky Hill borough
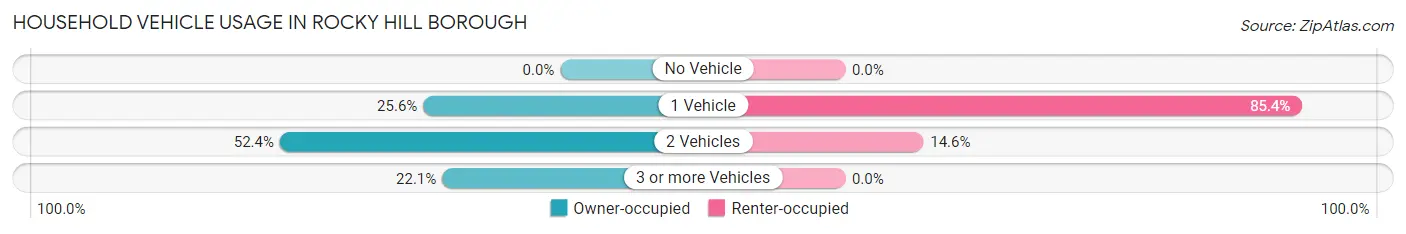
| Vehicles per Household | Owner-occupied | Renter-occupied |
| No Vehicle | 0 (0.0%) | 0 (0.0%) |
| 1 Vehicle | 65 (25.6%) | 35 (85.4%) |
| 2 Vehicles | 133 (52.4%) | 6 (14.6%) |
| 3 or more Vehicles | 56 (22.1%) | 0 (0.0%) |
| Total | 254 (100.0%) | 41 (100.0%) |
Real Estate & Mortgages in Rocky Hill borough
Real Estate and Mortgage Overview in Rocky Hill borough
| Characteristic | Without Mortgage | With Mortgage |
| Housing Units | 111 | 143 |
| Median Property Value | $592,900 | $580,100 |
| Median Household Income | $93,036 | $86 |
| Monthly Housing Costs | $1,419 | $93 |
| Real Estate Taxes | $10,001 | $0 |
Property Value by Mortgage Status in Rocky Hill borough
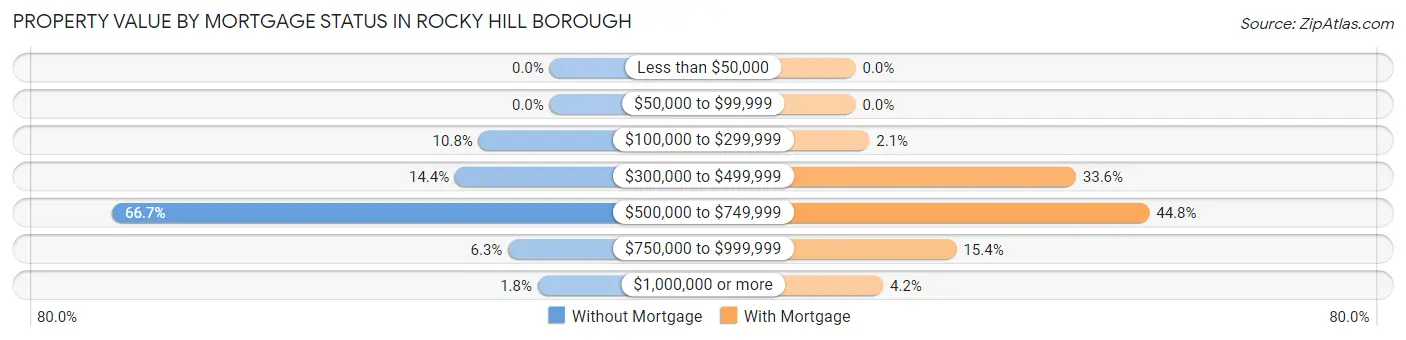
| Property Value | Without Mortgage | With Mortgage |
| Less than $50,000 | 0 (0.0%) | 0 (0.0%) |
| $50,000 to $99,999 | 0 (0.0%) | 0 (0.0%) |
| $100,000 to $299,999 | 12 (10.8%) | 3 (2.1%) |
| $300,000 to $499,999 | 16 (14.4%) | 48 (33.6%) |
| $500,000 to $749,999 | 74 (66.7%) | 64 (44.8%) |
| $750,000 to $999,999 | 7 (6.3%) | 22 (15.4%) |
| $1,000,000 or more | 2 (1.8%) | 6 (4.2%) |
| Total | 111 (100.0%) | 143 (100.0%) |
Household Income by Mortgage Status in Rocky Hill borough
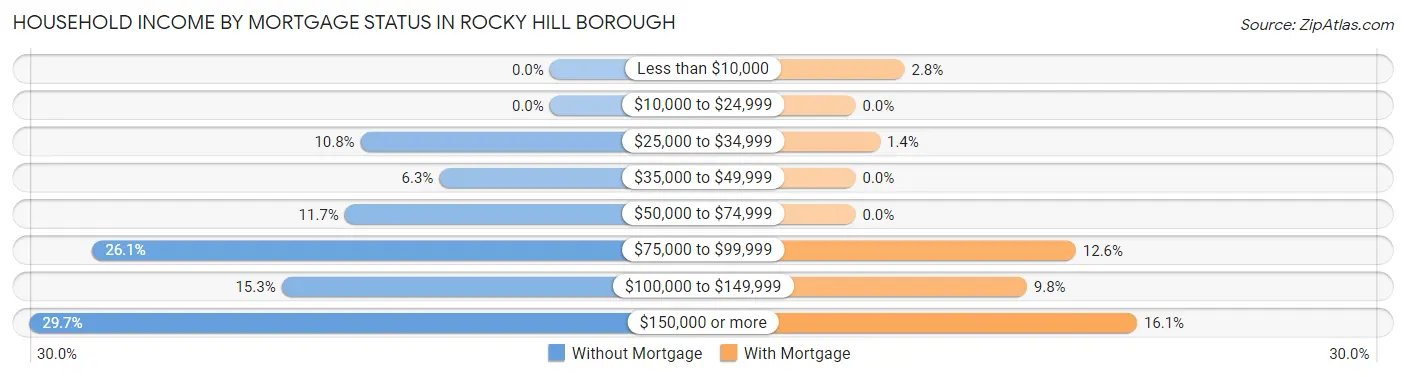
| Household Income | Without Mortgage | With Mortgage |
| Less than $10,000 | 0 (0.0%) | 4 (2.8%) |
| $10,000 to $24,999 | 0 (0.0%) | 0 (0.0%) |
| $25,000 to $34,999 | 12 (10.8%) | 2 (1.4%) |
| $35,000 to $49,999 | 7 (6.3%) | 0 (0.0%) |
| $50,000 to $74,999 | 13 (11.7%) | 0 (0.0%) |
| $75,000 to $99,999 | 29 (26.1%) | 18 (12.6%) |
| $100,000 to $149,999 | 17 (15.3%) | 14 (9.8%) |
| $150,000 or more | 33 (29.7%) | 23 (16.1%) |
| Total | 111 (100.0%) | 143 (100.0%) |
Property Value to Household Income Ratio in Rocky Hill borough
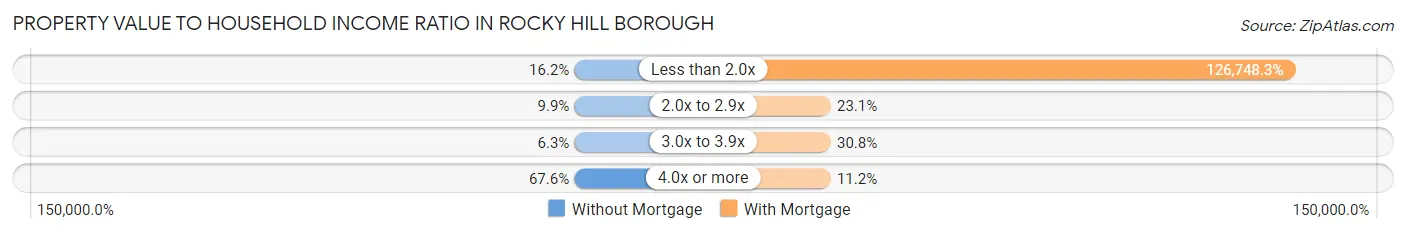
| Value-to-Income Ratio | Without Mortgage | With Mortgage |
| Less than 2.0x | 18 (16.2%) | 181,250 (126,748.3%) |
| 2.0x to 2.9x | 11 (9.9%) | 33 (23.1%) |
| 3.0x to 3.9x | 7 (6.3%) | 44 (30.8%) |
| 4.0x or more | 75 (67.6%) | 16 (11.2%) |
| Total | 111 (100.0%) | 143 (100.0%) |
Real Estate Taxes by Mortgage Status in Rocky Hill borough
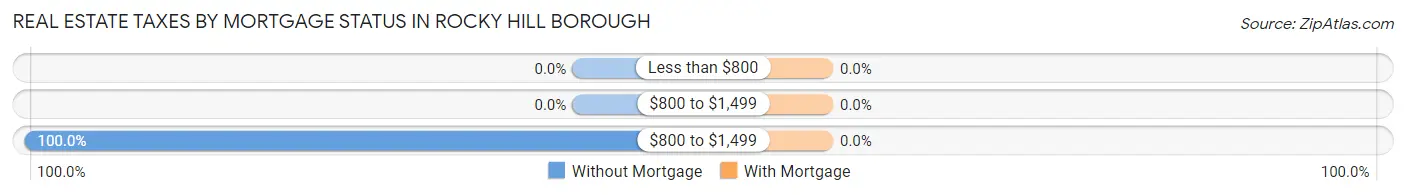
| Property Taxes | Without Mortgage | With Mortgage |
| Less than $800 | 0 (0.0%) | 0 (0.0%) |
| $800 to $1,499 | 0 (0.0%) | 0 (0.0%) |
| $800 to $1,499 | 111 (100.0%) | 0 (0.0%) |
| Total | 111 (100.0%) | 143 (100.0%) |
Health & Disability in Rocky Hill borough
Health Insurance Coverage by Age in Rocky Hill borough
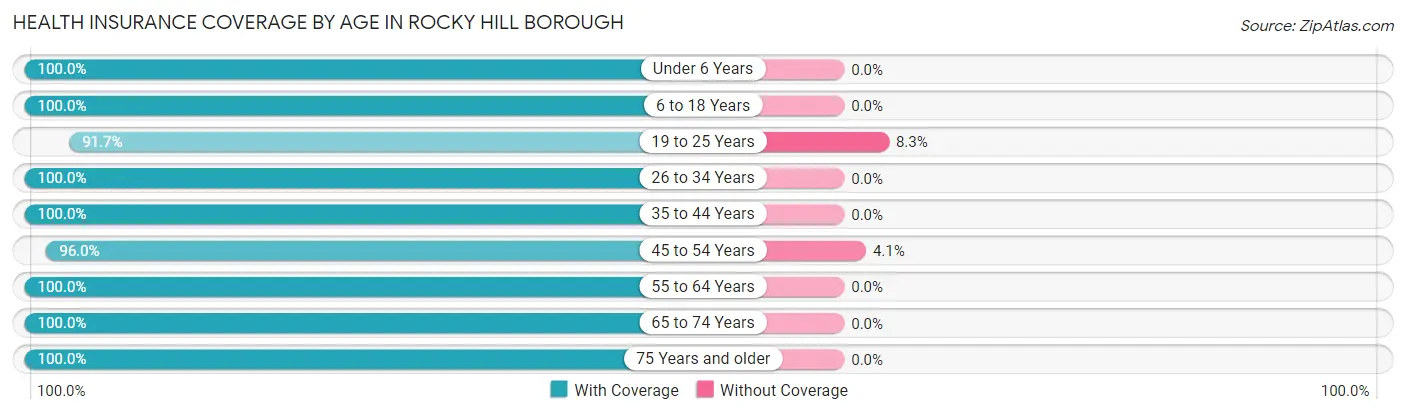
| Age Bracket | With Coverage | Without Coverage |
| Under 6 Years | 65 (100.0%) | 0 (0.0%) |
| 6 to 18 Years | 105 (100.0%) | 0 (0.0%) |
| 19 to 25 Years | 88 (91.7%) | 8 (8.3%) |
| 26 to 34 Years | 48 (100.0%) | 0 (0.0%) |
| 35 to 44 Years | 98 (100.0%) | 0 (0.0%) |
| 45 to 54 Years | 71 (96.0%) | 3 (4.1%) |
| 55 to 64 Years | 148 (100.0%) | 0 (0.0%) |
| 65 to 74 Years | 111 (100.0%) | 0 (0.0%) |
| 75 Years and older | 49 (100.0%) | 0 (0.0%) |
| Total | 783 (98.6%) | 11 (1.4%) |
Health Insurance Coverage by Citizenship Status in Rocky Hill borough
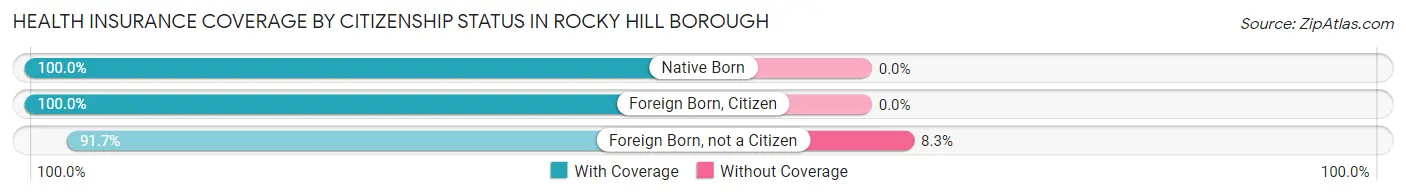
| Citizenship Status | With Coverage | Without Coverage |
| Native Born | 65 (100.0%) | 0 (0.0%) |
| Foreign Born, Citizen | 105 (100.0%) | 0 (0.0%) |
| Foreign Born, not a Citizen | 88 (91.7%) | 8 (8.3%) |
Health Insurance Coverage by Household Income in Rocky Hill borough
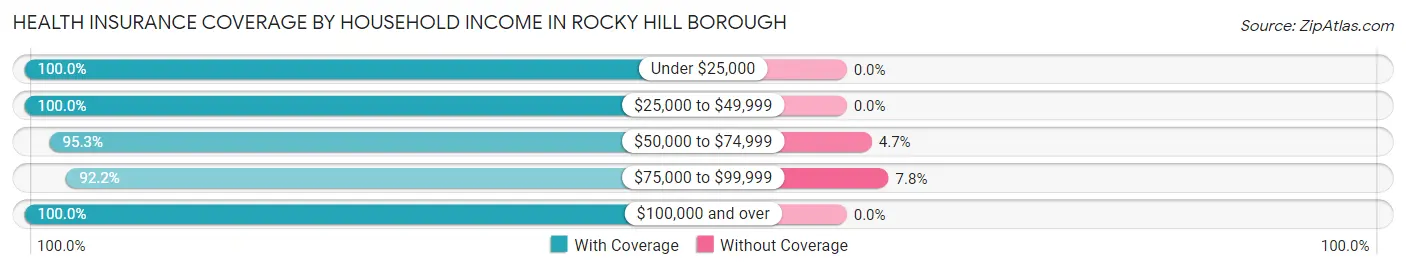
| Household Income | With Coverage | Without Coverage |
| Under $25,000 | 8 (100.0%) | 0 (0.0%) |
| $25,000 to $49,999 | 35 (100.0%) | 0 (0.0%) |
| $50,000 to $74,999 | 61 (95.3%) | 3 (4.7%) |
| $75,000 to $99,999 | 94 (92.2%) | 8 (7.8%) |
| $100,000 and over | 571 (100.0%) | 0 (0.0%) |
Public vs Private Health Insurance Coverage by Age in Rocky Hill borough
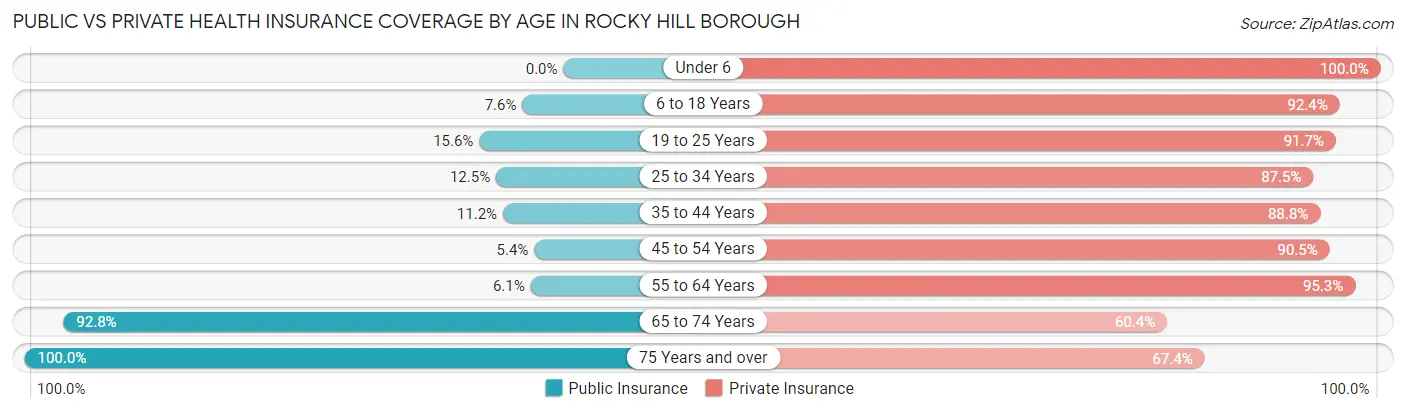
| Age Bracket | Public Insurance | Private Insurance |
| Under 6 | 0 (0.0%) | 65 (100.0%) |
| 6 to 18 Years | 8 (7.6%) | 97 (92.4%) |
| 19 to 25 Years | 15 (15.6%) | 88 (91.7%) |
| 25 to 34 Years | 6 (12.5%) | 42 (87.5%) |
| 35 to 44 Years | 11 (11.2%) | 87 (88.8%) |
| 45 to 54 Years | 4 (5.4%) | 67 (90.5%) |
| 55 to 64 Years | 9 (6.1%) | 141 (95.3%) |
| 65 to 74 Years | 103 (92.8%) | 67 (60.4%) |
| 75 Years and over | 49 (100.0%) | 33 (67.3%) |
| Total | 205 (25.8%) | 687 (86.5%) |
Disability Status by Sex by Age in Rocky Hill borough
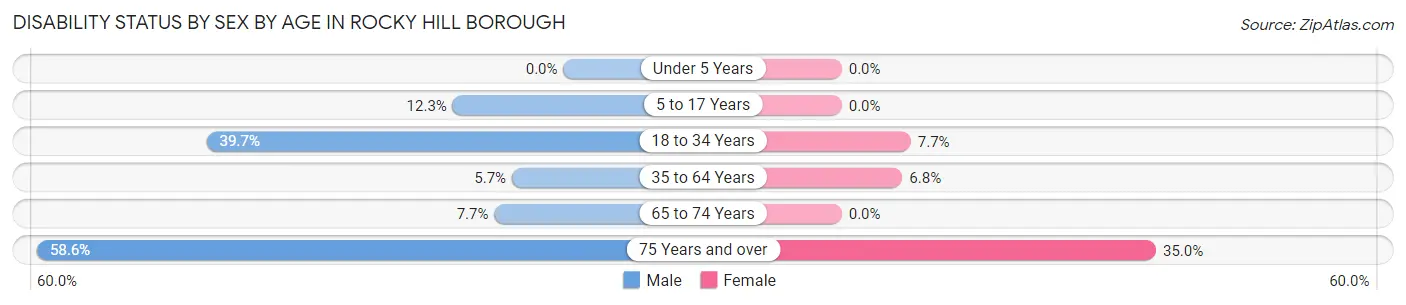
| Age Bracket | Male | Female |
| Under 5 Years | 0 (0.0%) | 0 (0.0%) |
| 5 to 17 Years | 9 (12.3%) | 0 (0.0%) |
| 18 to 34 Years | 29 (39.7%) | 6 (7.7%) |
| 35 to 64 Years | 9 (5.7%) | 11 (6.8%) |
| 65 to 74 Years | 5 (7.7%) | 0 (0.0%) |
| 75 Years and over | 17 (58.6%) | 7 (35.0%) |
Disability Class by Sex by Age in Rocky Hill borough
Disability Class: Hearing Difficulty
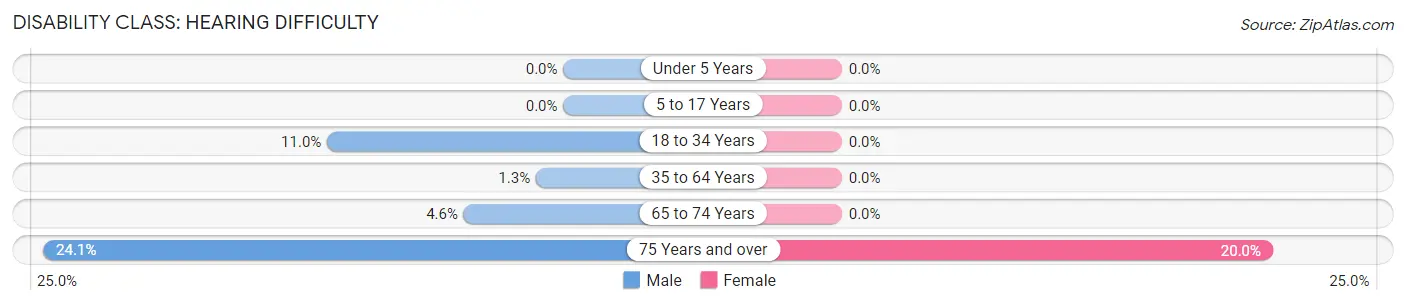
| Age Bracket | Male | Female |
| Under 5 Years | 0 (0.0%) | 0 (0.0%) |
| 5 to 17 Years | 0 (0.0%) | 0 (0.0%) |
| 18 to 34 Years | 8 (11.0%) | 0 (0.0%) |
| 35 to 64 Years | 2 (1.3%) | 0 (0.0%) |
| 65 to 74 Years | 3 (4.6%) | 0 (0.0%) |
| 75 Years and over | 7 (24.1%) | 4 (20.0%) |
Disability Class: Vision Difficulty
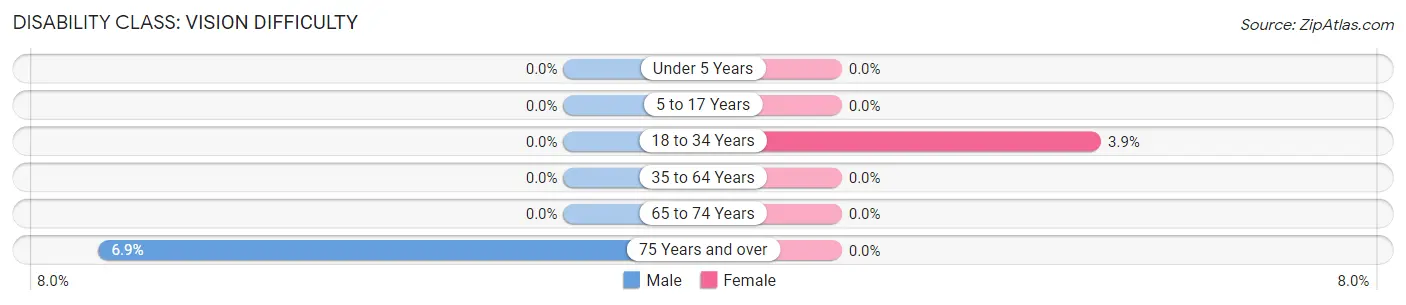
| Age Bracket | Male | Female |
| Under 5 Years | 0 (0.0%) | 0 (0.0%) |
| 5 to 17 Years | 0 (0.0%) | 0 (0.0%) |
| 18 to 34 Years | 0 (0.0%) | 3 (3.8%) |
| 35 to 64 Years | 0 (0.0%) | 0 (0.0%) |
| 65 to 74 Years | 0 (0.0%) | 0 (0.0%) |
| 75 Years and over | 2 (6.9%) | 0 (0.0%) |
Disability Class: Cognitive Difficulty
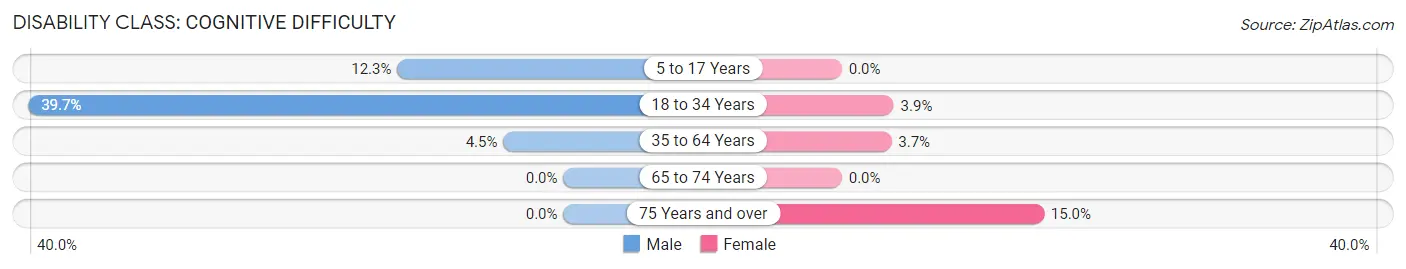
| Age Bracket | Male | Female |
| 5 to 17 Years | 9 (12.3%) | 0 (0.0%) |
| 18 to 34 Years | 29 (39.7%) | 3 (3.8%) |
| 35 to 64 Years | 7 (4.5%) | 6 (3.7%) |
| 65 to 74 Years | 0 (0.0%) | 0 (0.0%) |
| 75 Years and over | 0 (0.0%) | 3 (15.0%) |
Disability Class: Ambulatory Difficulty
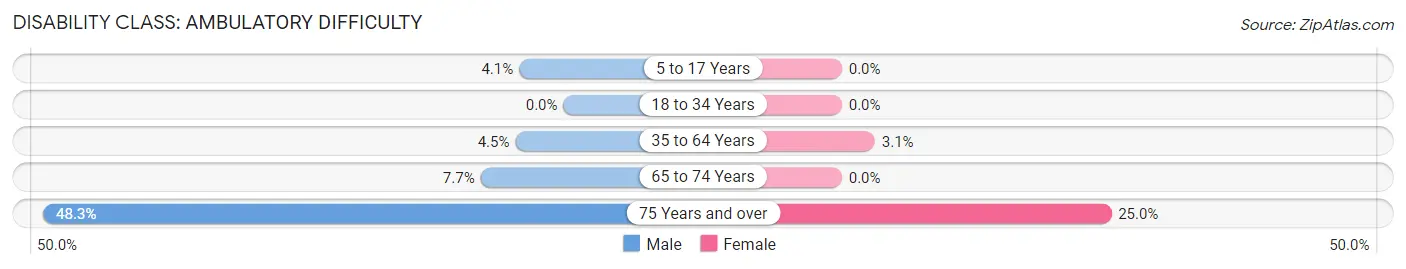
| Age Bracket | Male | Female |
| 5 to 17 Years | 3 (4.1%) | 0 (0.0%) |
| 18 to 34 Years | 0 (0.0%) | 0 (0.0%) |
| 35 to 64 Years | 7 (4.5%) | 5 (3.1%) |
| 65 to 74 Years | 5 (7.7%) | 0 (0.0%) |
| 75 Years and over | 14 (48.3%) | 5 (25.0%) |
Disability Class: Self-Care Difficulty
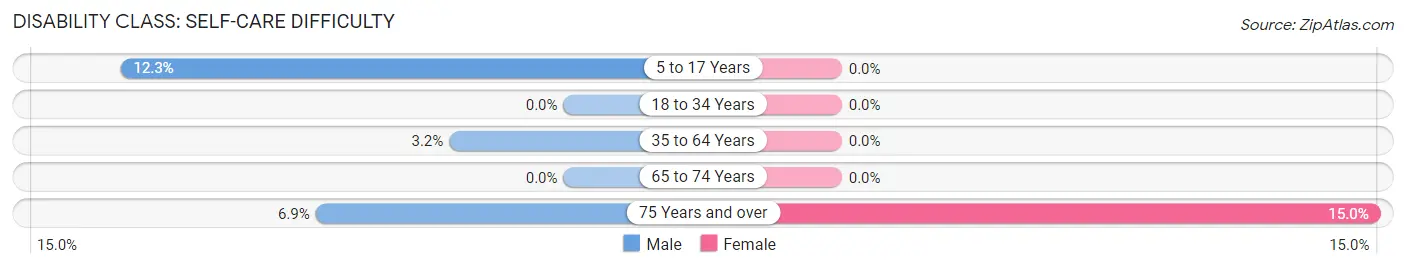
| Age Bracket | Male | Female |
| 5 to 17 Years | 9 (12.3%) | 0 (0.0%) |
| 18 to 34 Years | 0 (0.0%) | 0 (0.0%) |
| 35 to 64 Years | 5 (3.2%) | 0 (0.0%) |
| 65 to 74 Years | 0 (0.0%) | 0 (0.0%) |
| 75 Years and over | 2 (6.9%) | 3 (15.0%) |
Technology Access in Rocky Hill borough
Computing Device Access in Rocky Hill borough
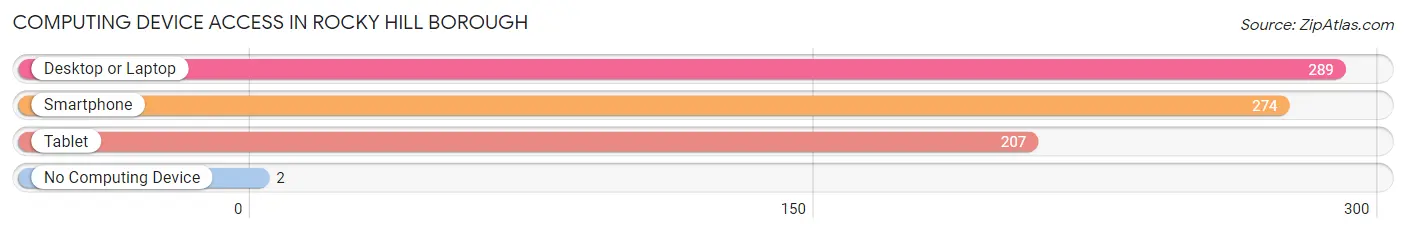
| Device Type | # Households | % Households |
| Desktop or Laptop | 289 | 98.0% |
| Smartphone | 274 | 92.9% |
| Tablet | 207 | 70.2% |
| No Computing Device | 2 | 0.7% |
| Total | 295 | 100.0% |
Internet Access in Rocky Hill borough
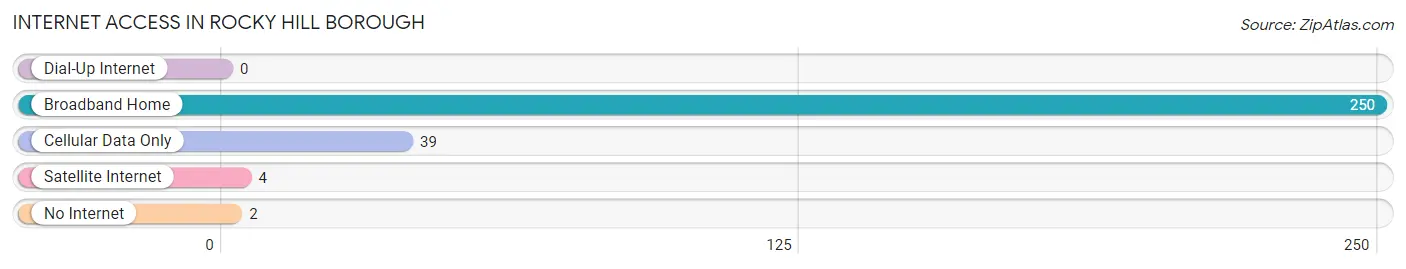
| Internet Type | # Households | % Households |
| Dial-Up Internet | 0 | 0.0% |
| Broadband Home | 250 | 84.8% |
| Cellular Data Only | 39 | 13.2% |
| Satellite Internet | 4 | 1.4% |
| No Internet | 2 | 0.7% |
| Total | 295 | 100.0% |
Rocky Hill borough Summary
Rocky Hill Borough is a small borough located in Somerset County, New Jersey. It is situated in the Raritan Valley region of Central New Jersey, and is bordered by Montgomery Township, Hillsborough Township, and Princeton Township. The borough has a total area of 1.2 square miles, all of which is land. As of the 2010 United States Census, the borough had a population of 2,137.
History
Rocky Hill Borough was incorporated in 1891 from portions of Montgomery Township. The borough was named after a hill in the area that was covered with rocks. The area was originally inhabited by the Lenape Native Americans, and was later settled by Dutch and English colonists in the 17th century. The area was primarily agricultural until the late 19th century, when it began to develop into a residential community.
Geography
Rocky Hill Borough is located in the Raritan Valley region of Central New Jersey. It is bordered by Montgomery Township to the north, Hillsborough Township to the east, and Princeton Township to the south and west. The borough has a total area of 1.2 square miles, all of which is land. The borough is located in the Sourland Mountain region, and is home to several small hills and ridges.
The borough is located in the Sourland Mountain region, and is home to several small hills and ridges. The highest point in the borough is the summit of Rocky Hill, which is located at an elevation of 545 feet above sea level. The borough is located in the Sourland Mountain region, and is home to several small hills and ridges.
Economy
The economy of Rocky Hill Borough is primarily based on small businesses and services. The borough is home to several small businesses, including restaurants, retail stores, and professional services. The borough is also home to several corporate offices, including those of Johnson & Johnson, Merck & Co., and Bristol-Myers Squibb.
Demographics
As of the 2010 United States Census, the borough had a population of 2,137. The racial makeup of the borough was 87.2% White, 5.2% African American, 0.2% Native American, 4.2% Asian, 0.1% Pacific Islander, 1.2% from other races, and 2.1% from two or more races. Hispanic or Latino of any race were 5.2% of the population.
The median income for a household in the borough was $90,917, and the median income for a family was $103,917. The per capita income for the borough was $41,917. About 2.2% of families and 3.2% of the population were below the poverty line, including 3.2% of those under age 18 and 4.2% of those age 65 or over.
Common Questions
What is Per Capita Income in Rocky Hill borough?
Per Capita income in Rocky Hill borough is $82,593.
What is the Median Family Income in Rocky Hill borough?
Median Family Income in Rocky Hill borough is $162,000.
What is the Median Household income in Rocky Hill borough?
Median Household Income in Rocky Hill borough is $126,250.
What is Income or Wage Gap in Rocky Hill borough?
Income or Wage Gap in Rocky Hill borough is 40.7%.
Women in Rocky Hill borough earn 59.3 cents for every dollar earned by a man.
What is Inequality or Gini Index in Rocky Hill borough?
Inequality or Gini Index in Rocky Hill borough is 0.52.
What is the Total Population of Rocky Hill borough?
Total Population of Rocky Hill borough is 794.
What is the Total Male Population of Rocky Hill borough?
Total Male Population of Rocky Hill borough is 431.
What is the Total Female Population of Rocky Hill borough?
Total Female Population of Rocky Hill borough is 363.
What is the Ratio of Males per 100 Females in Rocky Hill borough?
There are 118.73 Males per 100 Females in Rocky Hill borough.
What is the Ratio of Females per 100 Males in Rocky Hill borough?
There are 84.22 Females per 100 Males in Rocky Hill borough.
What is the Median Population Age in Rocky Hill borough?
Median Population Age in Rocky Hill borough is 43.4 Years.
What is the Average Family Size in Rocky Hill borough
Average Family Size in Rocky Hill borough is 3.4 People.
What is the Average Household Size in Rocky Hill borough
Average Household Size in Rocky Hill borough is 2.6 People.
How Large is the Labor Force in Rocky Hill borough?
There are 420 People in the Labor Forcein in Rocky Hill borough.
What is the Percentage of People in the Labor Force in Rocky Hill borough?
64.3% of People are in the Labor Force in Rocky Hill borough.
What is the Unemployment Rate in Rocky Hill borough?
Unemployment Rate in Rocky Hill borough is 4.8%.