Cape May Point borough, NJ Map & Demographics
Cape May Point borough Overview
$69,308
PER CAPITA INCOME
$106,750
AVG FAMILY INCOME
$82,679
AVG HOUSEHOLD INCOME
0.40
INEQUALITY / GINI INDEX
155
TOTAL POPULATION
60
MALE POPULATION
95
FEMALE POPULATION
63.16
MALES / 100 FEMALES
158.33
FEMALES / 100 MALES
71.3
MEDIAN AGE
1.8
AVG FAMILY SIZE
1.4
AVG HOUSEHOLD SIZE
50
LABOR FORCE [ PEOPLE ]
32.3%
PERCENT IN LABOR FORCE
8.0%
UNEMPLOYMENT RATE
Income in Cape May Point borough
Income Overview in Cape May Point borough
Per Capita Income in Cape May Point borough is $69,308, while median incomes of families and households are $106,750 and $82,679 respectively.
| Characteristic | Number | Measure |
| Per Capita Income | 155 | $69,308 |
| Median Family Income | 37 | $106,750 |
| Mean Family Income | 37 | $175,073 |
| Median Household Income | 85 | $82,679 |
| Mean Household Income | 85 | $121,900 |
| Income Deficit | 37 | $0 |
| Wage / Income Gap (%) | 155 | 0.00% |
| Wage / Income Gap ($) | 155 | 100.00¢ per $1 |
| Gini / Inequality Index | 155 | 0.40 |
Earnings by Sex in Cape May Point borough
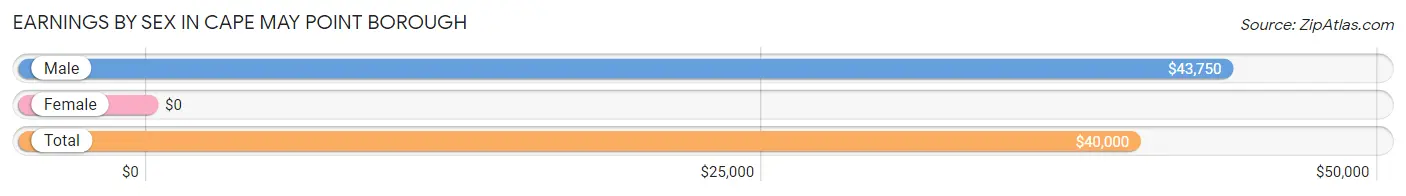
| Sex | Number | Average Earnings |
| Male | 41 (75.9%) | $43,750 |
| Female | 13 (24.1%) | $0 |
| Total | 54 (100.0%) | $40,000 |
Earnings by Sex by Income Bracket in Cape May Point borough
The most common earnings brackets in Cape May Point borough are $22,500 to $24,999 for men (9 | 22.0%) and $5,000 to $7,499 for women (4 | 30.8%).
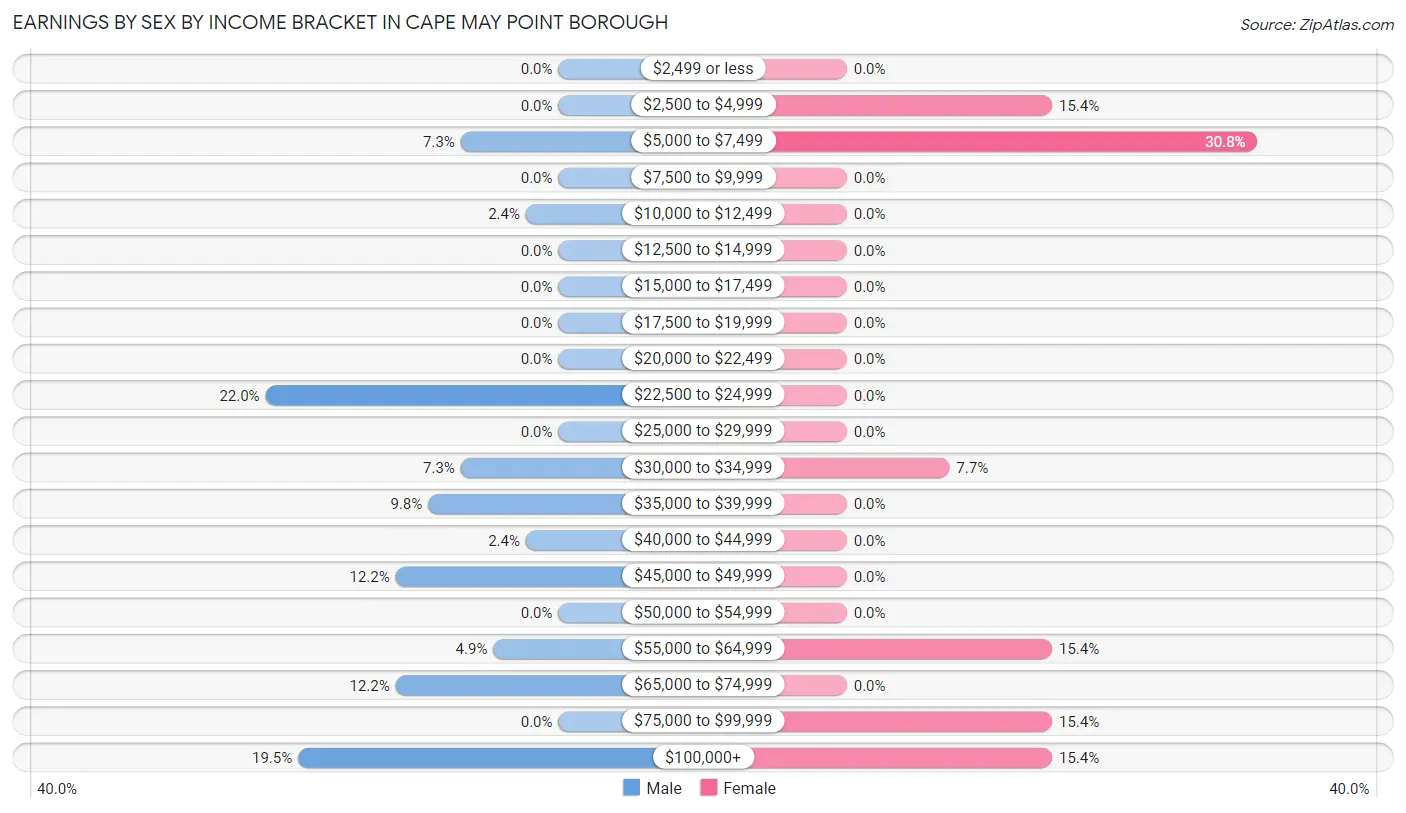
| Income | Male | Female |
| $2,499 or less | 0 (0.0%) | 0 (0.0%) |
| $2,500 to $4,999 | 0 (0.0%) | 2 (15.4%) |
| $5,000 to $7,499 | 3 (7.3%) | 4 (30.8%) |
| $7,500 to $9,999 | 0 (0.0%) | 0 (0.0%) |
| $10,000 to $12,499 | 1 (2.4%) | 0 (0.0%) |
| $12,500 to $14,999 | 0 (0.0%) | 0 (0.0%) |
| $15,000 to $17,499 | 0 (0.0%) | 0 (0.0%) |
| $17,500 to $19,999 | 0 (0.0%) | 0 (0.0%) |
| $20,000 to $22,499 | 0 (0.0%) | 0 (0.0%) |
| $22,500 to $24,999 | 9 (22.0%) | 0 (0.0%) |
| $25,000 to $29,999 | 0 (0.0%) | 0 (0.0%) |
| $30,000 to $34,999 | 3 (7.3%) | 1 (7.7%) |
| $35,000 to $39,999 | 4 (9.8%) | 0 (0.0%) |
| $40,000 to $44,999 | 1 (2.4%) | 0 (0.0%) |
| $45,000 to $49,999 | 5 (12.2%) | 0 (0.0%) |
| $50,000 to $54,999 | 0 (0.0%) | 0 (0.0%) |
| $55,000 to $64,999 | 2 (4.9%) | 2 (15.4%) |
| $65,000 to $74,999 | 5 (12.2%) | 0 (0.0%) |
| $75,000 to $99,999 | 0 (0.0%) | 2 (15.4%) |
| $100,000+ | 8 (19.5%) | 2 (15.4%) |
| Total | 41 (100.0%) | 13 (100.0%) |
Earnings by Sex by Educational Attainment in Cape May Point borough
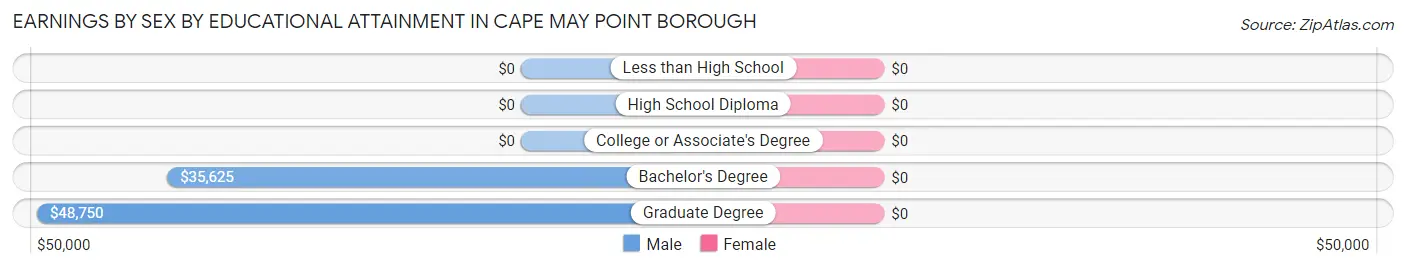
| Educational Attainment | Male Income | Female Income |
| Less than High School | - | - |
| High School Diploma | - | - |
| College or Associate's Degree | - | - |
| Bachelor's Degree | $35,625 | $0 |
| Graduate Degree | $48,750 | $0 |
| Total | $43,750 | $0 |
Family Income in Cape May Point borough
Family Income Brackets in Cape May Point borough
According to the Cape May Point borough family income data, there are 11 families falling into the $100,000 to $149,999 income range, which is the most common income bracket and makes up 29.7% of all families.
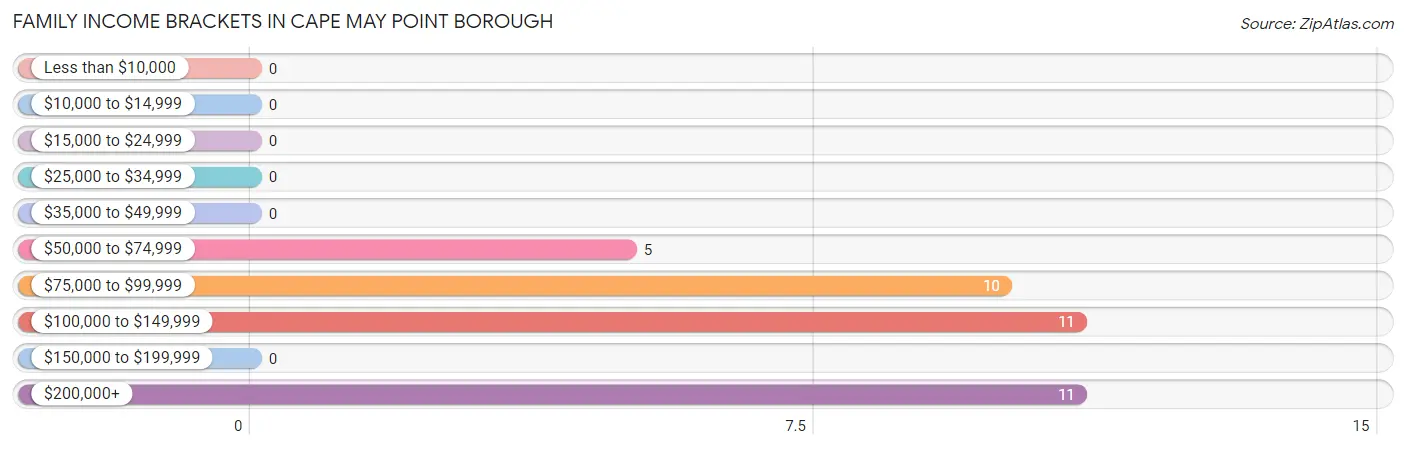
| Income Bracket | # Families | % Families |
| Less than $10,000 | 0 | 0.0% |
| $10,000 to $14,999 | 0 | 0.0% |
| $15,000 to $24,999 | 0 | 0.0% |
| $25,000 to $34,999 | 0 | 0.0% |
| $35,000 to $49,999 | 0 | 0.0% |
| $50,000 to $74,999 | 5 | 13.5% |
| $75,000 to $99,999 | 10 | 27.0% |
| $100,000 to $149,999 | 11 | 29.7% |
| $150,000 to $199,999 | 0 | 0.0% |
| $200,000+ | 11 | 29.7% |
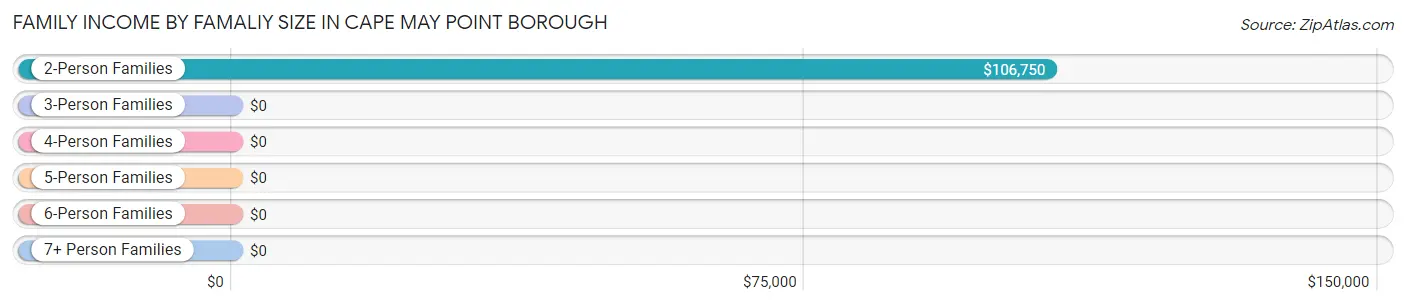
Family Income by Famaliy Size in Cape May Point borough
2-person families (37 | 100.0%) account for the highest median family income in Cape May Point borough with $106,750 per family, while 2-person families (37 | 100.0%) have the highest median income of $53,375 per family member.
| Income Bracket | # Families | Median Income |
| 2-Person Families | 37 (100.0%) | $106,750 |
| 3-Person Families | 0 (0.0%) | $0 |
| 4-Person Families | 0 (0.0%) | $0 |
| 5-Person Families | 0 (0.0%) | $0 |
| 6-Person Families | 0 (0.0%) | $0 |
| 7+ Person Families | 0 (0.0%) | $0 |
| Total | 37 (100.0%) | $106,750 |
Family Income by Number of Earners in Cape May Point borough
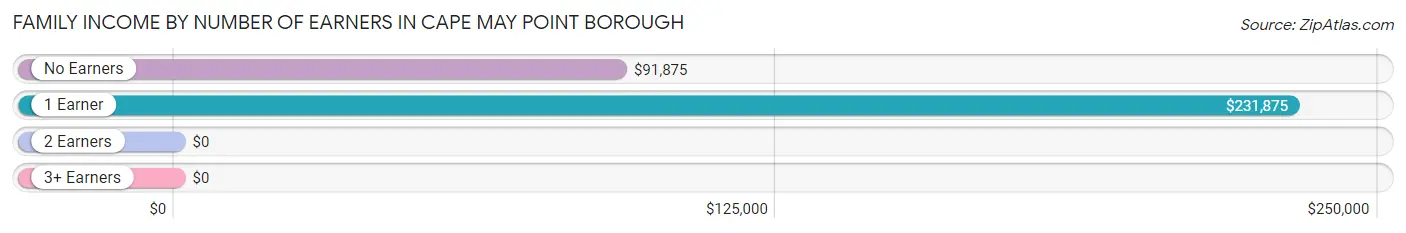
| Number of Earners | # Families | Median Income |
| No Earners | 15 (40.5%) | $91,875 |
| 1 Earner | 13 (35.1%) | $231,875 |
| 2 Earners | 9 (24.3%) | $0 |
| 3+ Earners | 0 (0.0%) | $0 |
| Total | 37 (100.0%) | $106,750 |
Household Income in Cape May Point borough
Household Income Brackets in Cape May Point borough
With 36 households falling in the category, the $75,000 to $99,999 income range is the most frequent in Cape May Point borough, accounting for 42.3% of all households.
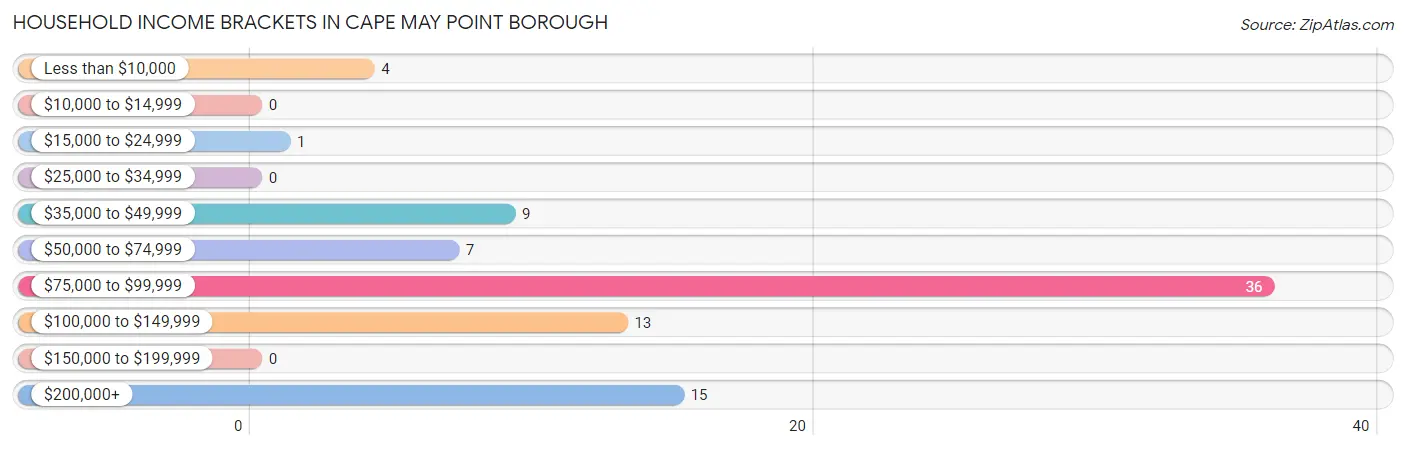
| Income Bracket | # Households | % Households |
| Less than $10,000 | 4 | 4.7% |
| $10,000 to $14,999 | 0 | 0.0% |
| $15,000 to $24,999 | 1 | 1.2% |
| $25,000 to $34,999 | 0 | 0.0% |
| $35,000 to $49,999 | 9 | 10.6% |
| $50,000 to $74,999 | 7 | 8.2% |
| $75,000 to $99,999 | 36 | 42.4% |
| $100,000 to $149,999 | 13 | 15.3% |
| $150,000 to $199,999 | 0 | 0.0% |
| $200,000+ | 15 | 17.6% |
Household Income by Householder Age in Cape May Point borough
The median household income in Cape May Point borough is $82,679, with the highest median household income of $83,036 found in the 65+ years age bracket for the primary householder. A total of 69 households (81.2%) fall into this category.
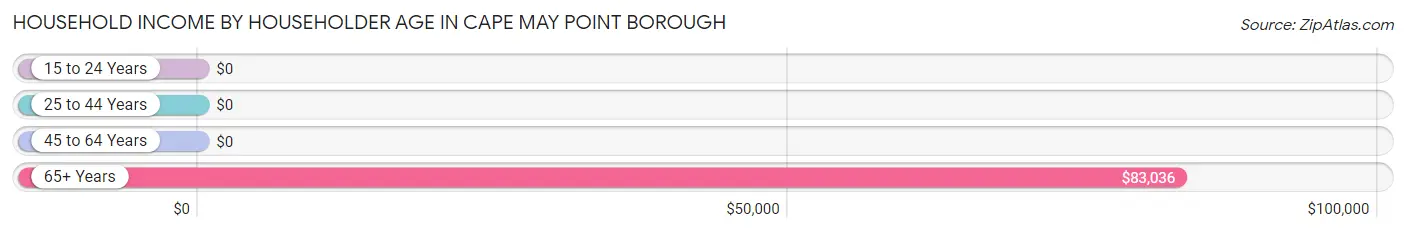
| Income Bracket | # Households | Median Income |
| 15 to 24 Years | 0 (0.0%) | $0 |
| 25 to 44 Years | 0 (0.0%) | $0 |
| 45 to 64 Years | 16 (18.8%) | $0 |
| 65+ Years | 69 (81.2%) | $83,036 |
| Total | 85 (100.0%) | $82,679 |
Poverty in Cape May Point borough
Income Below Poverty by Sex and Age in Cape May Point borough
With 6.7% poverty level for males and 23.2% for females among the residents of Cape May Point borough, 55 to 64 year old males and 75 year old and over females are the most vulnerable to poverty, with 4 males (15.4%) and 14 females (29.8%) in their respective age groups living below the poverty level.
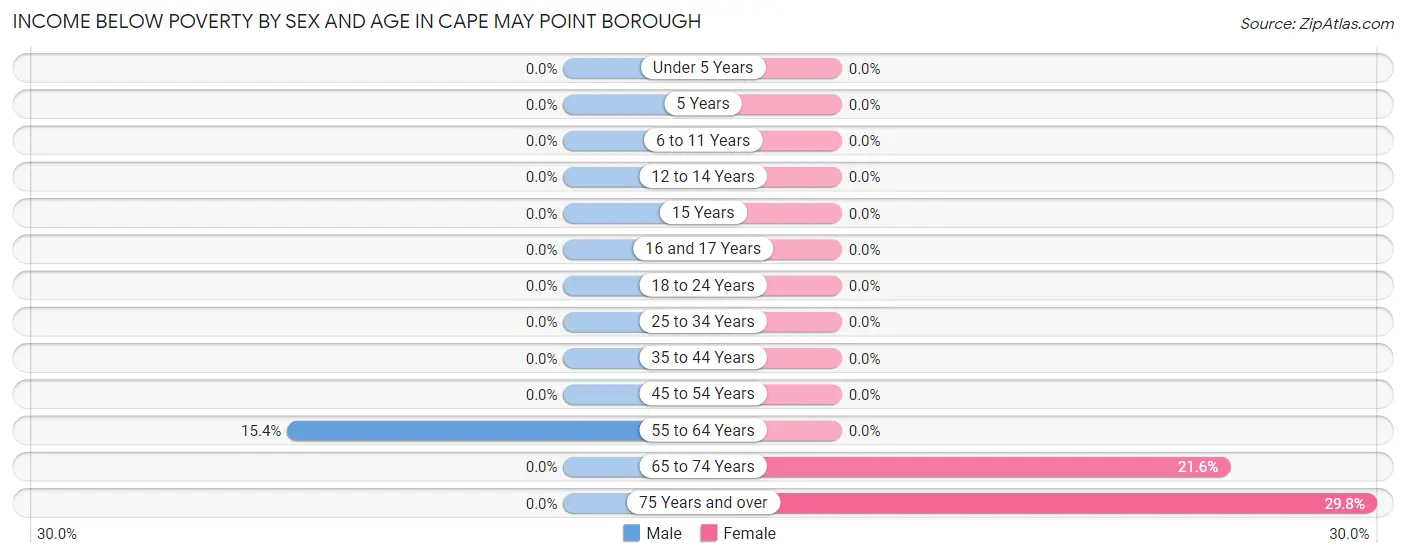
| Age Bracket | Male | Female |
| Under 5 Years | 0 (0.0%) | 0 (0.0%) |
| 5 Years | 0 (0.0%) | 0 (0.0%) |
| 6 to 11 Years | 0 (0.0%) | 0 (0.0%) |
| 12 to 14 Years | 0 (0.0%) | 0 (0.0%) |
| 15 Years | 0 (0.0%) | 0 (0.0%) |
| 16 and 17 Years | 0 (0.0%) | 0 (0.0%) |
| 18 to 24 Years | 0 (0.0%) | 0 (0.0%) |
| 25 to 34 Years | 0 (0.0%) | 0 (0.0%) |
| 35 to 44 Years | 0 (0.0%) | 0 (0.0%) |
| 45 to 54 Years | 0 (0.0%) | 0 (0.0%) |
| 55 to 64 Years | 4 (15.4%) | 0 (0.0%) |
| 65 to 74 Years | 0 (0.0%) | 8 (21.6%) |
| 75 Years and over | 0 (0.0%) | 14 (29.8%) |
| Total | 4 (6.7%) | 22 (23.2%) |
Income Above Poverty by Sex and Age in Cape May Point borough
According to the poverty statistics in Cape May Point borough, males aged 65 to 74 years and females aged 55 to 64 years are the age groups that are most secure financially, with 100.0% of males and 100.0% of females in these age groups living above the poverty line.
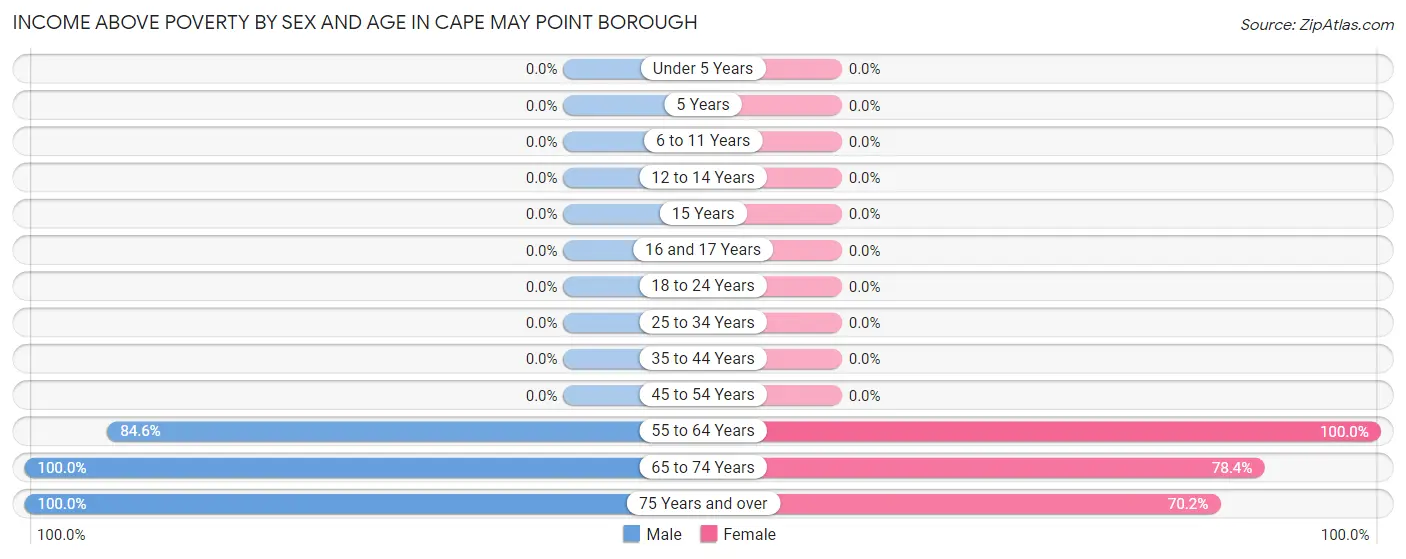
| Age Bracket | Male | Female |
| Under 5 Years | 0 (0.0%) | 0 (0.0%) |
| 5 Years | 0 (0.0%) | 0 (0.0%) |
| 6 to 11 Years | 0 (0.0%) | 0 (0.0%) |
| 12 to 14 Years | 0 (0.0%) | 0 (0.0%) |
| 15 Years | 0 (0.0%) | 0 (0.0%) |
| 16 and 17 Years | 0 (0.0%) | 0 (0.0%) |
| 18 to 24 Years | 0 (0.0%) | 0 (0.0%) |
| 25 to 34 Years | 0 (0.0%) | 0 (0.0%) |
| 35 to 44 Years | 0 (0.0%) | 0 (0.0%) |
| 45 to 54 Years | 0 (0.0%) | 0 (0.0%) |
| 55 to 64 Years | 22 (84.6%) | 11 (100.0%) |
| 65 to 74 Years | 22 (100.0%) | 29 (78.4%) |
| 75 Years and over | 12 (100.0%) | 33 (70.2%) |
| Total | 56 (93.3%) | 73 (76.8%) |
Income Below Poverty Among Married-Couple Families in Cape May Point borough
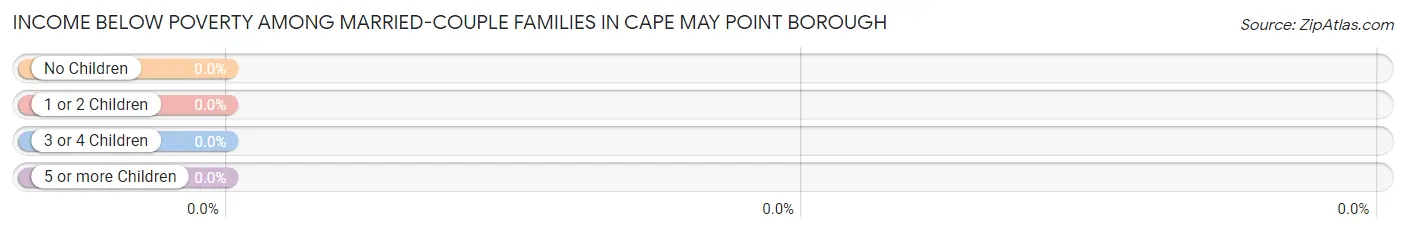
| Children | Above Poverty | Below Poverty |
| No Children | 29 (100.0%) | 0 (0.0%) |
| 1 or 2 Children | 0 (0.0%) | 0 (0.0%) |
| 3 or 4 Children | 0 (0.0%) | 0 (0.0%) |
| 5 or more Children | 0 (0.0%) | 0 (0.0%) |
| Total | 29 (100.0%) | 0 (0.0%) |
Income Below Poverty Among Single-Parent Households in Cape May Point borough
| Children | Single Father | Single Mother |
| No Children | 0 (0.0%) | 0 (0.0%) |
| 1 or 2 Children | 0 (0.0%) | 0 (0.0%) |
| 3 or 4 Children | 0 (0.0%) | 0 (0.0%) |
| 5 or more Children | 0 (0.0%) | 0 (0.0%) |
| Total | 0 (0.0%) | 0 (0.0%) |
Income Below Poverty Among Married-Couple vs Single-Parent Households in Cape May Point borough
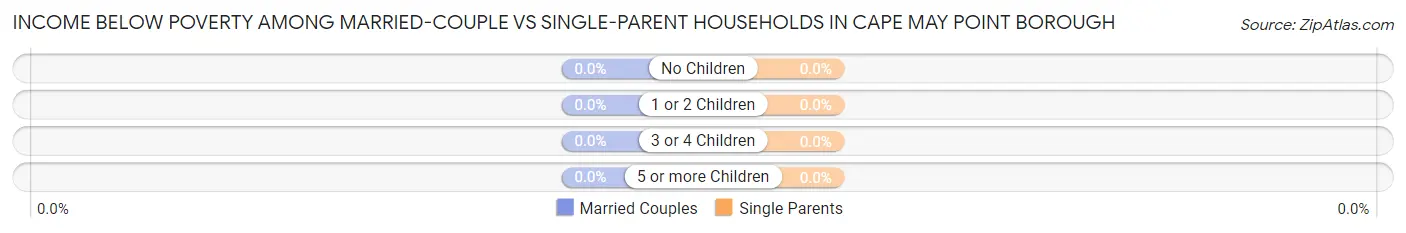
| Children | Married-Couple Families | Single-Parent Households |
| No Children | 0 (0.0%) | 0 (0.0%) |
| 1 or 2 Children | 0 (0.0%) | 0 (0.0%) |
| 3 or 4 Children | 0 (0.0%) | 0 (0.0%) |
| 5 or more Children | 0 (0.0%) | 0 (0.0%) |
| Total | 0 (0.0%) | 0 (0.0%) |
Race in Cape May Point borough
The most populous races in Cape May Point borough are White / Caucasian (146 | 94.2%), Black / African American (6 | 3.9%), and Asian (3 | 1.9%).
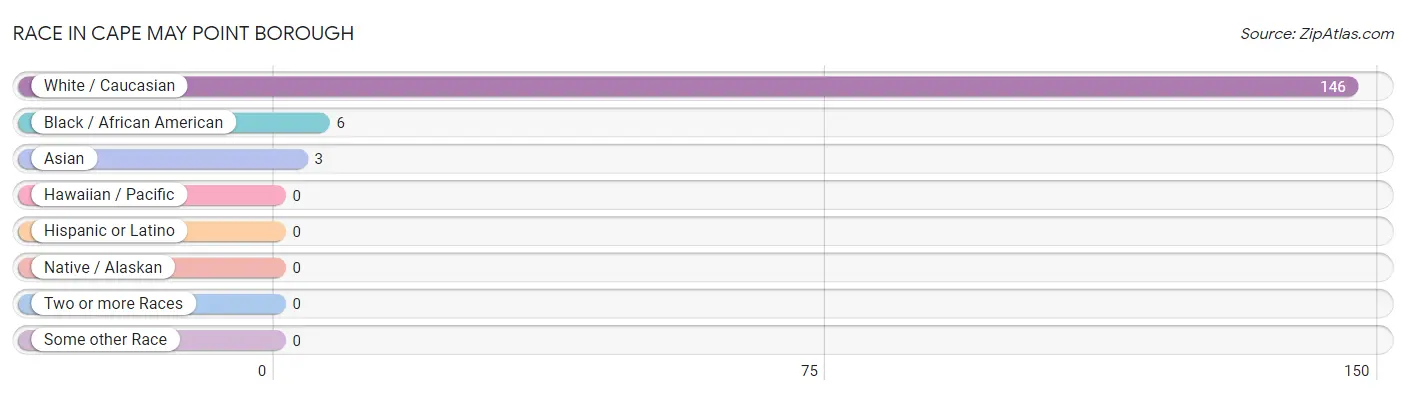
| Race | # Population | % Population |
| Asian | 3 | 1.9% |
| Black / African American | 6 | 3.9% |
| Hawaiian / Pacific | 0 | 0.0% |
| Hispanic or Latino | 0 | 0.0% |
| Native / Alaskan | 0 | 0.0% |
| White / Caucasian | 146 | 94.2% |
| Two or more Races | 0 | 0.0% |
| Some other Race | 0 | 0.0% |
| Total | 155 | 100.0% |
Ancestry in Cape May Point borough
The most populous ancestries reported in Cape May Point borough are English (47 | 30.3%), Irish (43 | 27.7%), Polish (42 | 27.1%), French (26 | 16.8%), and German (16 | 10.3%), together accounting for 112.3% of all Cape May Point borough residents.
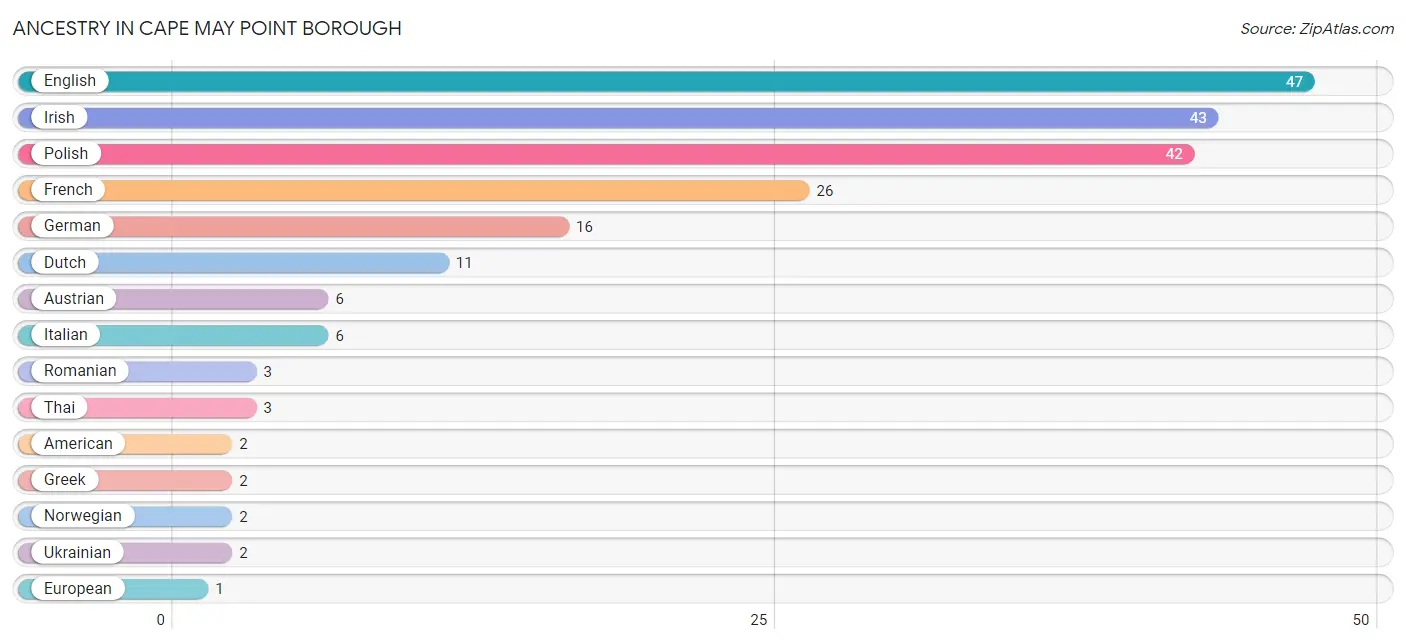
| Ancestry | # Population | % Population |
| American | 2 | 1.3% |
| Austrian | 6 | 3.9% |
| Dutch | 11 | 7.1% |
| English | 47 | 30.3% |
| European | 1 | 0.6% |
| French | 26 | 16.8% |
| German | 16 | 10.3% |
| Greek | 2 | 1.3% |
| Irish | 43 | 27.7% |
| Italian | 6 | 3.9% |
| Norwegian | 2 | 1.3% |
| Polish | 42 | 27.1% |
| Romanian | 3 | 1.9% |
| Russian | 1 | 0.6% |
| Thai | 3 | 1.9% |
| Ukrainian | 2 | 1.3% | View All 16 Rows |
Immigrants in Cape May Point borough
The most numerous immigrant groups reported in Cape May Point borough came from Eastern Europe (9 | 5.8%), Europe (9 | 5.8%), Poland (9 | 5.8%), Asia (3 | 1.9%), and India (3 | 1.9%), together accounting for 21.3% of all Cape May Point borough residents.
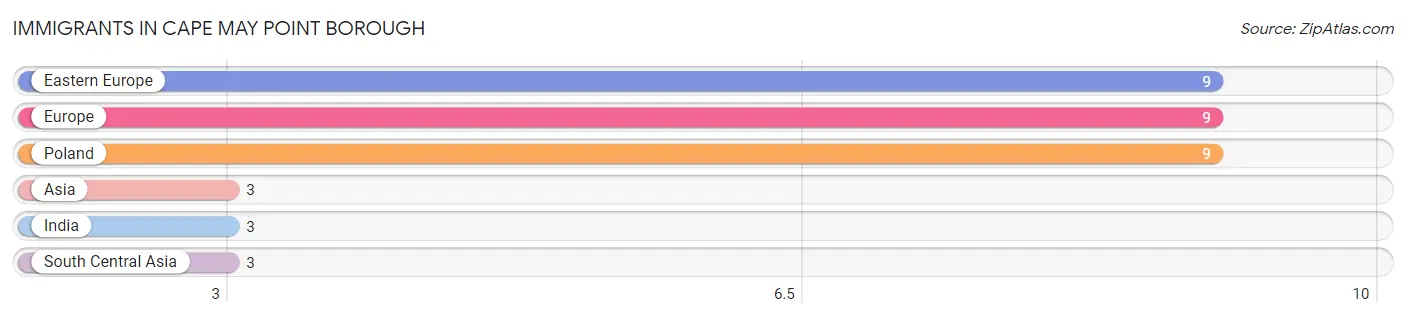
| Immigration Origin | # Population | % Population |
| Asia | 3 | 1.9% |
| Eastern Europe | 9 | 5.8% |
| Europe | 9 | 5.8% |
| India | 3 | 1.9% |
| Poland | 9 | 5.8% |
| South Central Asia | 3 | 1.9% | View All 6 Rows |
Sex and Age in Cape May Point borough
Sex and Age in Cape May Point borough
The most populous age groups in Cape May Point borough are 60 to 64 Years (20 | 33.3%) for men and 85 Years and over (29 | 30.5%) for women.
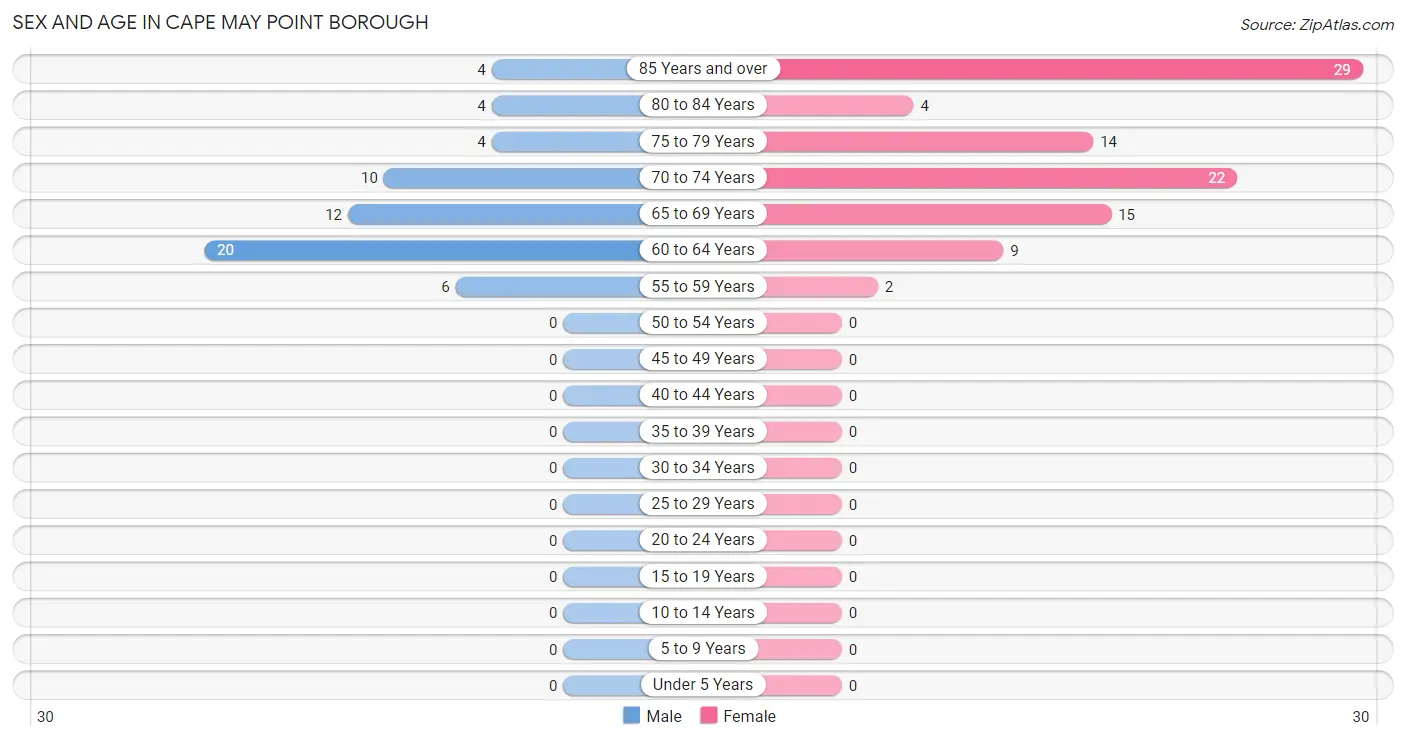
| Age Bracket | Male | Female |
| Under 5 Years | 0 (0.0%) | 0 (0.0%) |
| 5 to 9 Years | 0 (0.0%) | 0 (0.0%) |
| 10 to 14 Years | 0 (0.0%) | 0 (0.0%) |
| 15 to 19 Years | 0 (0.0%) | 0 (0.0%) |
| 20 to 24 Years | 0 (0.0%) | 0 (0.0%) |
| 25 to 29 Years | 0 (0.0%) | 0 (0.0%) |
| 30 to 34 Years | 0 (0.0%) | 0 (0.0%) |
| 35 to 39 Years | 0 (0.0%) | 0 (0.0%) |
| 40 to 44 Years | 0 (0.0%) | 0 (0.0%) |
| 45 to 49 Years | 0 (0.0%) | 0 (0.0%) |
| 50 to 54 Years | 0 (0.0%) | 0 (0.0%) |
| 55 to 59 Years | 6 (10.0%) | 2 (2.1%) |
| 60 to 64 Years | 20 (33.3%) | 9 (9.5%) |
| 65 to 69 Years | 12 (20.0%) | 15 (15.8%) |
| 70 to 74 Years | 10 (16.7%) | 22 (23.2%) |
| 75 to 79 Years | 4 (6.7%) | 14 (14.7%) |
| 80 to 84 Years | 4 (6.7%) | 4 (4.2%) |
| 85 Years and over | 4 (6.7%) | 29 (30.5%) |
| Total | 60 (100.0%) | 95 (100.0%) |
Families and Households in Cape May Point borough
Median Family Size in Cape May Point borough
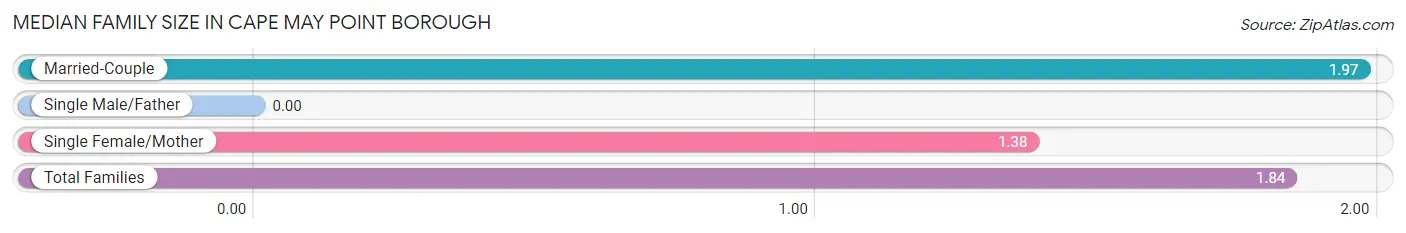
| Family Type | # Families | Family Size |
| Married-Couple | 29 (78.4%) | 1.97 |
| Single Male/Father | 0 (0.0%) | - |
| Single Female/Mother | 8 (21.6%) | 1.38 |
| Total Families | 37 (100.0%) | 1.84 |
Median Household Size in Cape May Point borough
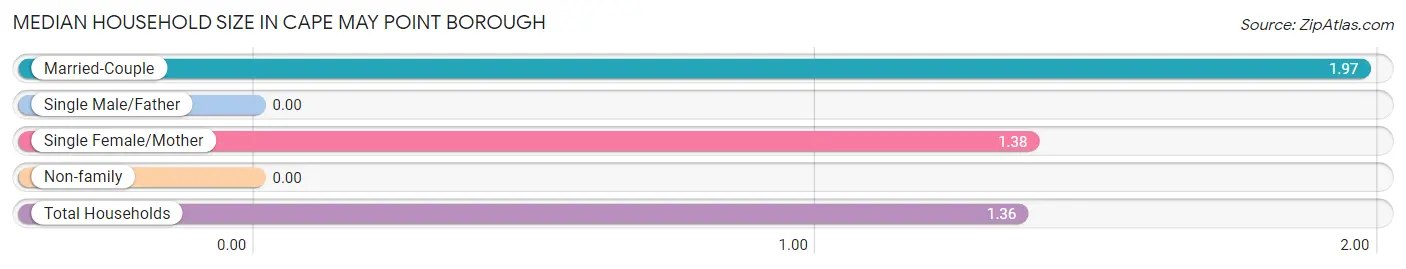
| Household Type | # Households | Household Size |
| Married-Couple | 29 (34.1%) | 1.97 |
| Single Male/Father | 0 (0.0%) | - |
| Single Female/Mother | 8 (9.4%) | 1.38 |
| Non-family | 48 (56.5%) | - |
| Total Households | 85 (100.0%) | 1.36 |
Household Size by Marriage Status in Cape May Point borough
Out of a total of 85 households in Cape May Point borough, 37 (43.5%) are family households, while 48 (56.5%) are nonfamily households. The most numerous type of family households are 2-person households, comprising 37, and the most common type of nonfamily households are 1-person households, comprising 48.
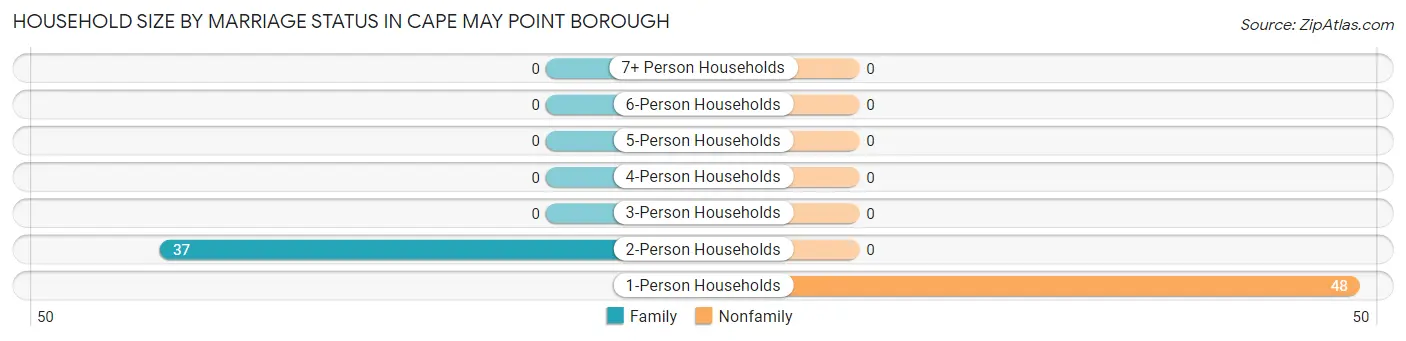
| Household Size | Family Households | Nonfamily Households |
| 1-Person Households | - | 48 (56.5%) |
| 2-Person Households | 37 (43.5%) | 0 (0.0%) |
| 3-Person Households | 0 (0.0%) | 0 (0.0%) |
| 4-Person Households | 0 (0.0%) | 0 (0.0%) |
| 5-Person Households | 0 (0.0%) | 0 (0.0%) |
| 6-Person Households | 0 (0.0%) | 0 (0.0%) |
| 7+ Person Households | 0 (0.0%) | 0 (0.0%) |
| Total | 37 (43.5%) | 48 (56.5%) |
Female Fertility in Cape May Point borough
Fertility by Age in Cape May Point borough
| Age Bracket | Women with Births | Births / 1,000 Women |
| 15 to 19 years | 0 (0.0%) | 0.0 |
| 20 to 34 years | 0 (0.0%) | 0.0 |
| 35 to 50 years | 0 (0.0%) | 0.0 |
| Total | 0 (0.0%) | 0.0 |
Fertility by Age by Marriage Status in Cape May Point borough
| Age Bracket | Married | Unmarried |
| 15 to 19 years | 0 (0.0%) | 0 (0.0%) |
| 20 to 34 years | 0 (0.0%) | 0 (0.0%) |
| 35 to 50 years | 0 (0.0%) | 0 (0.0%) |
| Total | 0 (0.0%) | 0 (0.0%) |
Fertility by Education in Cape May Point borough
| Educational Attainment | Women with Births | Births / 1,000 Women |
| Less than High School | 0 (0.0%) | 0.0 |
| High School Diploma | 0 (0.0%) | 0.0 |
| College or Associate's Degree | 0 (0.0%) | 0.0 |
| Bachelor's Degree | 0 (0.0%) | 0.0 |
| Graduate Degree | 0 (0.0%) | 0.0 |
| Total | 0 (0.0%) | 0.0 |
Fertility by Education by Marriage Status in Cape May Point borough
| Educational Attainment | Married | Unmarried |
| Less than High School | 0 (0.0%) | 0 (0.0%) |
| High School Diploma | 0 (0.0%) | 0 (0.0%) |
| College or Associate's Degree | 0 (0.0%) | 0 (0.0%) |
| Bachelor's Degree | 0 (0.0%) | 0 (0.0%) |
| Graduate Degree | 0 (0.0%) | 0 (0.0%) |
| Total | 0 (0.0%) | 0 (0.0%) |
Employment Characteristics in Cape May Point borough
Employment by Class of Employer in Cape May Point borough
Among the 46 employed individuals in Cape May Point borough, private company employees (16 | 34.8%), self-employed (not incorporated) (9 | 19.6%), and not-for-profit organizations (8 | 17.4%) make up the most common classes of employment.
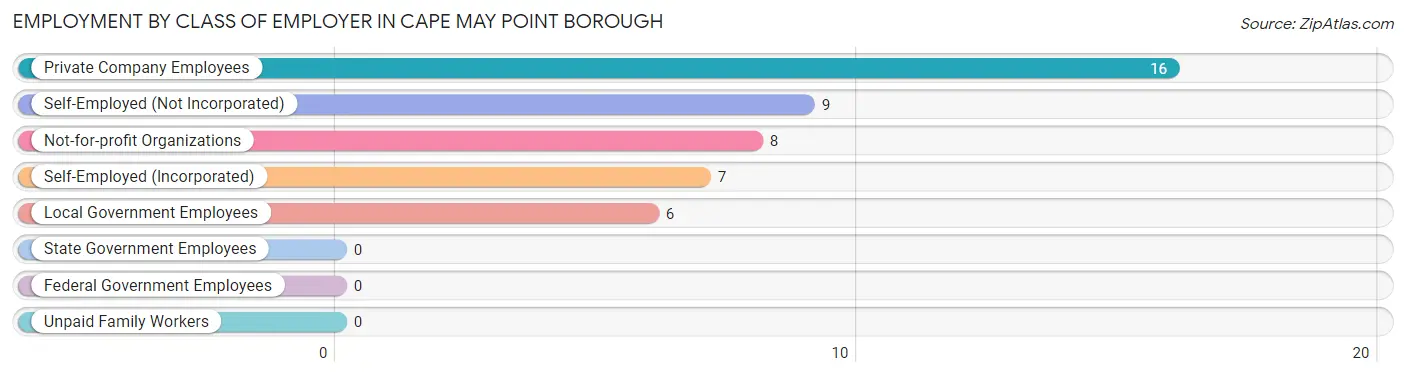
| Employer Class | # Employees | % Employees |
| Private Company Employees | 16 | 34.8% |
| Self-Employed (Incorporated) | 7 | 15.2% |
| Self-Employed (Not Incorporated) | 9 | 19.6% |
| Not-for-profit Organizations | 8 | 17.4% |
| Local Government Employees | 6 | 13.0% |
| State Government Employees | 0 | 0.0% |
| Federal Government Employees | 0 | 0.0% |
| Unpaid Family Workers | 0 | 0.0% |
| Total | 46 | 100.0% |
Employment Status by Age in Cape May Point borough
According to the labor force statistics for Cape May Point borough, out of the total population over 16 years of age (155), 32.3% or 50 individuals are in the labor force, with 8.0% or 4 of them unemployed. The age group with the highest labor force participation rate is 60 to 64 years, with 79.3% or 23 individuals in the labor force. Within the labor force, the 65 to 74 years age range has the highest percentage of unemployed individuals, with 17.4% or 4 of them being unemployed.
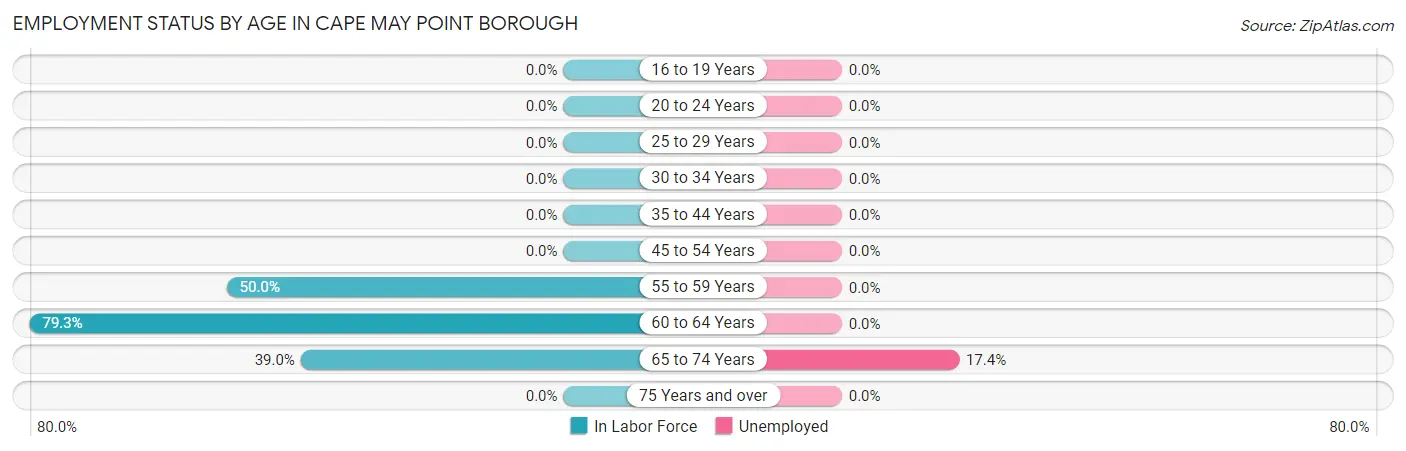
| Age Bracket | In Labor Force | Unemployed |
| 16 to 19 Years | 0 (0.0%) | 0 (0.0%) |
| 20 to 24 Years | 0 (0.0%) | 0 (0.0%) |
| 25 to 29 Years | 0 (0.0%) | 0 (0.0%) |
| 30 to 34 Years | 0 (0.0%) | 0 (0.0%) |
| 35 to 44 Years | 0 (0.0%) | 0 (0.0%) |
| 45 to 54 Years | 0 (0.0%) | 0 (0.0%) |
| 55 to 59 Years | 4 (50.0%) | 0 (0.0%) |
| 60 to 64 Years | 23 (79.3%) | 0 (0.0%) |
| 65 to 74 Years | 23 (39.0%) | 4 (17.4%) |
| 75 Years and over | 0 (0.0%) | 0 (0.0%) |
| Total | 50 (32.3%) | 4 (8.0%) |
Employment Status by Educational Attainment in Cape May Point borough
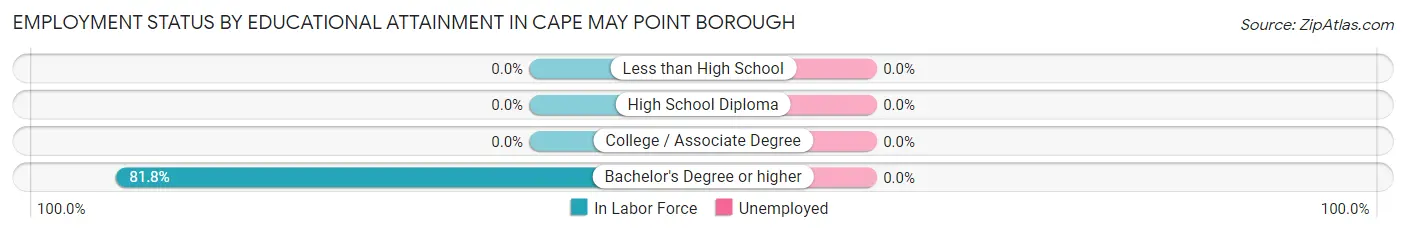
| Educational Attainment | In Labor Force | Unemployed |
| Less than High School | 0 (0.0%) | 0 (0.0%) |
| High School Diploma | 0 (0.0%) | 0 (0.0%) |
| College / Associate Degree | 0 (0.0%) | 0 (0.0%) |
| Bachelor's Degree or higher | 27 (81.8%) | 0 (0.0%) |
| Total | 27 (73.0%) | 0 (0.0%) |
Employment Occupations by Sex in Cape May Point borough
Management, Business, Science and Arts Occupations
The most common Management, Business, Science and Arts occupations in Cape May Point borough are Community & Social Service (20 | 43.5%), Education, Arts & Media (19 | 41.3%), Management (8 | 17.4%), Health Diagnosing & Treating (5 | 10.9%), and Health Technologists (5 | 10.9%).
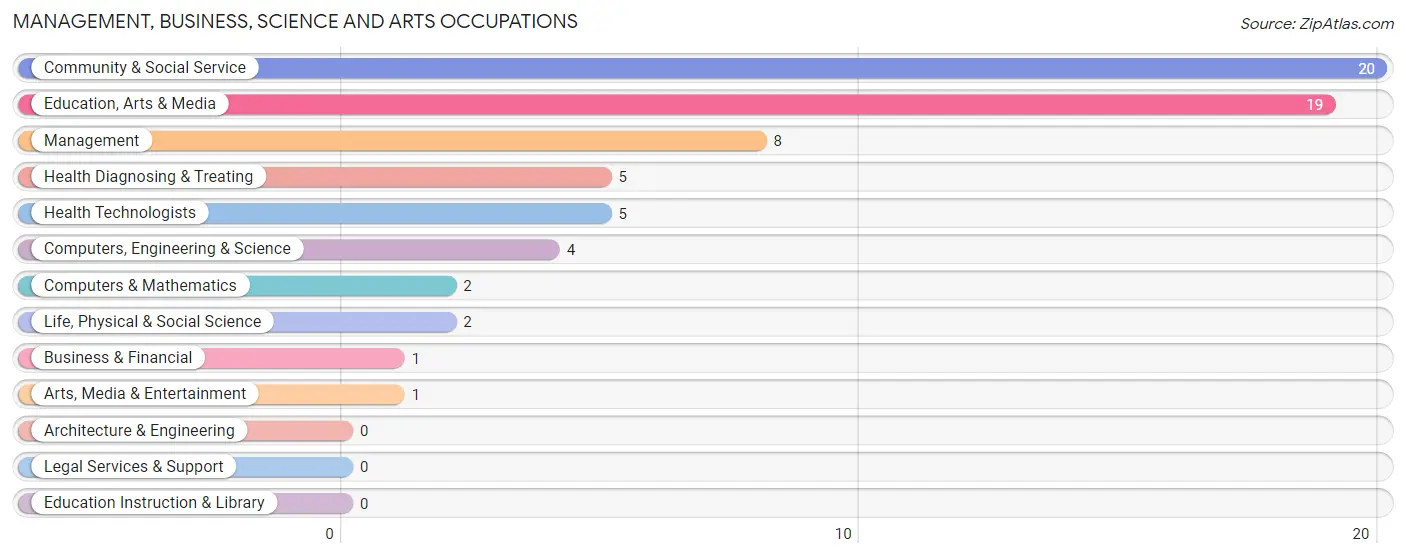
Management, Business, Science and Arts Occupations by Sex
Within the Management, Business, Science and Arts occupations in Cape May Point borough, the most male-oriented occupations are Business & Financial (100.0%), Computers, Engineering & Science (100.0%), and Computers & Mathematics (100.0%), while the most female-oriented occupations are Arts, Media & Entertainment (100.0%), Health Diagnosing & Treating (40.0%), and Health Technologists (40.0%).
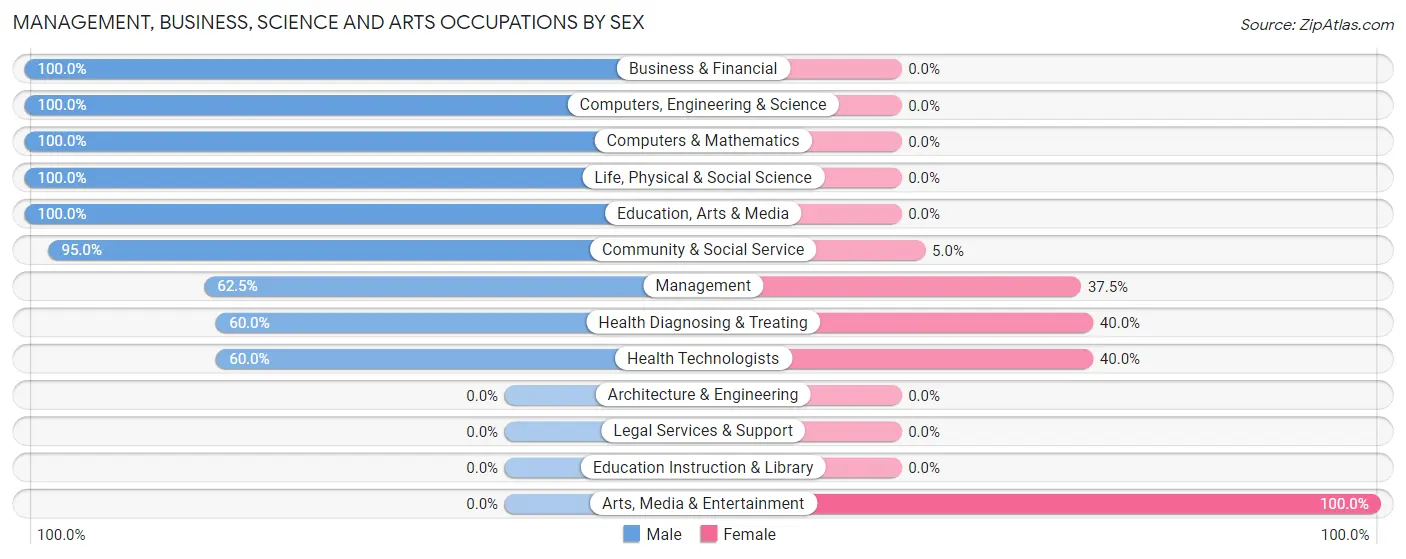
| Occupation | Male | Female |
| Management | 5 (62.5%) | 3 (37.5%) |
| Business & Financial | 1 (100.0%) | 0 (0.0%) |
| Computers, Engineering & Science | 4 (100.0%) | 0 (0.0%) |
| Computers & Mathematics | 2 (100.0%) | 0 (0.0%) |
| Architecture & Engineering | 0 (0.0%) | 0 (0.0%) |
| Life, Physical & Social Science | 2 (100.0%) | 0 (0.0%) |
| Community & Social Service | 19 (95.0%) | 1 (5.0%) |
| Education, Arts & Media | 19 (100.0%) | 0 (0.0%) |
| Legal Services & Support | 0 (0.0%) | 0 (0.0%) |
| Education Instruction & Library | 0 (0.0%) | 0 (0.0%) |
| Arts, Media & Entertainment | 0 (0.0%) | 1 (100.0%) |
| Health Diagnosing & Treating | 3 (60.0%) | 2 (40.0%) |
| Health Technologists | 3 (60.0%) | 2 (40.0%) |
| Total (Category) | 32 (84.2%) | 6 (15.8%) |
| Total (Overall) | 40 (87.0%) | 6 (13.0%) |
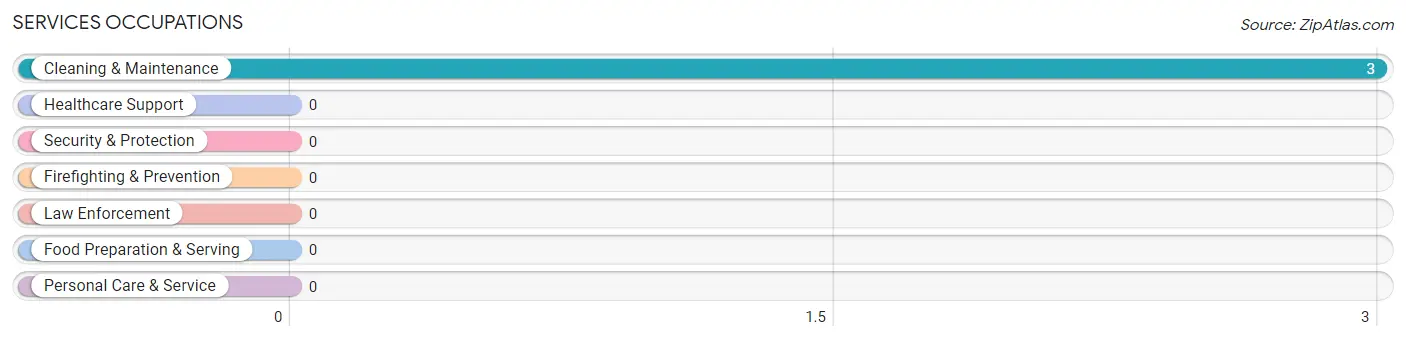
Services Occupations
The most common Services occupations in Cape May Point borough are , and Cleaning & Maintenance (3 | 6.5%).
Services Occupations by Sex
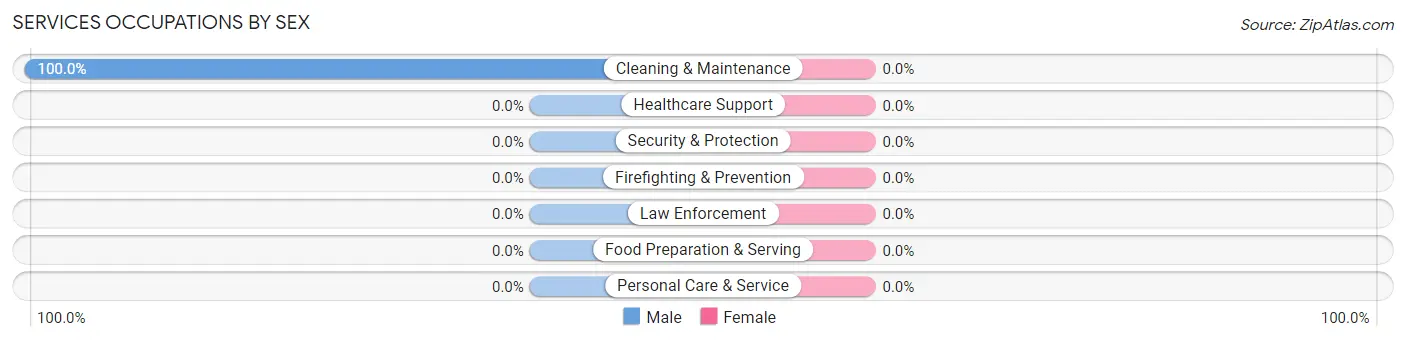
| Occupation | Male | Female |
| Healthcare Support | 0 (0.0%) | 0 (0.0%) |
| Security & Protection | 0 (0.0%) | 0 (0.0%) |
| Firefighting & Prevention | 0 (0.0%) | 0 (0.0%) |
| Law Enforcement | 0 (0.0%) | 0 (0.0%) |
| Food Preparation & Serving | 0 (0.0%) | 0 (0.0%) |
| Cleaning & Maintenance | 3 (100.0%) | 0 (0.0%) |
| Personal Care & Service | 0 (0.0%) | 0 (0.0%) |
| Total (Category) | 3 (100.0%) | 0 (0.0%) |
| Total (Overall) | 40 (87.0%) | 6 (13.0%) |
Sales and Office Occupations
The most common Sales and Office occupations in Cape May Point borough are , and Sales & Related (3 | 6.5%).
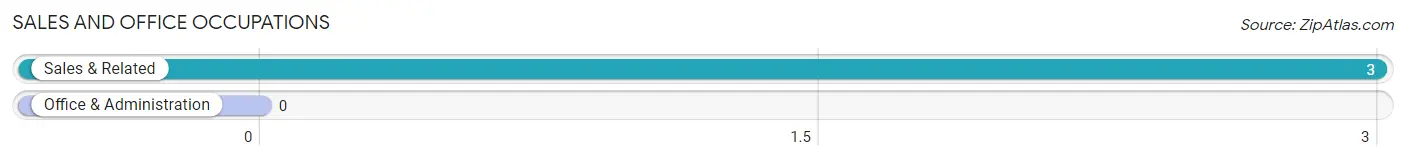
Sales and Office Occupations by Sex
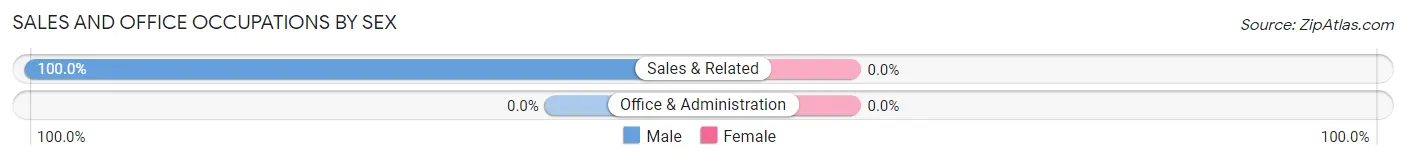
| Occupation | Male | Female |
| Sales & Related | 3 (100.0%) | 0 (0.0%) |
| Office & Administration | 0 (0.0%) | 0 (0.0%) |
| Total (Category) | 3 (100.0%) | 0 (0.0%) |
| Total (Overall) | 40 (87.0%) | 6 (13.0%) |
Natural Resources, Construction and Maintenance Occupations
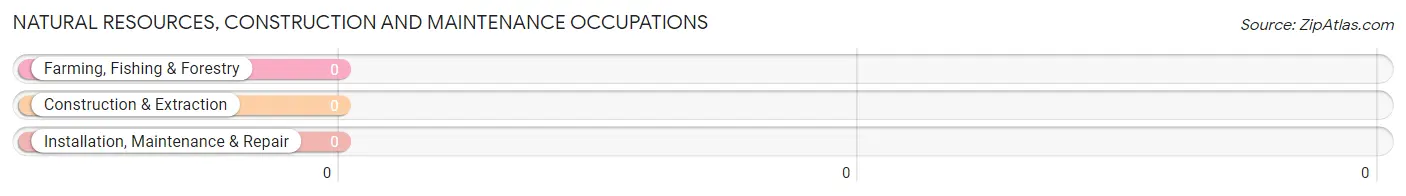
Natural Resources, Construction and Maintenance Occupations by Sex
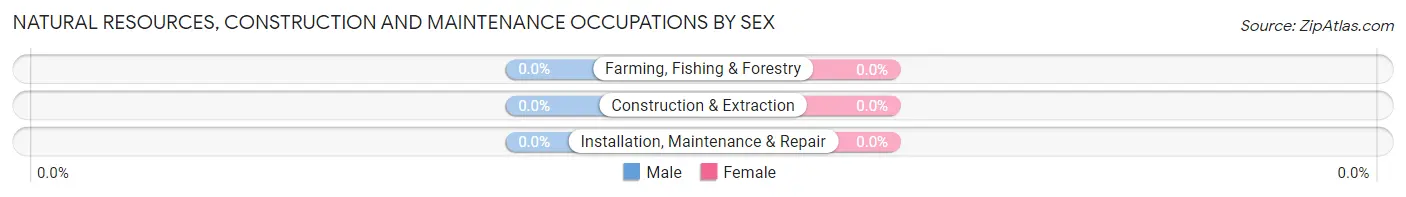
| Occupation | Male | Female |
| Farming, Fishing & Forestry | 0 (0.0%) | 0 (0.0%) |
| Construction & Extraction | 0 (0.0%) | 0 (0.0%) |
| Installation, Maintenance & Repair | 0 (0.0%) | 0 (0.0%) |
| Total (Category) | 0 (0.0%) | 0 (0.0%) |
| Total (Overall) | 40 (87.0%) | 6 (13.0%) |
Production, Transportation and Moving Occupations
The most common Production, Transportation and Moving occupations in Cape May Point borough are , and Material Moving (2 | 4.3%).
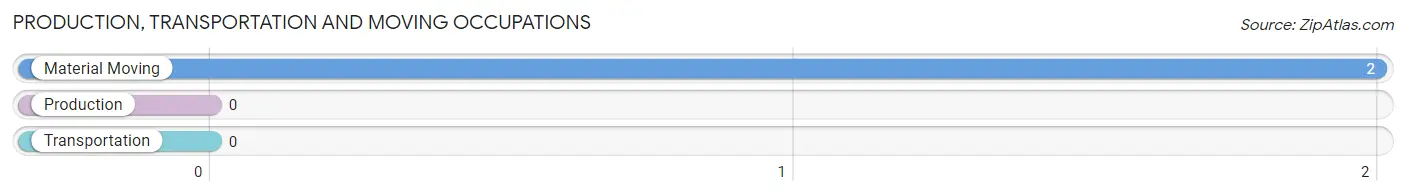
Production, Transportation and Moving Occupations by Sex
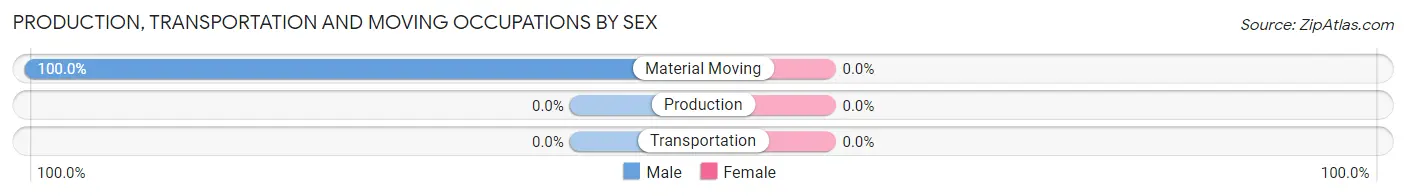
| Occupation | Male | Female |
| Production | 0 (0.0%) | 0 (0.0%) |
| Transportation | 0 (0.0%) | 0 (0.0%) |
| Material Moving | 2 (100.0%) | 0 (0.0%) |
| Total (Category) | 2 (100.0%) | 0 (0.0%) |
| Total (Overall) | 40 (87.0%) | 6 (13.0%) |
Employment Industries by Sex in Cape May Point borough
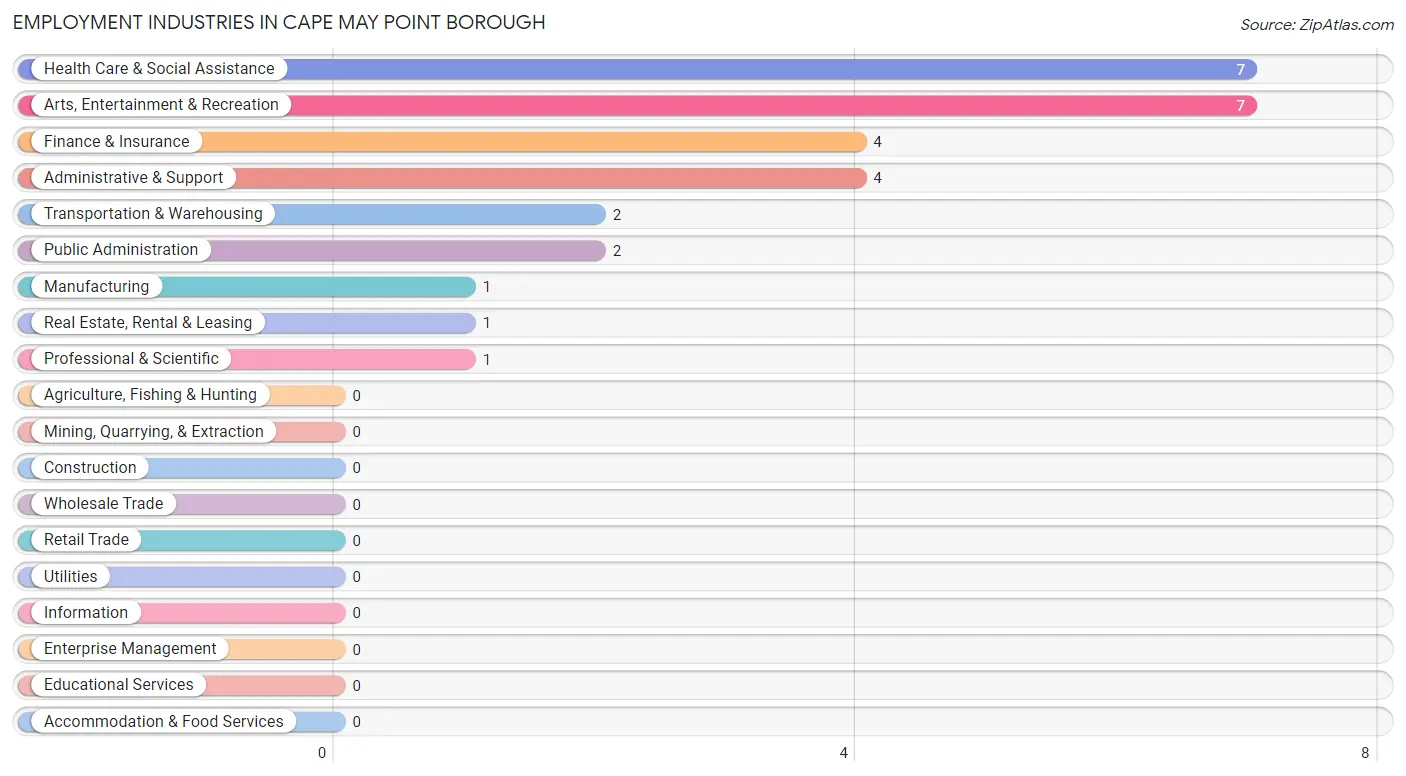
Employment Industries in Cape May Point borough
The major employment industries in Cape May Point borough include Health Care & Social Assistance (7 | 15.2%), Arts, Entertainment & Recreation (7 | 15.2%), Finance & Insurance (4 | 8.7%), Administrative & Support (4 | 8.7%), and Transportation & Warehousing (2 | 4.3%).
Employment Industries by Sex in Cape May Point borough
The Cape May Point borough industries that see more men than women are Transportation & Warehousing (100.0%), Real Estate, Rental & Leasing (100.0%), and Professional & Scientific (100.0%), whereas the industries that tend to have a higher number of women are Manufacturing (100.0%), Public Administration (100.0%), and Health Care & Social Assistance (28.6%).
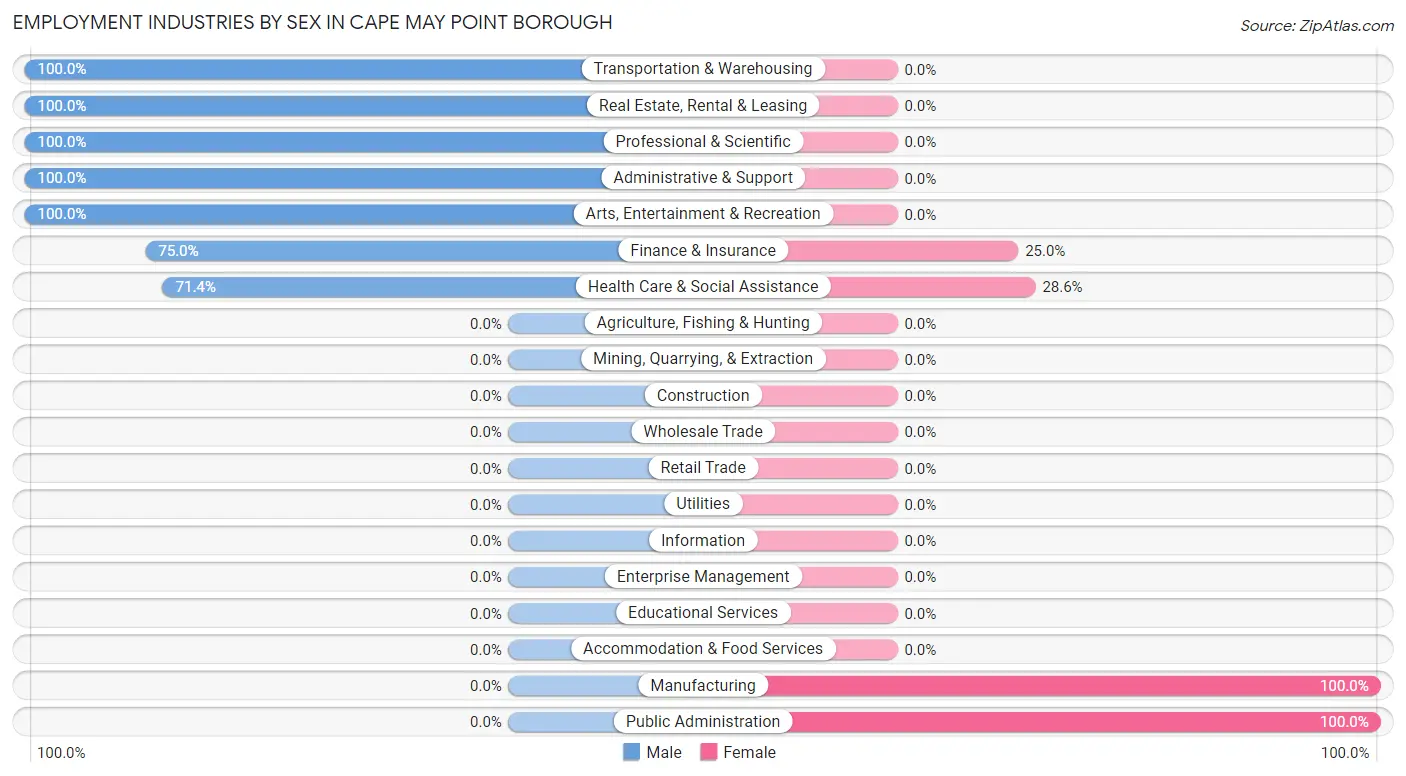
| Industry | Male | Female |
| Agriculture, Fishing & Hunting | 0 (0.0%) | 0 (0.0%) |
| Mining, Quarrying, & Extraction | 0 (0.0%) | 0 (0.0%) |
| Construction | 0 (0.0%) | 0 (0.0%) |
| Manufacturing | 0 (0.0%) | 1 (100.0%) |
| Wholesale Trade | 0 (0.0%) | 0 (0.0%) |
| Retail Trade | 0 (0.0%) | 0 (0.0%) |
| Transportation & Warehousing | 2 (100.0%) | 0 (0.0%) |
| Utilities | 0 (0.0%) | 0 (0.0%) |
| Information | 0 (0.0%) | 0 (0.0%) |
| Finance & Insurance | 3 (75.0%) | 1 (25.0%) |
| Real Estate, Rental & Leasing | 1 (100.0%) | 0 (0.0%) |
| Professional & Scientific | 1 (100.0%) | 0 (0.0%) |
| Enterprise Management | 0 (0.0%) | 0 (0.0%) |
| Administrative & Support | 4 (100.0%) | 0 (0.0%) |
| Educational Services | 0 (0.0%) | 0 (0.0%) |
| Health Care & Social Assistance | 5 (71.4%) | 2 (28.6%) |
| Arts, Entertainment & Recreation | 7 (100.0%) | 0 (0.0%) |
| Accommodation & Food Services | 0 (0.0%) | 0 (0.0%) |
| Public Administration | 0 (0.0%) | 2 (100.0%) |
| Total | 40 (87.0%) | 6 (13.0%) |
Education in Cape May Point borough
School Enrollment in Cape May Point borough
| School Level | # Students | % Students |
| Nursery / Preschool | 0 | 0.0% |
| Kindergarten | 0 | 0.0% |
| Elementary School | 0 | 0.0% |
| Middle School | 0 | 0.0% |
| High School | 0 | 0.0% |
| College / Undergraduate | 0 | 0.0% |
| Graduate / Professional | 0 | 0.0% |
| Total | 0 | 0.0% |
School Enrollment by Age by Funding Source in Cape May Point borough
| Age Bracket | Public School | Private School |
| 3 to 4 Year Olds | 0 (0.0%) | 0 (0.0%) |
| 5 to 9 Year Old | 0 (0.0%) | 0 (0.0%) |
| 10 to 14 Year Olds | 0 (0.0%) | 0 (0.0%) |
| 15 to 17 Year Olds | 0 (0.0%) | 0 (0.0%) |
| 18 to 19 Year Olds | 0 (0.0%) | 0 (0.0%) |
| 20 to 24 Year Olds | 0 (0.0%) | 0 (0.0%) |
| 25 to 34 Year Olds | 0 (0.0%) | 0 (0.0%) |
| 35 Years and over | 0 (0.0%) | 0 (0.0%) |
| Total | 0 (0.0%) | 0 (0.0%) |
Educational Attainment by Field of Study in Cape May Point borough
Education (27 | 22.0%), liberal arts & history (19 | 15.4%), social sciences (17 | 13.8%), business (15 | 12.2%), and bio, nature & agricultural (10 | 8.1%) are the most common fields of study among 123 individuals in Cape May Point borough who have obtained a bachelor's degree or higher.
| Field of Study | # Graduates | % Graduates |
| Computers & Mathematics | 1 | 0.8% |
| Bio, Nature & Agricultural | 10 | 8.1% |
| Physical & Health Sciences | 1 | 0.8% |
| Psychology | 2 | 1.6% |
| Social Sciences | 17 | 13.8% |
| Engineering | 3 | 2.4% |
| Multidisciplinary Studies | 2 | 1.6% |
| Science & Technology | 8 | 6.5% |
| Business | 15 | 12.2% |
| Education | 27 | 22.0% |
| Literature & Languages | 2 | 1.6% |
| Liberal Arts & History | 19 | 15.4% |
| Visual & Performing Arts | 9 | 7.3% |
| Communications | 4 | 3.3% |
| Arts & Humanities | 3 | 2.4% |
| Total | 123 | 100.0% |
Transportation & Commute in Cape May Point borough
Vehicle Availability by Sex in Cape May Point borough
The most prevalent vehicle ownership categories in Cape May Point borough are males with 2 vehicles (20, accounting for 87.0%) and females with 2 vehicles (4, making up 333.3%).
| Vehicles Available | Male | Female |
| No Vehicle | 0 (0.0%) | 0 (0.0%) |
| 1 Vehicle | 3 (13.0%) | 2 (33.3%) |
| 2 Vehicles | 20 (87.0%) | 4 (66.7%) |
| 3 Vehicles | 0 (0.0%) | 0 (0.0%) |
| 4 Vehicles | 0 (0.0%) | 0 (0.0%) |
| 5 or more Vehicles | 0 (0.0%) | 0 (0.0%) |
| Total | 23 (100.0%) | 6 (100.0%) |
Commute Time in Cape May Point borough
The most frequently occuring commute durations in Cape May Point borough are 5 to 9 minutes (10 commuters, 32.3%), 15 to 19 minutes (7 commuters, 22.6%), and 30 to 34 minutes (4 commuters, 12.9%).
| Commute Time | # Commuters | % Commuters |
| Less than 5 Minutes | 3 | 9.7% |
| 5 to 9 Minutes | 10 | 32.3% |
| 10 to 14 Minutes | 3 | 9.7% |
| 15 to 19 Minutes | 7 | 22.6% |
| 20 to 24 Minutes | 0 | 0.0% |
| 25 to 29 Minutes | 0 | 0.0% |
| 30 to 34 Minutes | 4 | 12.9% |
| 35 to 39 Minutes | 0 | 0.0% |
| 40 to 44 Minutes | 0 | 0.0% |
| 45 to 59 Minutes | 0 | 0.0% |
| 60 to 89 Minutes | 4 | 12.9% |
| 90 or more Minutes | 0 | 0.0% |
Commute Time by Sex in Cape May Point borough
The most common commute times in Cape May Point borough are 5 to 9 minutes (7 commuters, 25.9%) for males and 5 to 9 minutes (3 commuters, 75.0%) for females.
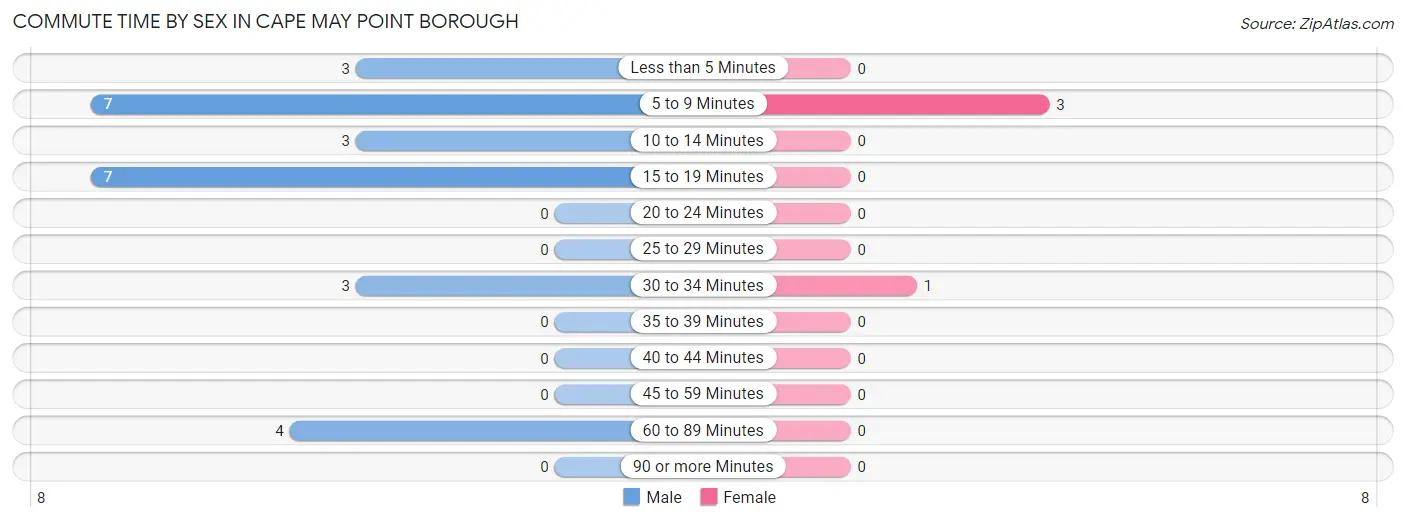
| Commute Time | Male | Female |
| Less than 5 Minutes | 3 (11.1%) | 0 (0.0%) |
| 5 to 9 Minutes | 7 (25.9%) | 3 (75.0%) |
| 10 to 14 Minutes | 3 (11.1%) | 0 (0.0%) |
| 15 to 19 Minutes | 7 (25.9%) | 0 (0.0%) |
| 20 to 24 Minutes | 0 (0.0%) | 0 (0.0%) |
| 25 to 29 Minutes | 0 (0.0%) | 0 (0.0%) |
| 30 to 34 Minutes | 3 (11.1%) | 1 (25.0%) |
| 35 to 39 Minutes | 0 (0.0%) | 0 (0.0%) |
| 40 to 44 Minutes | 0 (0.0%) | 0 (0.0%) |
| 45 to 59 Minutes | 0 (0.0%) | 0 (0.0%) |
| 60 to 89 Minutes | 4 (14.8%) | 0 (0.0%) |
| 90 or more Minutes | 0 (0.0%) | 0 (0.0%) |
Time of Departure to Work by Sex in Cape May Point borough
The most frequent times of departure to work in Cape May Point borough are 7:00 AM to 7:29 AM (10, 37.0%) for males and 9:00 AM to 9:59 AM (2, 50.0%) for females.
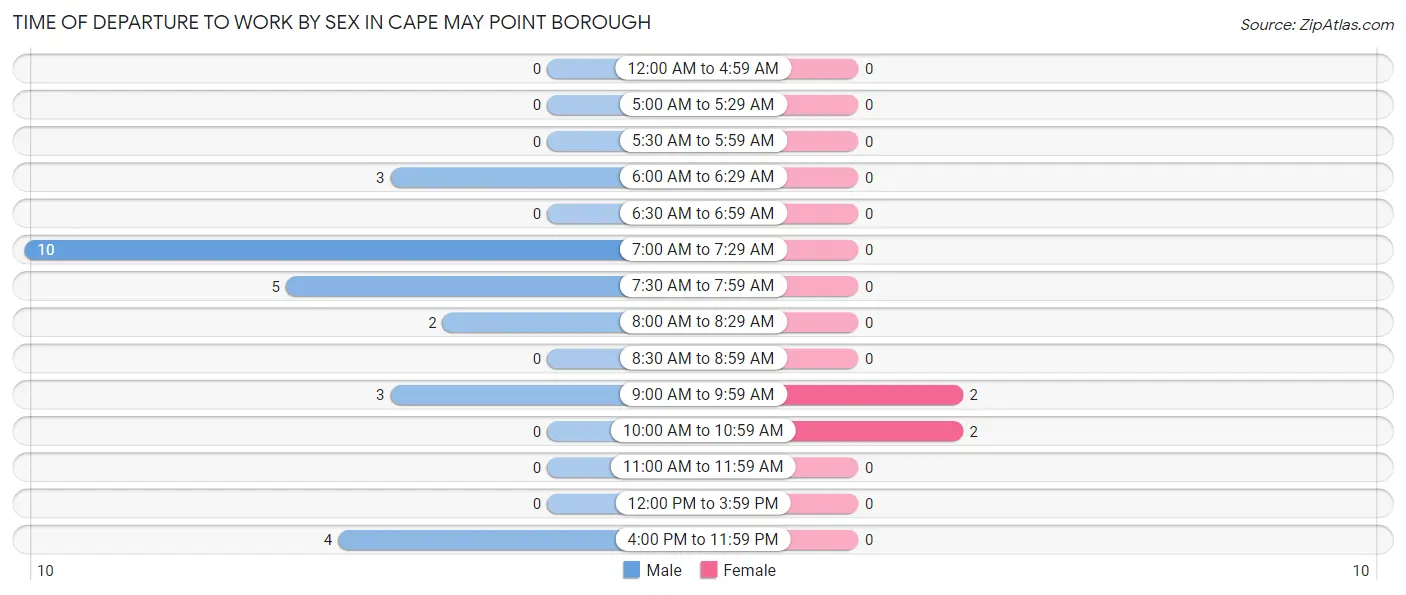
| Time of Departure | Male | Female |
| 12:00 AM to 4:59 AM | 0 (0.0%) | 0 (0.0%) |
| 5:00 AM to 5:29 AM | 0 (0.0%) | 0 (0.0%) |
| 5:30 AM to 5:59 AM | 0 (0.0%) | 0 (0.0%) |
| 6:00 AM to 6:29 AM | 3 (11.1%) | 0 (0.0%) |
| 6:30 AM to 6:59 AM | 0 (0.0%) | 0 (0.0%) |
| 7:00 AM to 7:29 AM | 10 (37.0%) | 0 (0.0%) |
| 7:30 AM to 7:59 AM | 5 (18.5%) | 0 (0.0%) |
| 8:00 AM to 8:29 AM | 2 (7.4%) | 0 (0.0%) |
| 8:30 AM to 8:59 AM | 0 (0.0%) | 0 (0.0%) |
| 9:00 AM to 9:59 AM | 3 (11.1%) | 2 (50.0%) |
| 10:00 AM to 10:59 AM | 0 (0.0%) | 2 (50.0%) |
| 11:00 AM to 11:59 AM | 0 (0.0%) | 0 (0.0%) |
| 12:00 PM to 3:59 PM | 0 (0.0%) | 0 (0.0%) |
| 4:00 PM to 11:59 PM | 4 (14.8%) | 0 (0.0%) |
| Total | 27 (100.0%) | 4 (100.0%) |
Housing Occupancy in Cape May Point borough
Occupancy by Ownership in Cape May Point borough
Of the total 85 dwellings in Cape May Point borough, owner-occupied units account for 85 (100.0%), while renter-occupied units make up 0 (0.0%).
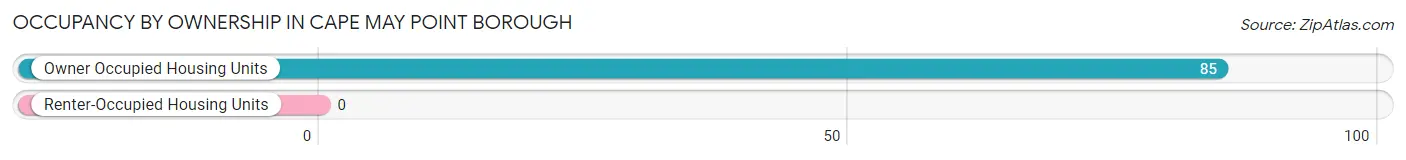
| Occupancy | # Housing Units | % Housing Units |
| Owner Occupied Housing Units | 85 | 100.0% |
| Renter-Occupied Housing Units | 0 | 0.0% |
| Total Occupied Housing Units | 85 | 100.0% |
Occupancy by Household Size in Cape May Point borough
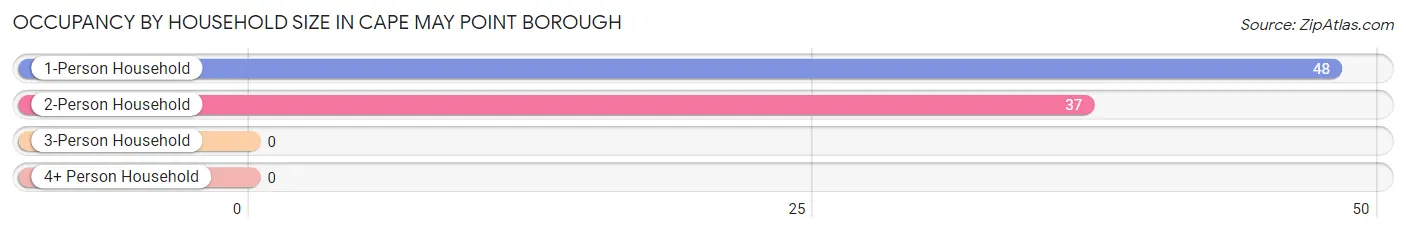
| Household Size | # Housing Units | % Housing Units |
| 1-Person Household | 48 | 56.5% |
| 2-Person Household | 37 | 43.5% |
| 3-Person Household | 0 | 0.0% |
| 4+ Person Household | 0 | 0.0% |
| Total Housing Units | 85 | 100.0% |
Occupancy by Ownership by Household Size in Cape May Point borough
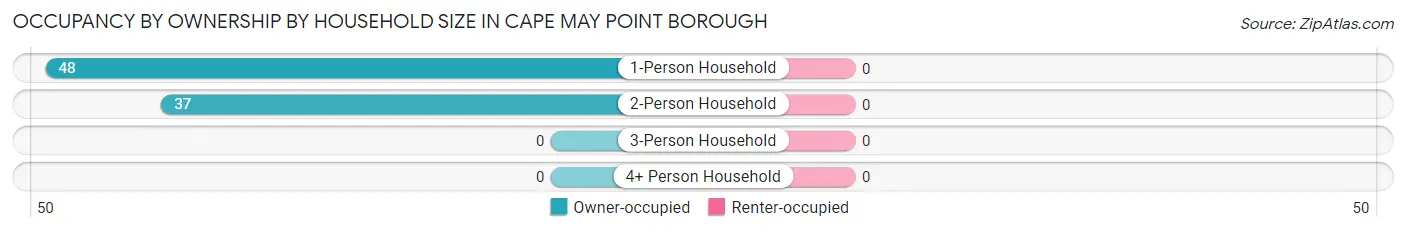
| Household Size | Owner-occupied | Renter-occupied |
| 1-Person Household | 48 (100.0%) | 0 (0.0%) |
| 2-Person Household | 37 (100.0%) | 0 (0.0%) |
| 3-Person Household | 0 (0.0%) | 0 (0.0%) |
| 4+ Person Household | 0 (0.0%) | 0 (0.0%) |
| Total Housing Units | 85 (100.0%) | 0 (0.0%) |
Occupancy by Educational Attainment in Cape May Point borough
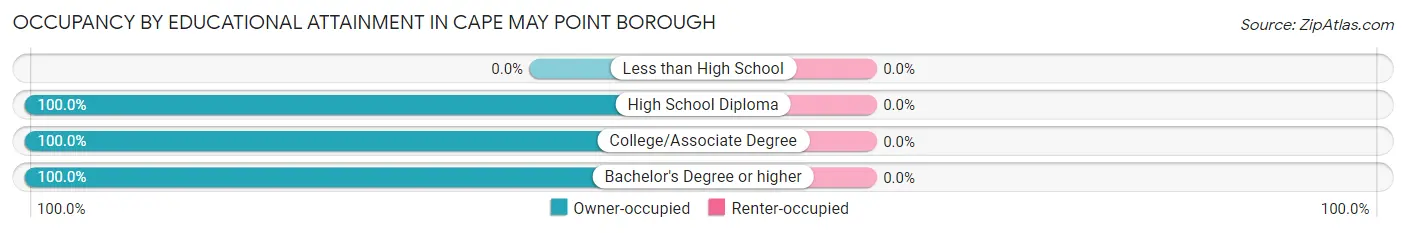
| Household Size | Owner-occupied | Renter-occupied |
| Less than High School | 0 (0.0%) | 0 (0.0%) |
| High School Diploma | 4 (100.0%) | 0 (0.0%) |
| College/Associate Degree | 28 (100.0%) | 0 (0.0%) |
| Bachelor's Degree or higher | 53 (100.0%) | 0 (0.0%) |
Occupancy by Age of Householder in Cape May Point borough
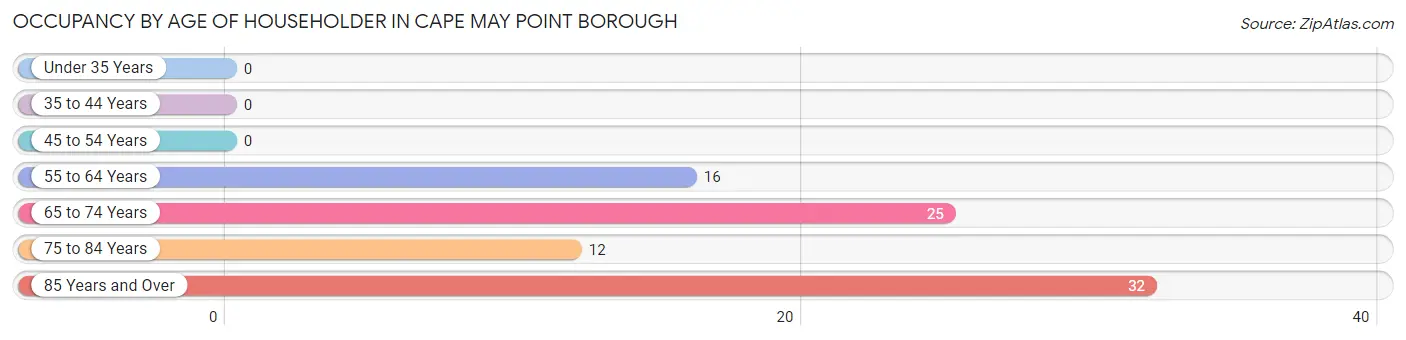
| Age Bracket | # Households | % Households |
| Under 35 Years | 0 | 0.0% |
| 35 to 44 Years | 0 | 0.0% |
| 45 to 54 Years | 0 | 0.0% |
| 55 to 64 Years | 16 | 18.8% |
| 65 to 74 Years | 25 | 29.4% |
| 75 to 84 Years | 12 | 14.1% |
| 85 Years and Over | 32 | 37.7% |
| Total | 85 | 100.0% |
Housing Finances in Cape May Point borough
Median Income by Occupancy in Cape May Point borough
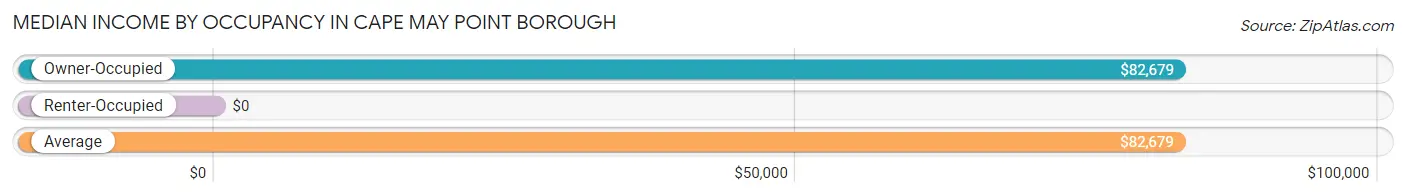
| Occupancy Type | # Households | Median Income |
| Owner-Occupied | 85 (100.0%) | $82,679 |
| Renter-Occupied | 0 (0.0%) | $0 |
| Average | 85 (100.0%) | $82,679 |
Occupancy by Householder Income Bracket in Cape May Point borough
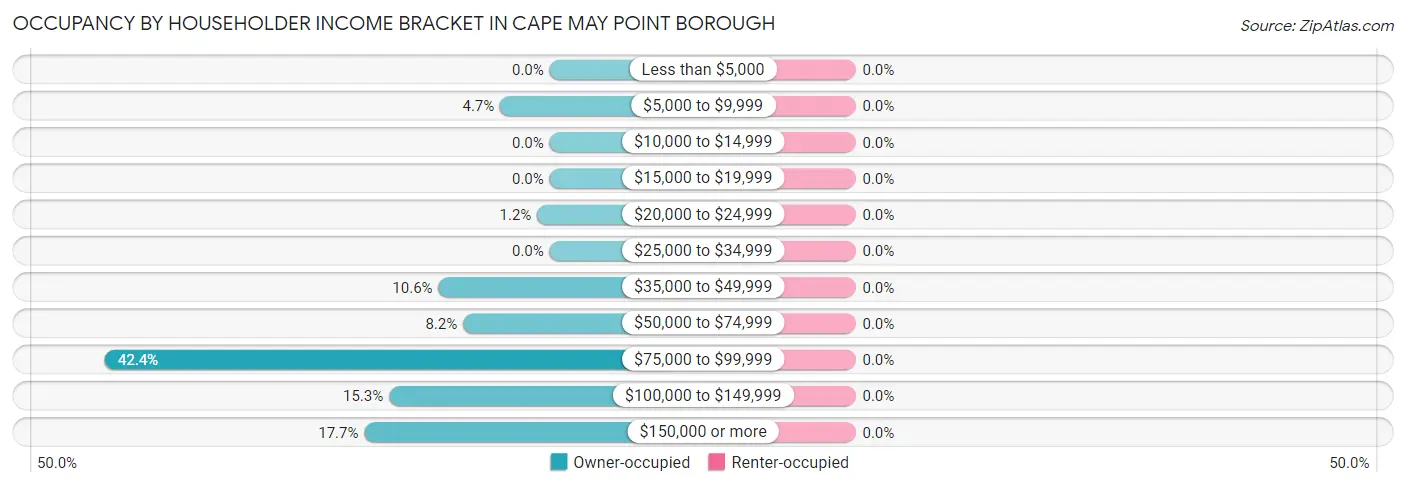
| Income Bracket | Owner-occupied | Renter-occupied |
| Less than $5,000 | 0 (0.0%) | 0 (0.0%) |
| $5,000 to $9,999 | 4 (4.7%) | 0 (0.0%) |
| $10,000 to $14,999 | 0 (0.0%) | 0 (0.0%) |
| $15,000 to $19,999 | 0 (0.0%) | 0 (0.0%) |
| $20,000 to $24,999 | 1 (1.2%) | 0 (0.0%) |
| $25,000 to $34,999 | 0 (0.0%) | 0 (0.0%) |
| $35,000 to $49,999 | 9 (10.6%) | 0 (0.0%) |
| $50,000 to $74,999 | 7 (8.2%) | 0 (0.0%) |
| $75,000 to $99,999 | 36 (42.3%) | 0 (0.0%) |
| $100,000 to $149,999 | 13 (15.3%) | 0 (0.0%) |
| $150,000 or more | 15 (17.6%) | 0 (0.0%) |
| Total | 85 (100.0%) | 0 (0.0%) |
Monthly Housing Cost Tiers in Cape May Point borough
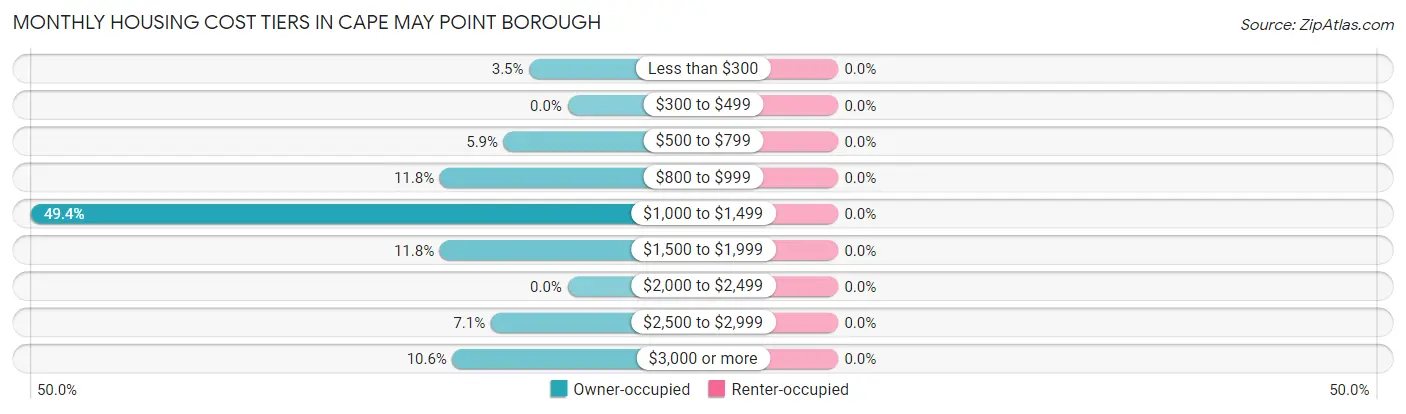
| Monthly Cost | Owner-occupied | Renter-occupied |
| Less than $300 | 3 (3.5%) | 0 (0.0%) |
| $300 to $499 | 0 (0.0%) | 0 (0.0%) |
| $500 to $799 | 5 (5.9%) | 0 (0.0%) |
| $800 to $999 | 10 (11.8%) | 0 (0.0%) |
| $1,000 to $1,499 | 42 (49.4%) | 0 (0.0%) |
| $1,500 to $1,999 | 10 (11.8%) | 0 (0.0%) |
| $2,000 to $2,499 | 0 (0.0%) | 0 (0.0%) |
| $2,500 to $2,999 | 6 (7.1%) | 0 (0.0%) |
| $3,000 or more | 9 (10.6%) | 0 (0.0%) |
| Total | 85 (100.0%) | 0 (0.0%) |
Physical Housing Characteristics in Cape May Point borough
Housing Structures in Cape May Point borough
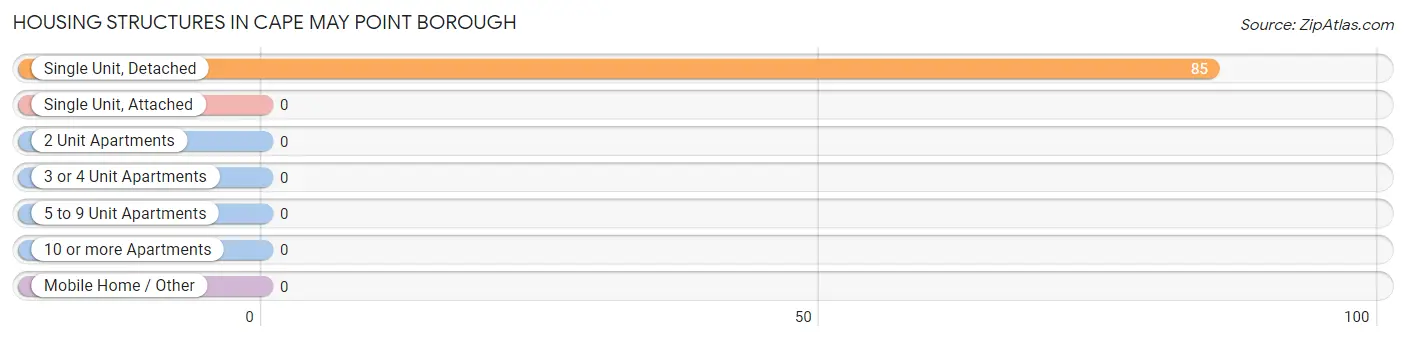
| Structure Type | # Housing Units | % Housing Units |
| Single Unit, Detached | 85 | 100.0% |
| Single Unit, Attached | 0 | 0.0% |
| 2 Unit Apartments | 0 | 0.0% |
| 3 or 4 Unit Apartments | 0 | 0.0% |
| 5 to 9 Unit Apartments | 0 | 0.0% |
| 10 or more Apartments | 0 | 0.0% |
| Mobile Home / Other | 0 | 0.0% |
| Total | 85 | 100.0% |
Housing Structures by Occupancy in Cape May Point borough
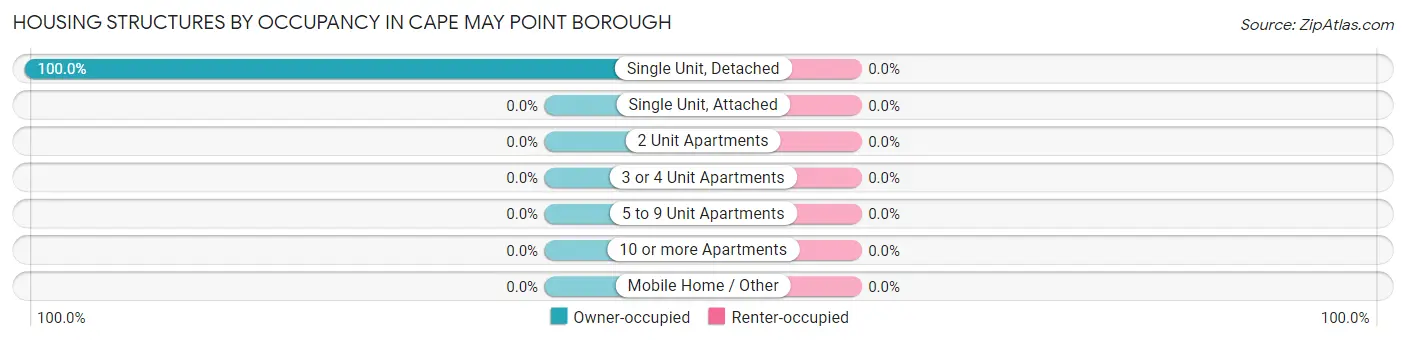
| Structure Type | Owner-occupied | Renter-occupied |
| Single Unit, Detached | 85 (100.0%) | 0 (0.0%) |
| Single Unit, Attached | 0 (0.0%) | 0 (0.0%) |
| 2 Unit Apartments | 0 (0.0%) | 0 (0.0%) |
| 3 or 4 Unit Apartments | 0 (0.0%) | 0 (0.0%) |
| 5 to 9 Unit Apartments | 0 (0.0%) | 0 (0.0%) |
| 10 or more Apartments | 0 (0.0%) | 0 (0.0%) |
| Mobile Home / Other | 0 (0.0%) | 0 (0.0%) |
| Total | 85 (100.0%) | 0 (0.0%) |
Housing Structures by Number of Rooms in Cape May Point borough
| Number of Rooms | Owner-occupied | Renter-occupied |
| 1 Room | 0 (0.0%) | 0 (0.0%) |
| 2 or 3 Rooms | 0 (0.0%) | 0 (0.0%) |
| 4 or 5 Rooms | 19 (22.4%) | 0 (0.0%) |
| 6 or 7 Rooms | 24 (28.2%) | 0 (0.0%) |
| 8 or more Rooms | 42 (49.4%) | 0 (0.0%) |
| Total | 85 (100.0%) | 0 (0.0%) |
Housing Structure by Heating Type in Cape May Point borough
| Heating Type | Owner-occupied | Renter-occupied |
| Utility Gas | 53 (62.4%) | 0 (0.0%) |
| Bottled, Tank, or LP Gas | 0 (0.0%) | 0 (0.0%) |
| Electricity | 9 (10.6%) | 0 (0.0%) |
| Fuel Oil or Kerosene | 21 (24.7%) | 0 (0.0%) |
| Coal or Coke | 0 (0.0%) | 0 (0.0%) |
| All other Fuels | 0 (0.0%) | 0 (0.0%) |
| No Fuel Used | 2 (2.4%) | 0 (0.0%) |
| Total | 85 (100.0%) | 0 (0.0%) |
Household Vehicle Usage in Cape May Point borough
| Vehicles per Household | Owner-occupied | Renter-occupied |
| No Vehicle | 0 (0.0%) | 0 (0.0%) |
| 1 Vehicle | 47 (55.3%) | 0 (0.0%) |
| 2 Vehicles | 36 (42.3%) | 0 (0.0%) |
| 3 or more Vehicles | 2 (2.4%) | 0 (0.0%) |
| Total | 85 (100.0%) | 0 (0.0%) |
Real Estate & Mortgages in Cape May Point borough
Real Estate and Mortgage Overview in Cape May Point borough
| Characteristic | Without Mortgage | With Mortgage |
| Housing Units | 59 | 26 |
| Median Property Value | $977,700 | $1,000,000 |
| Median Household Income | $81,369 | $9 |
| Monthly Housing Costs | $1,168 | $9 |
| Real Estate Taxes | $5,333 | $0 |
Property Value by Mortgage Status in Cape May Point borough
| Property Value | Without Mortgage | With Mortgage |
| Less than $50,000 | 0 (0.0%) | 0 (0.0%) |
| $50,000 to $99,999 | 0 (0.0%) | 0 (0.0%) |
| $100,000 to $299,999 | 0 (0.0%) | 2 (7.7%) |
| $300,000 to $499,999 | 3 (5.1%) | 0 (0.0%) |
| $500,000 to $749,999 | 1 (1.7%) | 0 (0.0%) |
| $750,000 to $999,999 | 28 (47.5%) | 11 (42.3%) |
| $1,000,000 or more | 27 (45.8%) | 13 (50.0%) |
| Total | 59 (100.0%) | 26 (100.0%) |
Household Income by Mortgage Status in Cape May Point borough
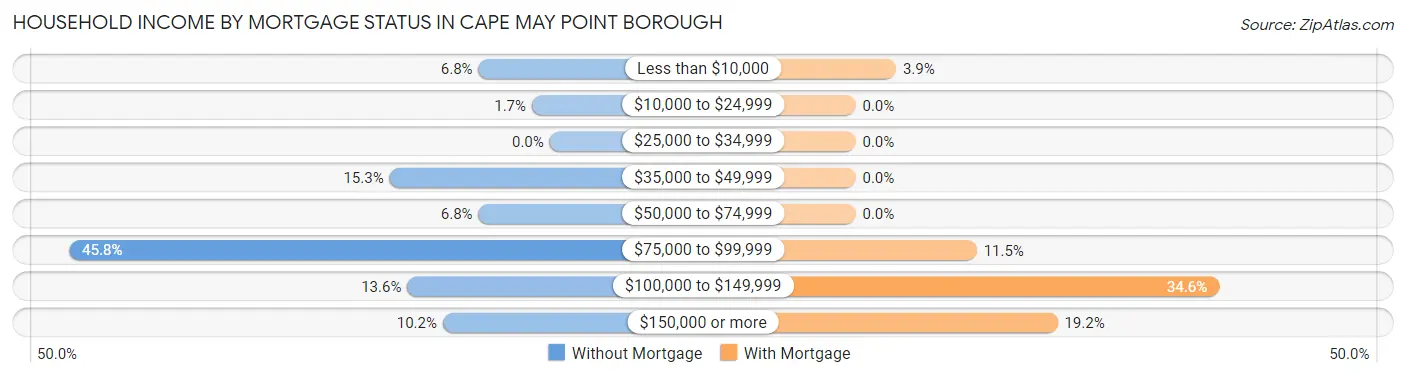
| Household Income | Without Mortgage | With Mortgage |
| Less than $10,000 | 4 (6.8%) | 1 (3.8%) |
| $10,000 to $24,999 | 1 (1.7%) | 0 (0.0%) |
| $25,000 to $34,999 | 0 (0.0%) | 0 (0.0%) |
| $35,000 to $49,999 | 9 (15.2%) | 0 (0.0%) |
| $50,000 to $74,999 | 4 (6.8%) | 0 (0.0%) |
| $75,000 to $99,999 | 27 (45.8%) | 3 (11.5%) |
| $100,000 to $149,999 | 8 (13.6%) | 9 (34.6%) |
| $150,000 or more | 6 (10.2%) | 5 (19.2%) |
| Total | 59 (100.0%) | 26 (100.0%) |
Property Value to Household Income Ratio in Cape May Point borough
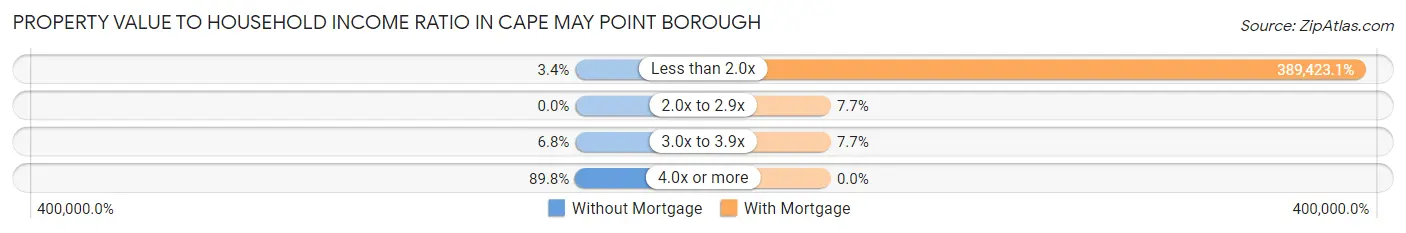
| Value-to-Income Ratio | Without Mortgage | With Mortgage |
| Less than 2.0x | 2 (3.4%) | 101,250 (389,423.1%) |
| 2.0x to 2.9x | 0 (0.0%) | 2 (7.7%) |
| 3.0x to 3.9x | 4 (6.8%) | 2 (7.7%) |
| 4.0x or more | 53 (89.8%) | 0 (0.0%) |
| Total | 59 (100.0%) | 26 (100.0%) |
Real Estate Taxes by Mortgage Status in Cape May Point borough
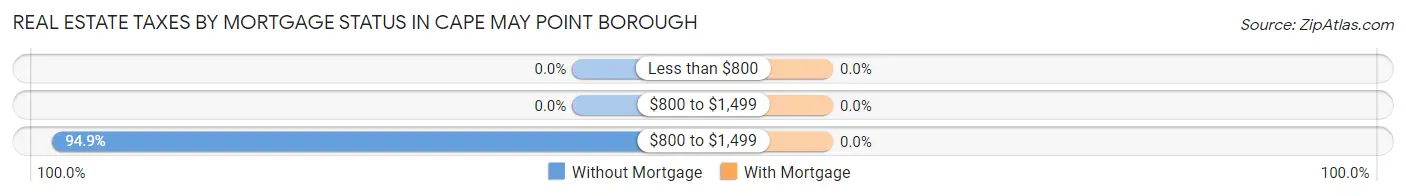
| Property Taxes | Without Mortgage | With Mortgage |
| Less than $800 | 0 (0.0%) | 0 (0.0%) |
| $800 to $1,499 | 0 (0.0%) | 0 (0.0%) |
| $800 to $1,499 | 56 (94.9%) | 0 (0.0%) |
| Total | 59 (100.0%) | 26 (100.0%) |
Health & Disability in Cape May Point borough
Health Insurance Coverage by Age in Cape May Point borough
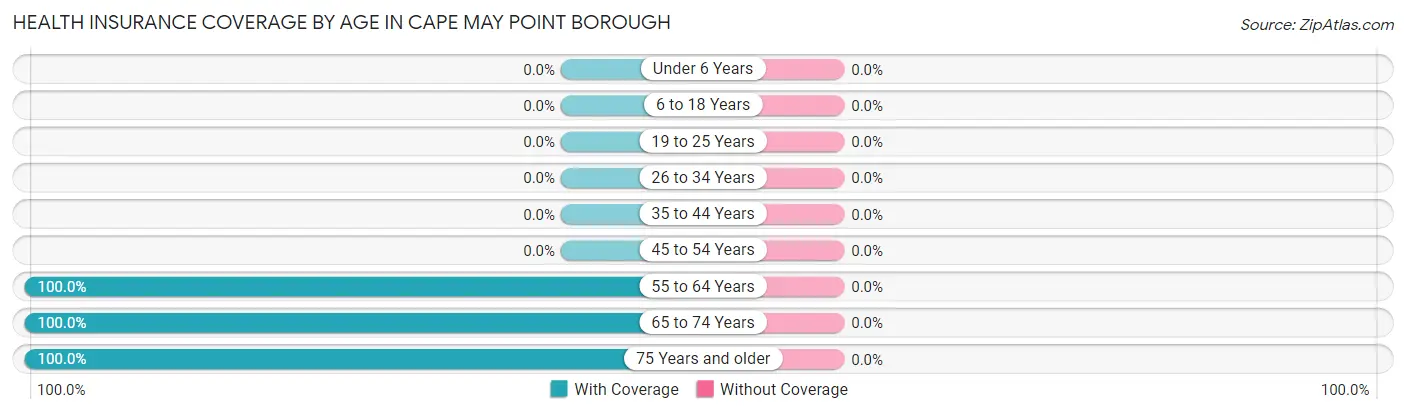
| Age Bracket | With Coverage | Without Coverage |
| Under 6 Years | 0 (0.0%) | 0 (0.0%) |
| 6 to 18 Years | 0 (0.0%) | 0 (0.0%) |
| 19 to 25 Years | 0 (0.0%) | 0 (0.0%) |
| 26 to 34 Years | 0 (0.0%) | 0 (0.0%) |
| 35 to 44 Years | 0 (0.0%) | 0 (0.0%) |
| 45 to 54 Years | 0 (0.0%) | 0 (0.0%) |
| 55 to 64 Years | 37 (100.0%) | 0 (0.0%) |
| 65 to 74 Years | 59 (100.0%) | 0 (0.0%) |
| 75 Years and older | 59 (100.0%) | 0 (0.0%) |
| Total | 155 (100.0%) | 0 (0.0%) |
Health Insurance Coverage by Citizenship Status in Cape May Point borough
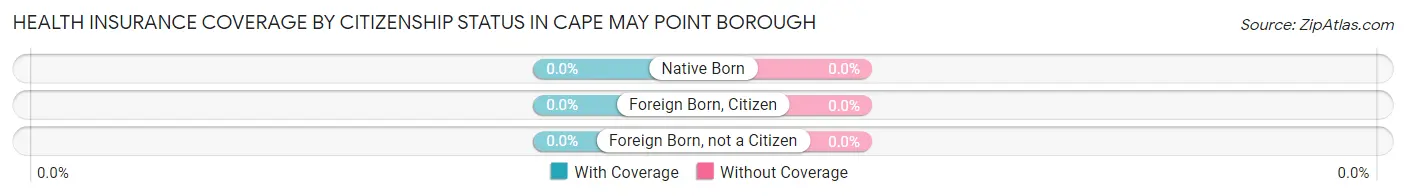
| Citizenship Status | With Coverage | Without Coverage |
| Native Born | 0 (0.0%) | 0 (0.0%) |
| Foreign Born, Citizen | 0 (0.0%) | 0 (0.0%) |
| Foreign Born, not a Citizen | 0 (0.0%) | 0 (0.0%) |
Health Insurance Coverage by Household Income in Cape May Point borough
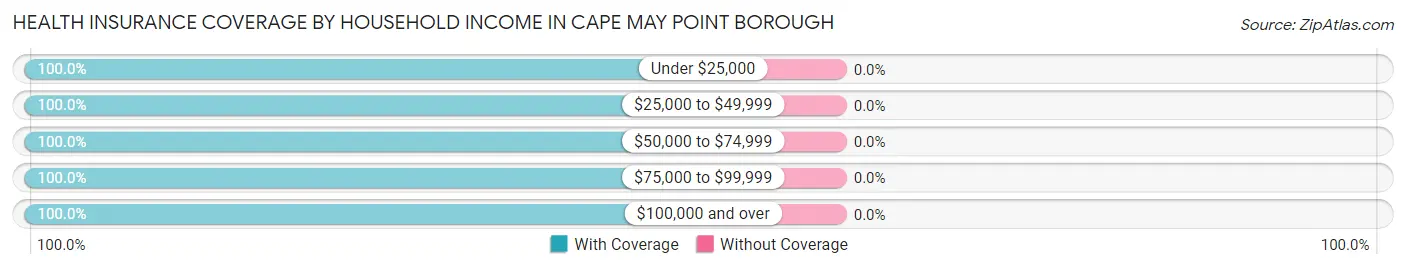
| Household Income | With Coverage | Without Coverage |
| Under $25,000 | 5 (100.0%) | 0 (0.0%) |
| $25,000 to $49,999 | 9 (100.0%) | 0 (0.0%) |
| $50,000 to $74,999 | 12 (100.0%) | 0 (0.0%) |
| $75,000 to $99,999 | 45 (100.0%) | 0 (0.0%) |
| $100,000 and over | 45 (100.0%) | 0 (0.0%) |
Public vs Private Health Insurance Coverage by Age in Cape May Point borough
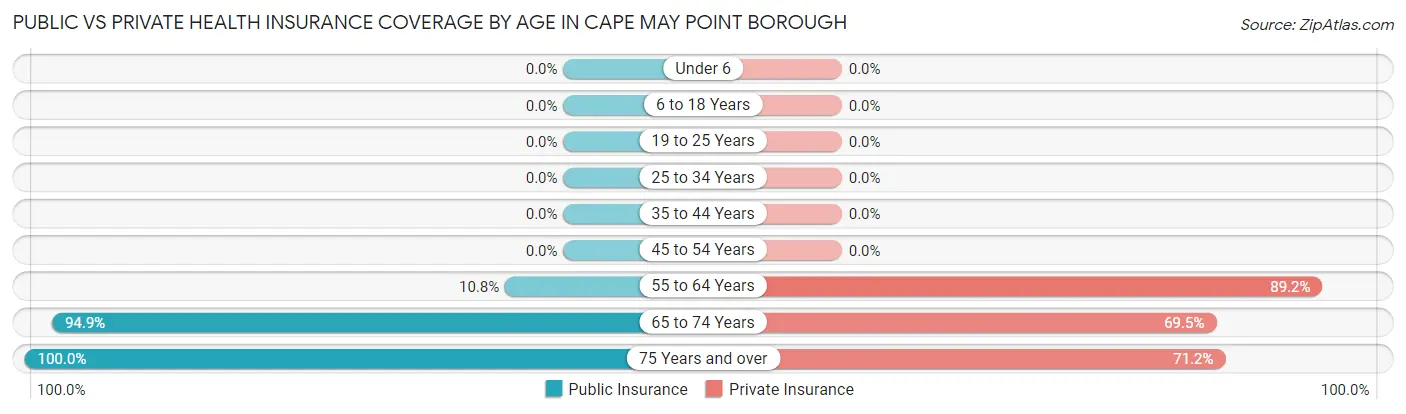
| Age Bracket | Public Insurance | Private Insurance |
| Under 6 | 0 (0.0%) | 0 (0.0%) |
| 6 to 18 Years | 0 (0.0%) | 0 (0.0%) |
| 19 to 25 Years | 0 (0.0%) | 0 (0.0%) |
| 25 to 34 Years | 0 (0.0%) | 0 (0.0%) |
| 35 to 44 Years | 0 (0.0%) | 0 (0.0%) |
| 45 to 54 Years | 0 (0.0%) | 0 (0.0%) |
| 55 to 64 Years | 4 (10.8%) | 33 (89.2%) |
| 65 to 74 Years | 56 (94.9%) | 41 (69.5%) |
| 75 Years and over | 59 (100.0%) | 42 (71.2%) |
| Total | 119 (76.8%) | 116 (74.8%) |
Disability Status by Sex by Age in Cape May Point borough
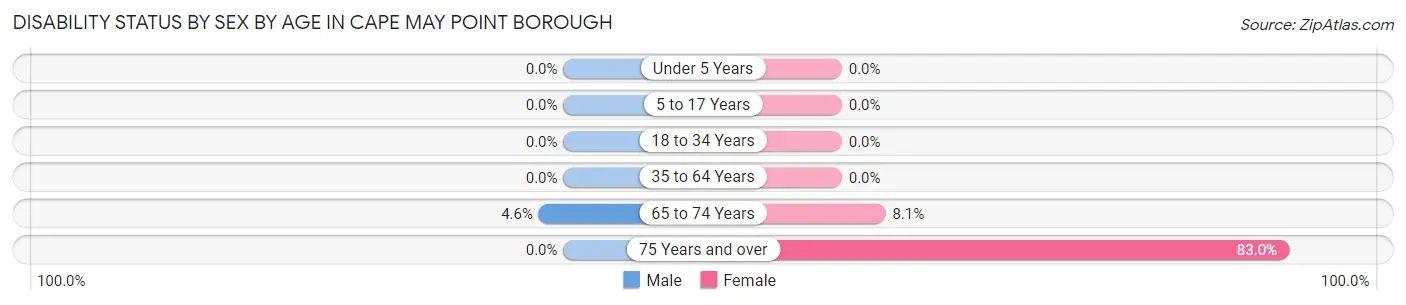
| Age Bracket | Male | Female |
| Under 5 Years | 0 (0.0%) | 0 (0.0%) |
| 5 to 17 Years | 0 (0.0%) | 0 (0.0%) |
| 18 to 34 Years | 0 (0.0%) | 0 (0.0%) |
| 35 to 64 Years | 0 (0.0%) | 0 (0.0%) |
| 65 to 74 Years | 1 (4.5%) | 3 (8.1%) |
| 75 Years and over | 0 (0.0%) | 39 (83.0%) |
Disability Class by Sex by Age in Cape May Point borough
Disability Class: Hearing Difficulty
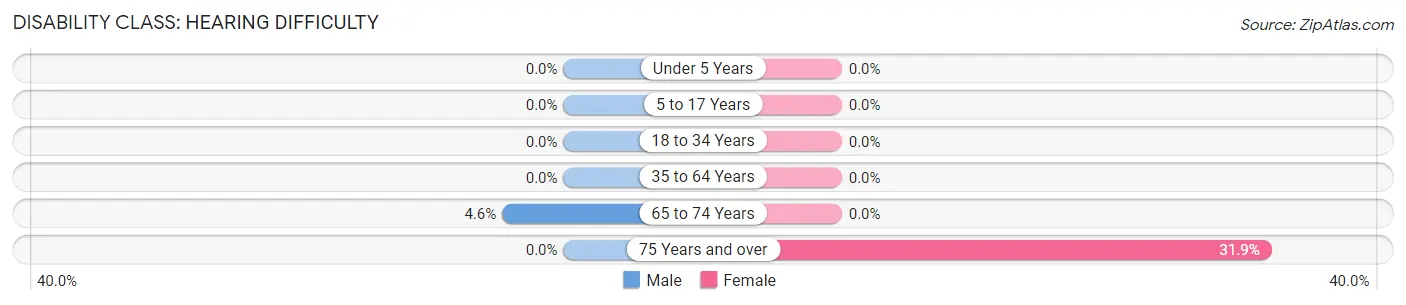
| Age Bracket | Male | Female |
| Under 5 Years | 0 (0.0%) | 0 (0.0%) |
| 5 to 17 Years | 0 (0.0%) | 0 (0.0%) |
| 18 to 34 Years | 0 (0.0%) | 0 (0.0%) |
| 35 to 64 Years | 0 (0.0%) | 0 (0.0%) |
| 65 to 74 Years | 1 (4.5%) | 0 (0.0%) |
| 75 Years and over | 0 (0.0%) | 15 (31.9%) |
Disability Class: Vision Difficulty
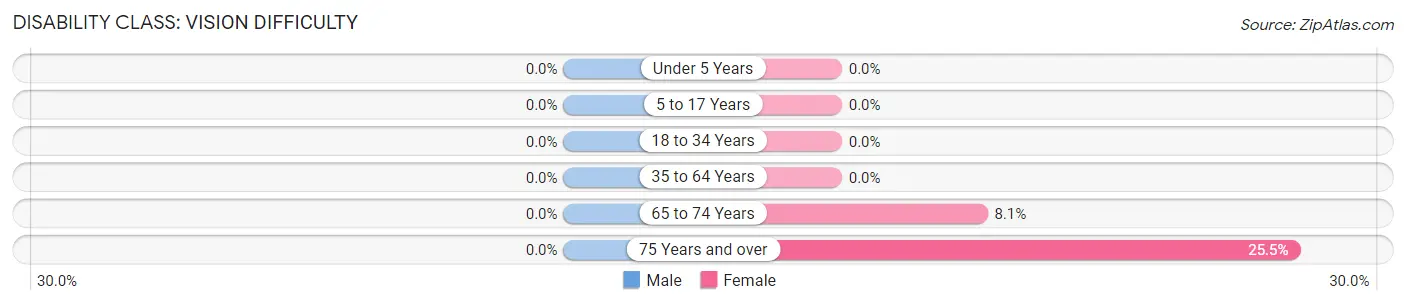
| Age Bracket | Male | Female |
| Under 5 Years | 0 (0.0%) | 0 (0.0%) |
| 5 to 17 Years | 0 (0.0%) | 0 (0.0%) |
| 18 to 34 Years | 0 (0.0%) | 0 (0.0%) |
| 35 to 64 Years | 0 (0.0%) | 0 (0.0%) |
| 65 to 74 Years | 0 (0.0%) | 3 (8.1%) |
| 75 Years and over | 0 (0.0%) | 12 (25.5%) |
Disability Class: Cognitive Difficulty
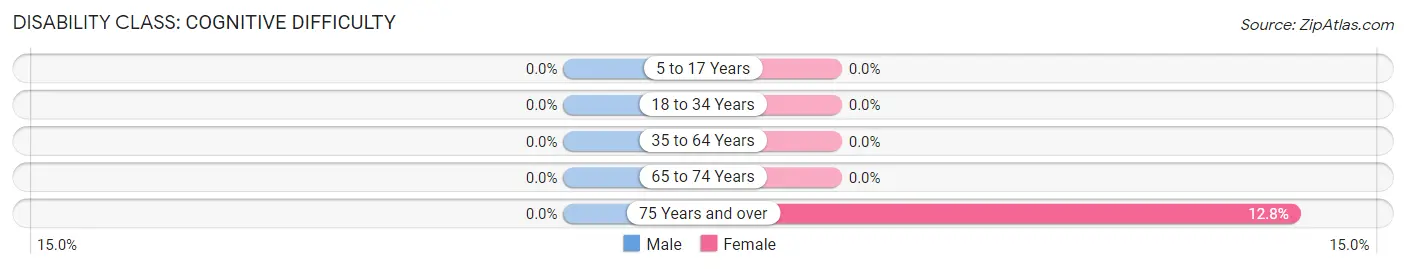
| Age Bracket | Male | Female |
| 5 to 17 Years | 0 (0.0%) | 0 (0.0%) |
| 18 to 34 Years | 0 (0.0%) | 0 (0.0%) |
| 35 to 64 Years | 0 (0.0%) | 0 (0.0%) |
| 65 to 74 Years | 0 (0.0%) | 0 (0.0%) |
| 75 Years and over | 0 (0.0%) | 6 (12.8%) |
Disability Class: Ambulatory Difficulty
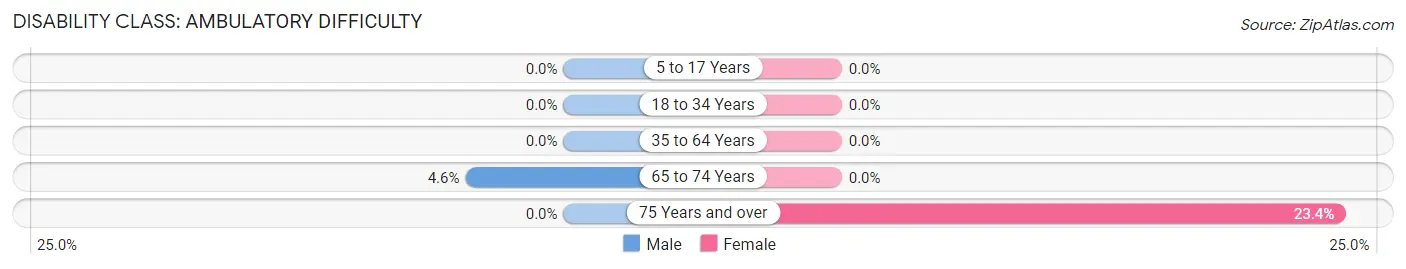
| Age Bracket | Male | Female |
| 5 to 17 Years | 0 (0.0%) | 0 (0.0%) |
| 18 to 34 Years | 0 (0.0%) | 0 (0.0%) |
| 35 to 64 Years | 0 (0.0%) | 0 (0.0%) |
| 65 to 74 Years | 1 (4.5%) | 0 (0.0%) |
| 75 Years and over | 0 (0.0%) | 11 (23.4%) |
Disability Class: Self-Care Difficulty
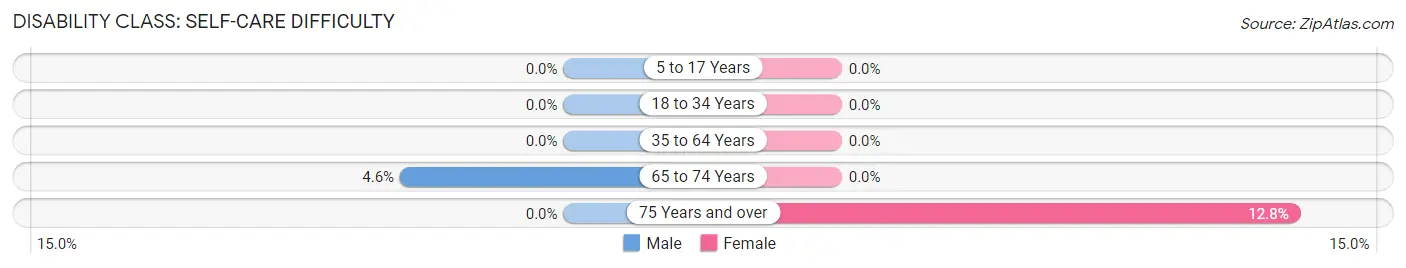
| Age Bracket | Male | Female |
| 5 to 17 Years | 0 (0.0%) | 0 (0.0%) |
| 18 to 34 Years | 0 (0.0%) | 0 (0.0%) |
| 35 to 64 Years | 0 (0.0%) | 0 (0.0%) |
| 65 to 74 Years | 1 (4.5%) | 0 (0.0%) |
| 75 Years and over | 0 (0.0%) | 6 (12.8%) |
Technology Access in Cape May Point borough
Computing Device Access in Cape May Point borough
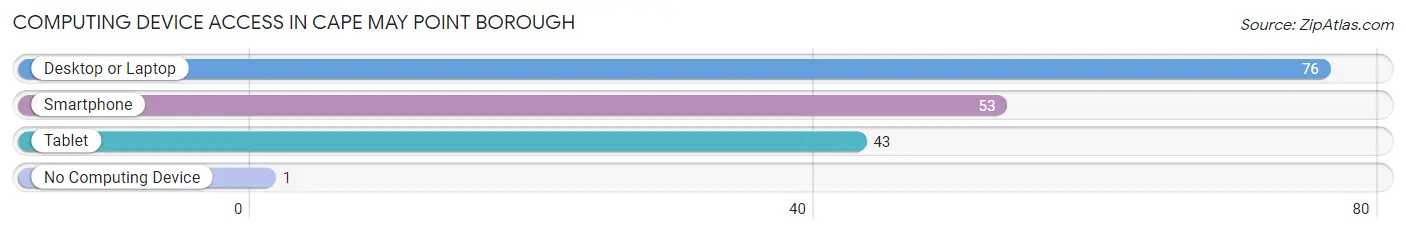
| Device Type | # Households | % Households |
| Desktop or Laptop | 76 | 89.4% |
| Smartphone | 53 | 62.4% |
| Tablet | 43 | 50.6% |
| No Computing Device | 1 | 1.2% |
| Total | 85 | 100.0% |
Internet Access in Cape May Point borough
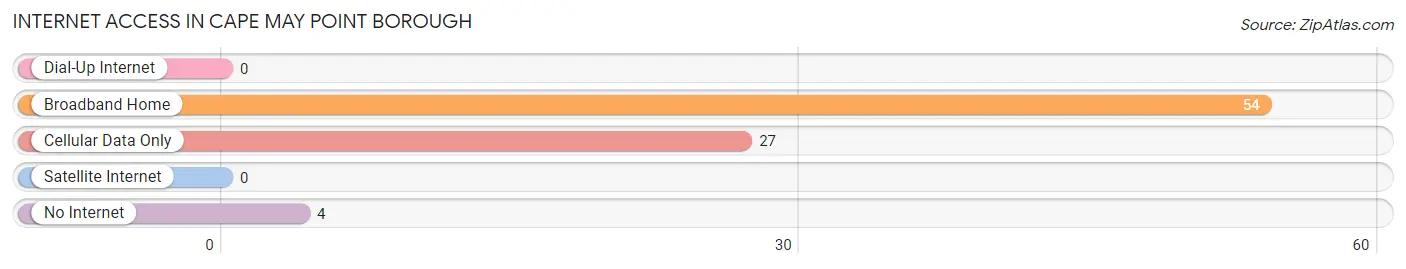
| Internet Type | # Households | % Households |
| Dial-Up Internet | 0 | 0.0% |
| Broadband Home | 54 | 63.5% |
| Cellular Data Only | 27 | 31.8% |
| Satellite Internet | 0 | 0.0% |
| No Internet | 4 | 4.7% |
| Total | 85 | 100.0% |
Cape May Point borough Summary
Cape May Point Borough is a small borough located in Cape May County, New Jersey. It is situated on the southern tip of the Cape May Peninsula, and is bordered by the Atlantic Ocean to the east and the Delaware Bay to the west. The borough has a total area of 0.3 square miles, all of which is land. As of the 2010 United States Census, the borough had a population of 284, a decrease of 8.3% from the 2000 Census.
History
The area that is now Cape May Point Borough was originally inhabited by the Lenape Native Americans. The first European settlers arrived in the area in the late 1600s, and the area was officially incorporated as a borough in 1878.
The borough was originally a fishing village, and it was known for its large oyster beds. In the late 1800s, the area began to attract tourists, and the first hotel was built in 1878. The area quickly became a popular summer destination, and by the early 1900s, it had become a popular resort town.
In the early 1900s, the borough was home to a number of large hotels, including the Hotel Cape May Point, the Hotel St. George, and the Hotel St. Charles. The hotels attracted a number of famous guests, including President Theodore Roosevelt and President William Howard Taft.
In the 1950s, the borough began to decline in popularity as a tourist destination, and many of the hotels were closed or converted into condominiums. In the 1970s, the borough began to attract a new wave of tourists, and the area has since become a popular destination for birdwatchers and nature lovers.
Geography
Cape May Point Borough is located at the southern tip of the Cape May Peninsula, and is bordered by the Atlantic Ocean to the east and the Delaware Bay to the west. The borough has a total area of 0.3 square miles, all of which is land.
The borough is located in a temperate climate zone, and the average annual temperature is around 60°F. The average annual precipitation is around 45 inches.
Economy
The economy of Cape May Point Borough is largely based on tourism. The borough is home to a number of hotels, restaurants, and shops, and it is a popular destination for birdwatchers and nature lovers.
The borough is also home to a number of small businesses, including a marina, a bait and tackle shop, and a boat rental business.
Demographics
As of the 2010 United States Census, the borough had a population of 284, a decrease of 8.3% from the 2000 Census. The racial makeup of the borough was 97.2% White, 0.7% African American, 0.4% Native American, 0.4% Asian, and 1.4% from two or more races.
The median household income in the borough was $50,000, and the median family income was $60,000. The per capita income was $25,000. About 8.3% of the population was below the poverty line.
Common Questions
What is Per Capita Income in Cape May Point borough?
Per Capita income in Cape May Point borough is $69,308.
What is the Median Family Income in Cape May Point borough?
Median Family Income in Cape May Point borough is $106,750.
What is the Median Household income in Cape May Point borough?
Median Household Income in Cape May Point borough is $82,679.
What is Inequality or Gini Index in Cape May Point borough?
Inequality or Gini Index in Cape May Point borough is 0.40.
What is the Total Population of Cape May Point borough?
Total Population of Cape May Point borough is 155.
What is the Total Male Population of Cape May Point borough?
Total Male Population of Cape May Point borough is 60.
What is the Total Female Population of Cape May Point borough?
Total Female Population of Cape May Point borough is 95.
What is the Ratio of Males per 100 Females in Cape May Point borough?
There are 63.16 Males per 100 Females in Cape May Point borough.
What is the Ratio of Females per 100 Males in Cape May Point borough?
There are 158.33 Females per 100 Males in Cape May Point borough.
What is the Median Population Age in Cape May Point borough?
Median Population Age in Cape May Point borough is 71.3 Years.
What is the Average Family Size in Cape May Point borough
Average Family Size in Cape May Point borough is 1.8 People.
What is the Average Household Size in Cape May Point borough
Average Household Size in Cape May Point borough is 1.4 People.
How Large is the Labor Force in Cape May Point borough?
There are 50 People in the Labor Forcein in Cape May Point borough.
What is the Percentage of People in the Labor Force in Cape May Point borough?
32.3% of People are in the Labor Force in Cape May Point borough.
What is the Unemployment Rate in Cape May Point borough?
Unemployment Rate in Cape May Point borough is 8.0%.