Cities with the Highest Percentage of Immigrants from South America in New Jersey
RELATED REPORTS & OPTIONS
South America
New Jersey
Compare Cities
Map of Cities with the Highest Percentage of Immigrants from South America in New Jersey
0.00%
50.00%
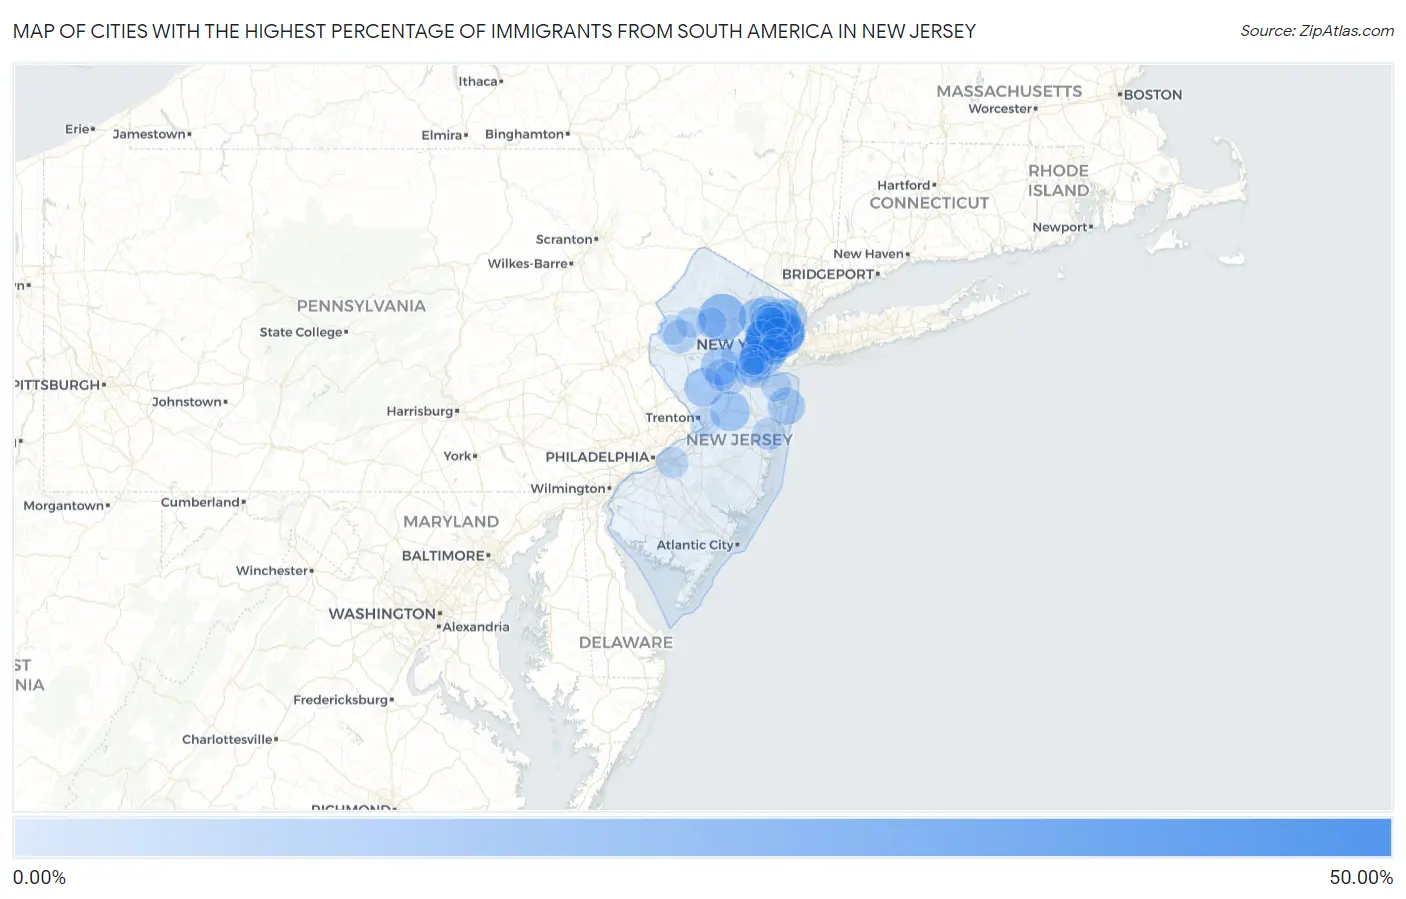
Cities with the Highest Percentage of Immigrants from South America in New Jersey
| City | South America | vs State | vs National | |
| 1. | East Newark Borough | 47.76% | 3.91%(+43.8)#74 | 1.10%(+46.7)#4,384 |
| 2. | Victory Gardens Borough | 32.37% | 3.91%(+28.5)#75 | 1.10%(+31.3)#4,385 |
| 3. | Moonachie Borough | 27.77% | 3.91%(+23.9)#199 | 1.10%(+26.7)#8,072 |
| 4. | Kearny | 22.82% | 3.91%(+18.9)#200 | 1.10%(+21.7)#8,073 |
| 5. | Wharton Borough | 22.60% | 3.91%(+18.7)#350 | 1.10%(+21.5)#12,555 |
| 6. | Silver Lake Cdp Essex County | 21.44% | 3.91%(+17.5)#351 | 1.10%(+20.3)#12,556 |
| 7. | Harrison | 21.01% | 3.91%(+17.1)#352 | 1.10%(+19.9)#12,557 |
| 8. | Dover | 20.95% | 3.91%(+17.0)#353 | 1.10%(+19.9)#12,558 |
| 9. | Ampere North | 20.43% | 3.91%(+16.5)#354 | 1.10%(+19.3)#12,559 |
| 10. | Elizabeth | 19.36% | 3.91%(+15.5)#355 | 1.10%(+18.3)#12,560 |
| 11. | Dunellen Borough | 17.20% | 3.91%(+13.3)#356 | 1.10%(+16.1)#12,561 |
| 12. | Union City | 16.12% | 3.91%(+12.2)#357 | 1.10%(+15.0)#12,562 |
| 13. | Port Morris | 15.05% | 3.91%(+11.1)#358 | 1.10%(+13.9)#12,563 |
| 14. | Guttenberg | 14.29% | 3.91%(+10.4)#359 | 1.10%(+13.2)#12,564 |
| 15. | Twin Rivers | 13.49% | 3.91%(+9.59)#360 | 1.10%(+12.4)#12,565 |
| 16. | West New York | 13.21% | 3.91%(+9.30)#361 | 1.10%(+12.1)#12,566 |
| 17. | Lodi Borough | 13.19% | 3.91%(+9.29)#362 | 1.10%(+12.1)#12,567 |
| 18. | Newark | 13.12% | 3.91%(+9.21)#363 | 1.10%(+12.0)#12,568 |
| 19. | North Plainfield Borough | 12.96% | 3.91%(+9.06)#364 | 1.10%(+11.9)#12,569 |
| 20. | Menlo Park Terrace | 12.80% | 3.91%(+8.90)#365 | 1.10%(+11.7)#12,570 |
| 21. | Skillman | 12.79% | 3.91%(+8.89)#366 | 1.10%(+11.7)#12,571 |
| 22. | Hightstown Borough | 12.69% | 3.91%(+8.78)#367 | 1.10%(+11.6)#12,572 |
| 23. | Finderne | 12.14% | 3.91%(+8.24)#368 | 1.10%(+11.0)#12,573 |
| 24. | Singac | 11.80% | 3.91%(+7.90)#369 | 1.10%(+10.7)#12,574 |
| 25. | Prospect Park Borough | 11.80% | 3.91%(+7.89)#370 | 1.10%(+10.7)#12,575 |
| 26. | Roselle Park Borough | 11.35% | 3.91%(+7.44)#371 | 1.10%(+10.3)#12,576 |
| 27. | Long Branch | 11.16% | 3.91%(+7.26)#372 | 1.10%(+10.1)#12,577 |
| 28. | Hackensack | 11.16% | 3.91%(+7.26)#373 | 1.10%(+10.1)#12,578 |
| 29. | Union | 11.13% | 3.91%(+7.22)#374 | 1.10%(+10.0)#12,579 |
| 30. | Hamburg Borough | 10.97% | 3.91%(+7.06)#375 | 1.10%(+9.87)#12,580 |
| 31. | Englewood | 10.76% | 3.91%(+6.86)#376 | 1.10%(+9.66)#12,581 |
| 32. | Ridgefield Park | 10.73% | 3.91%(+6.82)#377 | 1.10%(+9.63)#12,582 |
| 33. | Little Ferry Borough | 10.52% | 3.91%(+6.61)#378 | 1.10%(+9.42)#12,583 |
| 34. | Roselle Borough | 10.01% | 3.91%(+6.11)#379 | 1.10%(+8.92)#12,584 |
| 35. | Hopelawn | 10.00% | 3.91%(+6.09)#380 | 1.10%(+8.90)#12,585 |
| 36. | Paterson | 9.65% | 3.91%(+5.74)#381 | 1.10%(+8.55)#12,586 |
| 37. | North Arlington Borough | 9.58% | 3.91%(+5.68)#382 | 1.10%(+8.48)#12,587 |
| 38. | Bogota Borough | 9.41% | 3.91%(+5.50)#383 | 1.10%(+8.31)#12,588 |
| 39. | Haledon Borough | 9.35% | 3.91%(+5.44)#384 | 1.10%(+8.25)#12,589 |
| 40. | Linden | 9.21% | 3.91%(+5.30)#385 | 1.10%(+8.11)#12,590 |
| 41. | Cliffside Park Borough | 8.77% | 3.91%(+4.86)#386 | 1.10%(+7.67)#12,591 |
| 42. | Clifton | 8.27% | 3.91%(+4.37)#387 | 1.10%(+7.18)#12,592 |
| 43. | Garfield | 8.16% | 3.91%(+4.26)#388 | 1.10%(+7.06)#12,593 |
| 44. | Bound Brook Borough | 7.95% | 3.91%(+4.05)#389 | 1.10%(+6.86)#12,594 |
| 45. | Llewellyn Park | 7.78% | 3.91%(+3.88)#390 | 1.10%(+6.68)#12,595 |
| 46. | Raritan Borough | 7.73% | 3.91%(+3.83)#391 | 1.10%(+6.64)#12,596 |
| 47. | Teterboro Borough | 7.69% | 3.91%(+3.79)#392 | 1.10%(+6.59)#12,597 |
| 48. | Totowa Borough | 7.61% | 3.91%(+3.70)#393 | 1.10%(+6.51)#12,598 |
| 49. | Leonia Borough | 7.27% | 3.91%(+3.36)#394 | 1.10%(+6.17)#12,599 |
| 50. | Anderson | 7.08% | 3.91%(+3.17)#395 | 1.10%(+5.98)#12,600 |
| 51. | Garwood Borough | 7.05% | 3.91%(+3.14)#396 | 1.10%(+5.95)#12,601 |
| 52. | Plainfield | 7.00% | 3.91%(+3.10)#397 | 1.10%(+5.90)#12,602 |
| 53. | Fieldsboro Borough | 6.83% | 3.91%(+2.92)#398 | 1.10%(+5.73)#12,603 |
| 54. | Watsessing | 6.75% | 3.91%(+2.84)#399 | 1.10%(+5.65)#12,604 |
| 55. | Ramtown | 6.66% | 3.91%(+2.75)#400 | 1.10%(+5.56)#12,605 |
| 56. | Bergenfield Borough | 6.62% | 3.91%(+2.71)#401 | 1.10%(+5.52)#12,606 |
| 57. | Fairview Borough | 6.36% | 3.91%(+2.46)#402 | 1.10%(+5.26)#12,607 |
| 58. | East Millstone | 6.28% | 3.91%(+2.38)#403 | 1.10%(+5.19)#12,608 |
| 59. | Voorhees | 6.23% | 3.91%(+2.32)#404 | 1.10%(+5.13)#12,609 |
| 60. | South Bound Brook Borough | 6.22% | 3.91%(+2.32)#405 | 1.10%(+5.12)#12,610 |
| 61. | Hasbrouck Heights Borough | 6.22% | 3.91%(+2.31)#406 | 1.10%(+5.12)#12,611 |
| 62. | North Haledon Borough | 6.12% | 3.91%(+2.22)#407 | 1.10%(+5.03)#12,612 |
| 63. | Jamesburg Borough | 6.07% | 3.91%(+2.16)#408 | 1.10%(+4.97)#12,613 |
| 64. | Ridgefield Borough | 5.96% | 3.91%(+2.05)#409 | 1.10%(+4.86)#12,614 |
| 65. | East Orange | 5.81% | 3.91%(+1.90)#410 | 1.10%(+4.71)#12,615 |
| 66. | Hi Nella Borough | 5.78% | 3.91%(+1.87)#411 | 1.10%(+4.68)#12,616 |
| 67. | Fords | 5.77% | 3.91%(+1.87)#412 | 1.10%(+4.67)#12,617 |
| 68. | Flemington Borough | 5.69% | 3.91%(+1.79)#413 | 1.10%(+4.60)#12,618 |
| 69. | Bernardsville Borough | 5.65% | 3.91%(+1.75)#414 | 1.10%(+4.56)#12,619 |
| 70. | Kingston Estates | 5.53% | 3.91%(+1.62)#415 | 1.10%(+4.43)#13,987 |
| 71. | Somerville Borough | 5.48% | 3.91%(+1.57)#416 | 1.10%(+4.38)#13,988 |
| 72. | Secaucus | 5.40% | 3.91%(+1.50)#417 | 1.10%(+4.30)#13,989 |
| 73. | Watchung Borough | 5.38% | 3.91%(+1.47)#418 | 1.10%(+4.28)#13,990 |
| 74. | Elmwood Park Borough | 5.26% | 3.91%(+1.36)#419 | 1.10%(+4.16)#13,991 |
| 75. | Rutherford Borough | 5.24% | 3.91%(+1.34)#420 | 1.10%(+4.14)#13,992 |
| 76. | Matawan Borough | 5.11% | 3.91%(+1.21)#421 | 1.10%(+4.01)#13,993 |
| 77. | South Plainfield Borough | 5.10% | 3.91%(+1.20)#422 | 1.10%(+4.01)#13,994 |
| 78. | Port Reading | 4.80% | 3.91%(+0.896)#423 | 1.10%(+3.70)#13,995 |
| 79. | Hawthorne Borough | 4.74% | 3.91%(+0.833)#424 | 1.10%(+3.64)#13,996 |
| 80. | Lake Hiawatha | 4.73% | 3.91%(+0.824)#425 | 1.10%(+3.63)#13,997 |
| 81. | Hackettstown | 4.73% | 3.91%(+0.822)#426 | 1.10%(+3.63)#13,998 |
| 82. | New Milford Borough | 4.70% | 3.91%(+0.790)#427 | 1.10%(+3.60)#13,999 |
| 83. | Perth Amboy | 4.70% | 3.91%(+0.790)#428 | 1.10%(+3.60)#14,000 |
| 84. | Madison Borough | 4.53% | 3.91%(+0.628)#429 | 1.10%(+3.44)#14,001 |
| 85. | Middlesex Borough | 4.53% | 3.91%(+0.624)#430 | 1.10%(+3.43)#14,002 |
| 86. | Belford | 4.50% | 3.91%(+0.590)#431 | 1.10%(+3.40)#14,003 |
| 87. | Peapack And Gladstone Borough | 4.45% | 3.91%(+0.546)#432 | 1.10%(+3.35)#14,004 |
| 88. | Bayonne | 4.43% | 3.91%(+0.529)#433 | 1.10%(+3.34)#14,005 |
| 89. | Passaic | 4.42% | 3.91%(+0.511)#434 | 1.10%(+3.32)#14,006 |
| 90. | Succasunna | 4.39% | 3.91%(+0.487)#435 | 1.10%(+3.29)#14,007 |
| 91. | Dumont Borough | 4.35% | 3.91%(+0.446)#436 | 1.10%(+3.25)#14,008 |
| 92. | South River Borough | 4.31% | 3.91%(+0.404)#437 | 1.10%(+3.21)#14,009 |
| 93. | Highland Park Borough | 4.29% | 3.91%(+0.382)#438 | 1.10%(+3.19)#14,010 |
| 94. | Carteret Borough | 4.28% | 3.91%(+0.371)#439 | 1.10%(+3.18)#14,011 |
| 95. | Jersey City | 4.24% | 3.91%(+0.339)#440 | 1.10%(+3.15)#14,012 |
| 96. | Oxford | 4.24% | 3.91%(+0.338)#441 | 1.10%(+3.15)#14,013 |
| 97. | White Horse | 4.22% | 3.91%(+0.314)#442 | 1.10%(+3.12)#14,014 |
| 98. | Colonia | 4.17% | 3.91%(+0.260)#443 | 1.10%(+3.07)#14,015 |
| 99. | Riverdale Borough | 4.12% | 3.91%(+0.211)#444 | 1.10%(+3.02)#14,016 |
| 100. | Rahway | 4.11% | 3.91%(+0.207)#445 | 1.10%(+3.01)#14,017 |
Common Questions
What are the Top 10 Cities with the Highest Percentage of Immigrants from South America in New Jersey?
Top 10 Cities with the Highest Percentage of Immigrants from South America in New Jersey are:
#1
22.82%
#2
21.01%
#3
20.95%
#4
19.36%
#5
16.12%
#6
14.29%
#7
13.49%
#8
13.21%
#9
13.12%
#10
12.79%
What city has the Highest Percentage of Immigrants from South America in New Jersey?
Kearny has the Highest Percentage of Immigrants from South America in New Jersey with 22.82%.
What is the Percentage of Immigrants from South America in the State of New Jersey?
Percentage of Immigrants from South America in New Jersey is 3.91%.
What is the Percentage of Immigrants from South America in the United States?
Percentage of Immigrants from South America in the United States is 1.10%.