Cities with the Highest Percentage of Immigrants from El Salvador in New Jersey
RELATED REPORTS & OPTIONS
El Salvador
New Jersey
Compare Cities
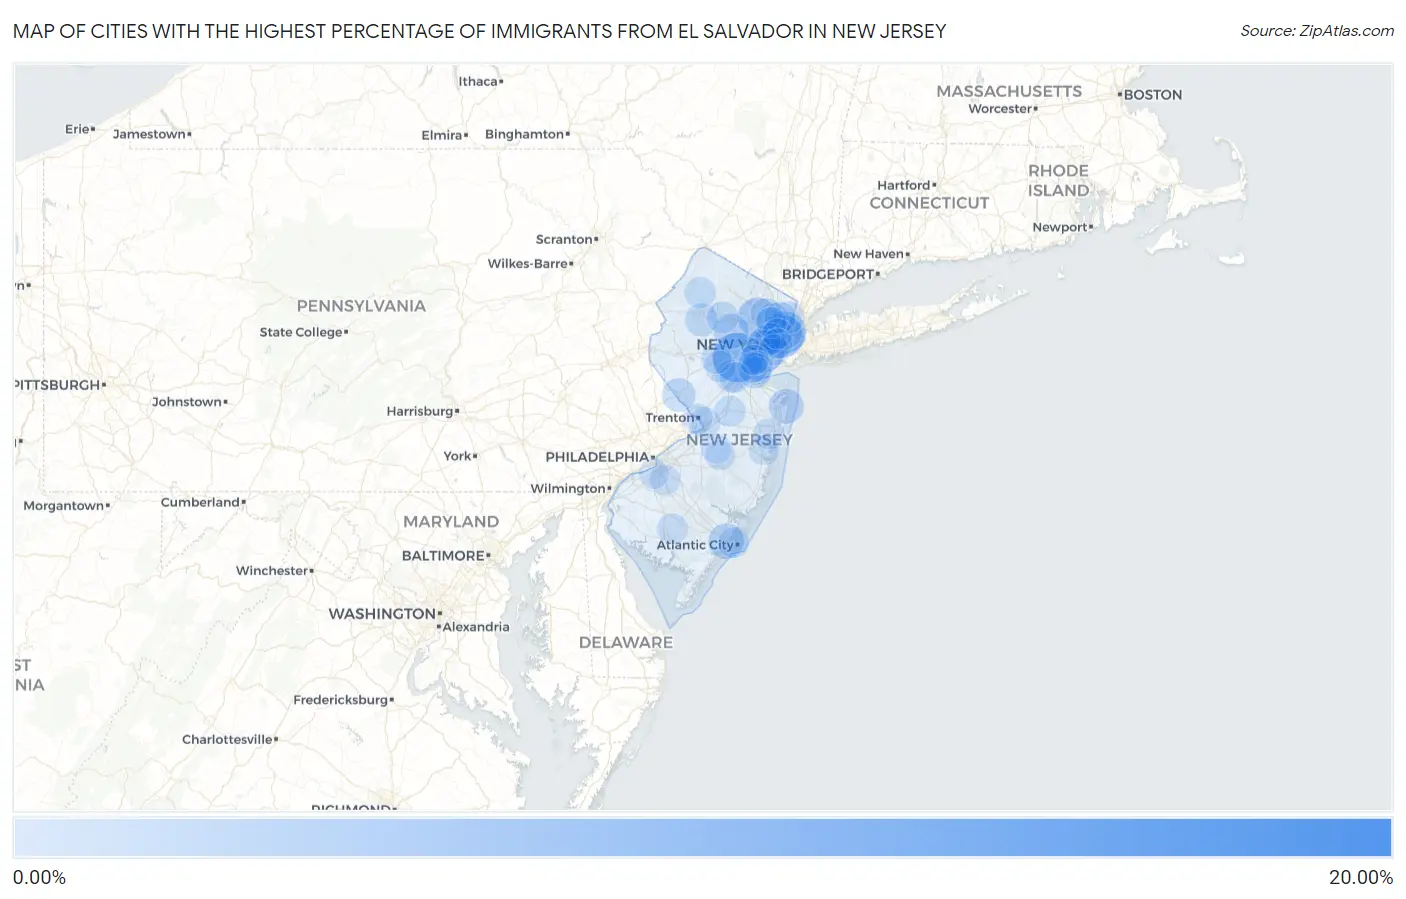
Map of Cities with the Highest Percentage of Immigrants from El Salvador in New Jersey
0.00%
20.00%
Cities with the Highest Percentage of Immigrants from El Salvador in New Jersey
| City | El Salvador | vs State | vs National | |
| 1. | West Berlin | 15.97% | 0.53%(+15.4)#-1 | 0.43%(+15.5)#0 |
| 2. | Plainfield | 8.22% | 0.53%(+7.69)#52 | 0.43%(+7.79)#647 |
| 3. | Fairview Borough | 8.10% | 0.53%(+7.57)#53 | 0.43%(+7.67)#648 |
| 4. | Gillette | 7.13% | 0.53%(+6.60)#54 | 0.43%(+6.71)#649 |
| 5. | Absecon Highlands | 6.15% | 0.53%(+5.62)#55 | 0.43%(+5.72)#650 |
| 6. | Union City | 5.39% | 0.53%(+4.86)#81 | 0.43%(+4.96)#977 |
| 7. | West New York | 5.30% | 0.53%(+4.77)#119 | 0.43%(+4.88)#1,348 |
| 8. | Elizabeth | 5.06% | 0.53%(+4.53)#120 | 0.43%(+4.63)#1,349 |
| 9. | North Plainfield Borough | 5.05% | 0.53%(+4.52)#121 | 0.43%(+4.62)#1,350 |
| 10. | Dunellen Borough | 4.96% | 0.53%(+4.43)#122 | 0.43%(+4.54)#1,351 |
| 11. | Flemington Borough | 4.34% | 0.53%(+3.81)#123 | 0.43%(+3.91)#1,352 |
| 12. | Singac | 4.19% | 0.53%(+3.66)#124 | 0.43%(+3.76)#1,353 |
| 13. | Lindenwold Borough | 3.73% | 0.53%(+3.20)#125 | 0.43%(+3.30)#1,354 |
| 14. | Northvale Borough | 3.29% | 0.53%(+2.76)#126 | 0.43%(+2.87)#1,355 |
| 15. | Middlesex Borough | 2.71% | 0.53%(+2.18)#127 | 0.43%(+2.29)#1,356 |
| 16. | Pleasantville | 2.56% | 0.53%(+2.03)#128 | 0.43%(+2.14)#1,357 |
| 17. | Red Bank Borough | 2.46% | 0.53%(+1.93)#129 | 0.43%(+2.04)#1,358 |
| 18. | Morristown | 2.35% | 0.53%(+1.82)#130 | 0.43%(+1.92)#1,359 |
| 19. | Pleasantdale | 2.32% | 0.53%(+1.79)#131 | 0.43%(+1.89)#1,360 |
| 20. | Victory Gardens Borough | 2.27% | 0.53%(+1.74)#132 | 0.43%(+1.85)#1,361 |
| 21. | Long Branch | 2.22% | 0.53%(+1.69)#133 | 0.43%(+1.79)#1,362 |
| 22. | Hightstown Borough | 1.96% | 0.53%(+1.43)#134 | 0.43%(+1.54)#1,363 |
| 23. | Franklin Borough | 1.80% | 0.53%(+1.28)#135 | 0.43%(+1.38)#1,364 |
| 24. | Guttenberg | 1.75% | 0.53%(+1.22)#136 | 0.43%(+1.33)#1,365 |
| 25. | Lambertville | 1.65% | 0.53%(+1.12)#137 | 0.43%(+1.22)#1,366 |
| 26. | Dividing Creek | 1.53% | 0.53%(+0.998)#138 | 0.43%(+1.10)#1,367 |
| 27. | Budd Lake | 1.40% | 0.53%(+0.874)#139 | 0.43%(+0.977)#1,368 |
| 28. | Roselle Borough | 1.34% | 0.53%(+0.814)#140 | 0.43%(+0.917)#1,369 |
| 29. | Highlands Borough | 1.33% | 0.53%(+0.806)#141 | 0.43%(+0.909)#1,370 |
| 30. | Linden | 1.33% | 0.53%(+0.801)#142 | 0.43%(+0.904)#1,371 |
| 31. | Hopelawn | 1.31% | 0.53%(+0.777)#143 | 0.43%(+0.880)#1,372 |
| 32. | East Franklin | 1.21% | 0.53%(+0.685)#144 | 0.43%(+0.789)#1,373 |
| 33. | East Newark Borough | 1.18% | 0.53%(+0.649)#145 | 0.43%(+0.752)#1,374 |
| 34. | Franklinville | 1.17% | 0.53%(+0.644)#146 | 0.43%(+0.747)#1,375 |
| 35. | Cliffside Park Borough | 1.12% | 0.53%(+0.587)#147 | 0.43%(+0.690)#1,376 |
| 36. | Bound Brook Borough | 1.11% | 0.53%(+0.580)#148 | 0.43%(+0.683)#1,377 |
| 37. | Manville Borough | 1.10% | 0.53%(+0.573)#149 | 0.43%(+0.676)#1,378 |
| 38. | Sewaren | 1.08% | 0.53%(+0.548)#150 | 0.43%(+0.651)#1,379 |
| 39. | Roselle Park Borough | 1.07% | 0.53%(+0.538)#151 | 0.43%(+0.642)#1,380 |
| 40. | Stockton Borough | 1.05% | 0.53%(+0.524)#152 | 0.43%(+0.627)#1,381 |
| 41. | Perth Amboy | 1.05% | 0.53%(+0.518)#153 | 0.43%(+0.621)#1,382 |
| 42. | Englewood | 1.04% | 0.53%(+0.512)#154 | 0.43%(+0.616)#1,417 |
| 43. | Bloomingdale Borough | 1.02% | 0.53%(+0.494)#155 | 0.43%(+0.597)#1,418 |
| 44. | Garfield | 1.01% | 0.53%(+0.478)#156 | 0.43%(+0.582)#1,419 |
| 45. | Harrison | 0.97% | 0.53%(+0.439)#157 | 0.43%(+0.543)#1,420 |
| 46. | Dover | 0.97% | 0.53%(+0.437)#158 | 0.43%(+0.541)#1,421 |
| 47. | South Bound Brook Borough | 0.93% | 0.53%(+0.402)#159 | 0.43%(+0.505)#1,422 |
| 48. | Bogota Borough | 0.92% | 0.53%(+0.389)#160 | 0.43%(+0.492)#1,423 |
| 49. | Eatontown Borough | 0.89% | 0.53%(+0.366)#161 | 0.43%(+0.469)#1,424 |
| 50. | Newton | 0.88% | 0.53%(+0.356)#162 | 0.43%(+0.459)#1,425 |
| 51. | Spring Lake Heights Borough | 0.88% | 0.53%(+0.356)#163 | 0.43%(+0.459)#1,426 |
| 52. | Leonia Borough | 0.87% | 0.53%(+0.345)#164 | 0.43%(+0.448)#1,427 |
| 53. | Freehold Borough | 0.86% | 0.53%(+0.328)#165 | 0.43%(+0.431)#1,428 |
| 54. | Finderne | 0.82% | 0.53%(+0.288)#166 | 0.43%(+0.391)#1,429 |
| 55. | High Bridge Borough | 0.81% | 0.53%(+0.285)#167 | 0.43%(+0.388)#1,430 |
| 56. | Berlin Borough | 0.80% | 0.53%(+0.273)#168 | 0.43%(+0.376)#1,431 |
| 57. | Palisades Park Borough | 0.80% | 0.53%(+0.272)#169 | 0.43%(+0.375)#1,632 |
| 58. | Kearny | 0.78% | 0.53%(+0.251)#170 | 0.43%(+0.355)#1,633 |
| 59. | Newark | 0.77% | 0.53%(+0.242)#171 | 0.43%(+0.345)#1,634 |
| 60. | Paterson | 0.75% | 0.53%(+0.225)#172 | 0.43%(+0.328)#1,635 |
| 61. | Hackensack | 0.74% | 0.53%(+0.212)#173 | 0.43%(+0.315)#1,636 |
| 62. | Twin Rivers | 0.69% | 0.53%(+0.159)#174 | 0.43%(+0.262)#1,637 |
| 63. | Shrewsbury Borough | 0.68% | 0.53%(+0.148)#175 | 0.43%(+0.251)#1,638 |
| 64. | Waldwick Borough | 0.68% | 0.53%(+0.147)#176 | 0.43%(+0.250)#1,639 |
| 65. | White Horse | 0.64% | 0.53%(+0.111)#177 | 0.43%(+0.214)#1,640 |
| 66. | Macopin | 0.63% | 0.53%(+0.106)#178 | 0.43%(+0.209)#1,641 |
| 67. | Ampere North | 0.62% | 0.53%(+0.091)#179 | 0.43%(+0.194)#1,642 |
| 68. | Vineland | 0.61% | 0.53%(+0.077)#180 | 0.43%(+0.180)#1,643 |
| 69. | Passaic | 0.60% | 0.53%(+0.074)#181 | 0.43%(+0.177)#1,644 |
| 70. | Bayonne | 0.58% | 0.53%(+0.054)#182 | 0.43%(+0.158)#1,645 |
| 71. | Highland Park Borough | 0.58% | 0.53%(+0.052)#183 | 0.43%(+0.155)#1,646 |
| 72. | South Plainfield Borough | 0.57% | 0.53%(+0.044)#184 | 0.43%(+0.147)#1,647 |
| 73. | Port Reading | 0.57% | 0.53%(+0.041)#185 | 0.43%(+0.144)#1,648 |
| 74. | Lodi Borough | 0.52% | 0.53%(-0.005)#186 | 0.43%(+0.098)#1,649 |
| 75. | Ramtown | 0.52% | 0.53%(-0.006)#187 | 0.43%(+0.097)#1,650 |
| 76. | Atlantic City | 0.52% | 0.53%(-0.006)#188 | 0.43%(+0.097)#1,651 |
| 77. | Somerville Borough | 0.52% | 0.53%(-0.007)#189 | 0.43%(+0.096)#1,652 |
| 78. | Woodbridge | 0.51% | 0.53%(-0.017)#190 | 0.43%(+0.086)#1,653 |
| 79. | New Brunswick | 0.51% | 0.53%(-0.019)#191 | 0.43%(+0.084)#1,654 |
| 80. | Blackwood | 0.46% | 0.53%(-0.071)#192 | 0.43%(+0.032)#1,655 |
| 81. | Secaucus | 0.44% | 0.53%(-0.091)#193 | 0.43%(+0.012)#1,656 |
| 82. | Union | 0.44% | 0.53%(-0.091)#194 | 0.43%(+0.012)#1,657 |
| 83. | Trenton | 0.43% | 0.53%(-0.097)#195 | 0.43%(+0.007)#1,658 |
| 84. | Bergenfield Borough | 0.43% | 0.53%(-0.100)#196 | 0.43%(+0.003)#1,659 |
| 85. | Green Knoll | 0.41% | 0.53%(-0.122)#197 | 0.43%(-0.018)#1,660 |
| 86. | Jersey City | 0.40% | 0.53%(-0.130)#198 | 0.43%(-0.027)#1,661 |
| 87. | South River Borough | 0.39% | 0.53%(-0.143)#199 | 0.43%(-0.040)#1,662 |
| 88. | Alpha Borough | 0.36% | 0.53%(-0.169)#200 | 0.43%(-0.065)#1,663 |
| 89. | Elmwood Park Borough | 0.35% | 0.53%(-0.176)#201 | 0.43%(-0.073)#1,664 |
| 90. | Caldwell Borough | 0.35% | 0.53%(-0.180)#202 | 0.43%(-0.077)#1,665 |
| 91. | Rahway | 0.34% | 0.53%(-0.188)#203 | 0.43%(-0.085)#1,666 |
| 92. | Hi Nella Borough | 0.34% | 0.53%(-0.189)#204 | 0.43%(-0.086)#1,667 |
| 93. | Little Ferry Borough | 0.34% | 0.53%(-0.191)#205 | 0.43%(-0.088)#1,668 |
| 94. | Glen Ridge Borough | 0.33% | 0.53%(-0.195)#206 | 0.43%(-0.092)#1,669 |
| 95. | Runnemede Borough | 0.33% | 0.53%(-0.204)#207 | 0.43%(-0.100)#1,670 |
| 96. | Toms River | 0.30% | 0.53%(-0.225)#208 | 0.43%(-0.122)#1,671 |
| 97. | Woodbury | 0.30% | 0.53%(-0.228)#209 | 0.43%(-0.125)#1,672 |
| 98. | Fort Lee Borough | 0.30% | 0.53%(-0.230)#210 | 0.43%(-0.126)#1,673 |
| 99. | Browns Mills | 0.30% | 0.53%(-0.230)#211 | 0.43%(-0.127)#1,674 |
| 100. | Fort Dix | 0.30% | 0.53%(-0.233)#212 | 0.43%(-0.130)#1,675 |
Common Questions
What are the Top 10 Cities with the Highest Percentage of Immigrants from El Salvador in New Jersey?
Top 10 Cities with the Highest Percentage of Immigrants from El Salvador in New Jersey are:
#1
8.22%
#2
5.39%
#3
5.30%
#4
5.06%
#5
4.19%
#6
2.56%
#7
2.35%
#8
2.22%
#9
1.75%
#10
1.65%
What city has the Highest Percentage of Immigrants from El Salvador in New Jersey?
Plainfield has the Highest Percentage of Immigrants from El Salvador in New Jersey with 8.22%.
What is the Percentage of Immigrants from El Salvador in the State of New Jersey?
Percentage of Immigrants from El Salvador in New Jersey is 0.53%.
What is the Percentage of Immigrants from El Salvador in the United States?
Percentage of Immigrants from El Salvador in the United States is 0.43%.