Cities with the Highest Percentage of Population Employed in Public Administration in New Jersey
RELATED REPORTS & OPTIONS
Public Administration
New Jersey
Compare Cities
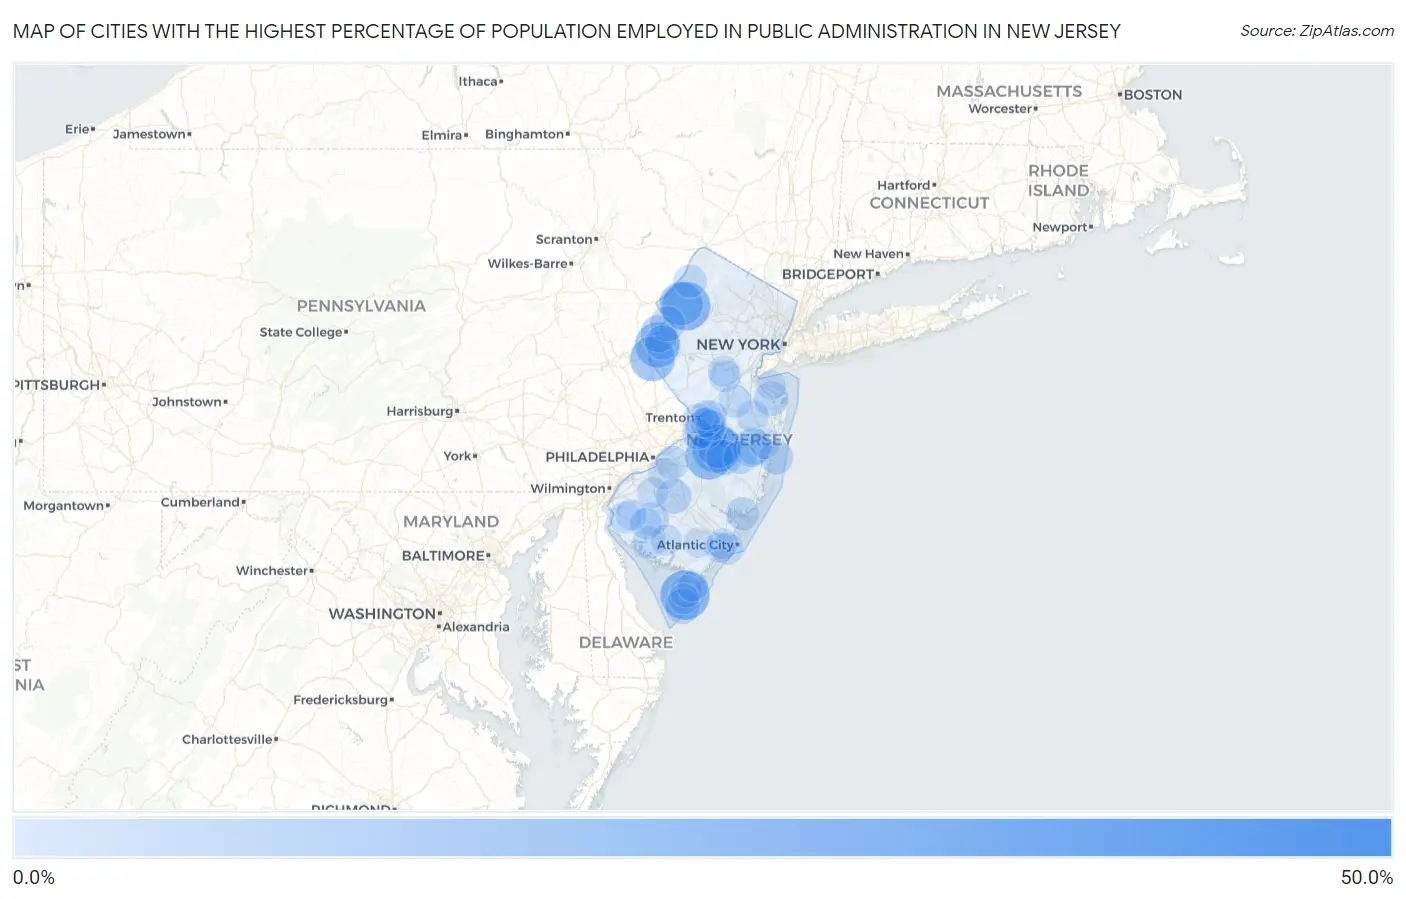
Map of Cities with the Highest Percentage of Population Employed in Public Administration in New Jersey
0.0%
50.0%
Cities with the Highest Percentage of Population Employed in Public Administration in New Jersey
| City | % Employed | vs State | vs National | |
| 1. | Delmont | 40.9% | 4.3%(+36.5)#1 | 4.7%(+36.2)#251 |
| 2. | Renaissance At Monroe | 40.4% | 4.3%(+36.1)#2 | 4.7%(+35.7)#256 |
| 3. | Dutch Neck | 37.7% | 4.3%(+33.4)#3 | 4.7%(+33.0)#301 |
| 4. | Port Elizabeth | 37.2% | 4.3%(+32.8)#4 | 4.7%(+32.5)#313 |
| 5. | Goshen | 31.2% | 4.3%(+26.8)#5 | 4.7%(+26.5)#439 |
| 6. | Oceanville | 26.6% | 4.3%(+22.2)#6 | 4.7%(+21.9)#632 |
| 7. | Cumberland-Hesstown | 25.0% | 4.3%(+20.7)#7 | 4.7%(+20.3)#727 |
| 8. | Rio Grande | 24.0% | 4.3%(+19.6)#8 | 4.7%(+19.3)#822 |
| 9. | Leesburg | 23.6% | 4.3%(+19.2)#9 | 4.7%(+18.9)#856 |
| 10. | Johnsonburg | 23.2% | 4.3%(+18.8)#10 | 4.7%(+18.5)#885 |
| 11. | Fort Dix | 22.6% | 4.3%(+18.3)#11 | 4.7%(+17.9)#925 |
| 12. | Pemberton Heights | 21.7% | 4.3%(+17.3)#12 | 4.7%(+17.0)#1,005 |
| 13. | Mizpah | 20.6% | 4.3%(+16.3)#13 | 4.7%(+15.9)#1,118 |
| 14. | Upper Stewartsville | 20.3% | 4.3%(+15.9)#14 | 4.7%(+15.6)#1,156 |
| 15. | Finesville | 20.1% | 4.3%(+15.8)#15 | 4.7%(+15.5)#1,170 |
| 16. | Sea Girt Borough | 19.9% | 4.3%(+15.5)#16 | 4.7%(+15.2)#1,221 |
| 17. | Marksboro | 19.1% | 4.3%(+14.8)#17 | 4.7%(+14.4)#1,318 |
| 18. | Mcguire Afb | 19.0% | 4.3%(+14.6)#18 | 4.7%(+14.3)#1,340 |
| 19. | Centre Grove | 18.4% | 4.3%(+14.1)#19 | 4.7%(+13.8)#1,405 |
| 20. | Pemberton Borough | 17.6% | 4.3%(+13.3)#20 | 4.7%(+12.9)#1,549 |
| 21. | Milmay | 16.2% | 4.3%(+11.9)#21 | 4.7%(+11.5)#1,814 |
| 22. | Stonebridge | 16.0% | 4.3%(+11.6)#22 | 4.7%(+11.3)#1,869 |
| 23. | Bordentown | 15.7% | 4.3%(+11.3)#23 | 4.7%(+11.0)#1,938 |
| 24. | Sweetwater | 15.2% | 4.3%(+10.9)#24 | 4.7%(+10.5)#2,060 |
| 25. | Leisure Knoll | 14.9% | 4.3%(+10.6)#25 | 4.7%(+10.2)#2,149 |
| 26. | Pine Beach Borough | 14.5% | 4.3%(+10.2)#26 | 4.7%(+9.84)#2,272 |
| 27. | Dividing Creek | 14.5% | 4.3%(+10.1)#27 | 4.7%(+9.78)#2,294 |
| 28. | Union | 14.0% | 4.3%(+9.62)#28 | 4.7%(+9.28)#2,477 |
| 29. | Hutchinson | 13.7% | 4.3%(+9.35)#29 | 4.7%(+9.01)#2,577 |
| 30. | Teterboro Borough | 13.2% | 4.3%(+8.81)#30 | 4.7%(+8.47)#2,797 |
| 31. | Silver Lake | 12.7% | 4.3%(+8.30)#31 | 4.7%(+7.97)#2,959 |
| 32. | English Creek | 12.4% | 4.3%(+8.01)#32 | 4.7%(+7.67)#3,082 |
| 33. | Arrowhead Lake | 12.3% | 4.3%(+7.93)#33 | 4.7%(+7.60)#3,117 |
| 34. | Country Lake Estates | 12.2% | 4.3%(+7.87)#34 | 4.7%(+7.54)#3,146 |
| 35. | Williamstown | 12.1% | 4.3%(+7.77)#35 | 4.7%(+7.44)#3,216 |
| 36. | Cape May | 12.1% | 4.3%(+7.71)#36 | 4.7%(+7.38)#3,243 |
| 37. | Bridgeville | 12.0% | 4.3%(+7.68)#37 | 4.7%(+7.34)#3,252 |
| 38. | Cologne | 12.0% | 4.3%(+7.64)#38 | 4.7%(+7.31)#3,269 |
| 39. | Glen Gardner Borough | 11.7% | 4.3%(+7.38)#39 | 4.7%(+7.04)#3,402 |
| 40. | Lincroft | 11.7% | 4.3%(+7.32)#40 | 4.7%(+6.98)#3,435 |
| 41. | New Village | 11.6% | 4.3%(+7.26)#41 | 4.7%(+6.92)#3,470 |
| 42. | Silver Lake Cdp Warren County | 11.5% | 4.3%(+7.17)#42 | 4.7%(+6.83)#3,526 |
| 43. | Dorothy | 11.5% | 4.3%(+7.14)#43 | 4.7%(+6.80)#3,540 |
| 44. | Dover Beaches South | 11.0% | 4.3%(+6.64)#44 | 4.7%(+6.30)#3,808 |
| 45. | West Park | 10.9% | 4.3%(+6.52)#45 | 4.7%(+6.18)#3,880 |
| 46. | Palermo | 10.7% | 4.3%(+6.39)#46 | 4.7%(+6.05)#3,965 |
| 47. | Rainbow Lakes | 10.6% | 4.3%(+6.25)#47 | 4.7%(+5.92)#4,065 |
| 48. | Mystic Island | 10.5% | 4.3%(+6.14)#48 | 4.7%(+5.81)#4,146 |
| 49. | Crandon Lakes | 10.5% | 4.3%(+6.11)#49 | 4.7%(+5.77)#4,168 |
| 50. | Cedar Glen Lakes | 10.4% | 4.3%(+6.10)#50 | 4.7%(+5.76)#4,174 |
| 51. | Mickleton | 10.4% | 4.3%(+6.09)#51 | 4.7%(+5.76)#4,182 |
| 52. | Olivet | 10.4% | 4.3%(+6.06)#52 | 4.7%(+5.73)#4,204 |
| 53. | Milltown Borough | 10.4% | 4.3%(+6.01)#53 | 4.7%(+5.68)#4,227 |
| 54. | Fairton | 10.4% | 4.3%(+6.01)#54 | 4.7%(+5.68)#4,228 |
| 55. | Kingston Estates | 10.3% | 4.3%(+5.99)#55 | 4.7%(+5.65)#4,245 |
| 56. | Bargaintown | 10.2% | 4.3%(+5.86)#56 | 4.7%(+5.53)#4,324 |
| 57. | Whittingham | 10.2% | 4.3%(+5.84)#57 | 4.7%(+5.50)#4,351 |
| 58. | West Freehold | 10.2% | 4.3%(+5.84)#58 | 4.7%(+5.50)#4,352 |
| 59. | Tuckerton Borough | 10.2% | 4.3%(+5.83)#59 | 4.7%(+5.49)#4,357 |
| 60. | Leisure Village West | 10.0% | 4.3%(+5.67)#60 | 4.7%(+5.34)#4,456 |
| 61. | Whitesboro | 9.8% | 4.3%(+5.40)#61 | 4.7%(+5.07)#4,681 |
| 62. | Allentown Borough | 9.7% | 4.3%(+5.30)#62 | 4.7%(+4.97)#4,754 |
| 63. | Margate City | 9.6% | 4.3%(+5.22)#63 | 4.7%(+4.88)#4,811 |
| 64. | Quinton | 9.5% | 4.3%(+5.16)#64 | 4.7%(+4.82)#4,873 |
| 65. | Wenonah Borough | 9.5% | 4.3%(+5.12)#65 | 4.7%(+4.79)#4,891 |
| 66. | Seabrook Farms | 9.4% | 4.3%(+5.09)#66 | 4.7%(+4.76)#4,920 |
| 67. | Yardville | 9.4% | 4.3%(+5.08)#67 | 4.7%(+4.74)#4,935 |
| 68. | Middlebush | 9.4% | 4.3%(+5.06)#68 | 4.7%(+4.73)#4,944 |
| 69. | Ampere North | 9.4% | 4.3%(+5.06)#69 | 4.7%(+4.73)#4,945 |
| 70. | Hamilton Square | 9.3% | 4.3%(+4.94)#70 | 4.7%(+4.61)#5,038 |
| 71. | Millville | 9.2% | 4.3%(+4.88)#71 | 4.7%(+4.54)#5,095 |
| 72. | Glendora | 9.2% | 4.3%(+4.86)#72 | 4.7%(+4.53)#5,109 |
| 73. | Alloway | 9.1% | 4.3%(+4.74)#73 | 4.7%(+4.41)#5,198 |
| 74. | Franklin Center | 9.1% | 4.3%(+4.72)#74 | 4.7%(+4.38)#5,240 |
| 75. | Richwood | 9.1% | 4.3%(+4.71)#75 | 4.7%(+4.38)#5,250 |
| 76. | Marshallville | 9.0% | 4.3%(+4.67)#76 | 4.7%(+4.34)#5,275 |
| 77. | Surf City Borough | 9.0% | 4.3%(+4.63)#77 | 4.7%(+4.29)#5,316 |
| 78. | Chesilhurst Borough | 8.8% | 4.3%(+4.48)#78 | 4.7%(+4.15)#5,457 |
| 79. | Woodstown Borough | 8.8% | 4.3%(+4.42)#79 | 4.7%(+4.08)#5,522 |
| 80. | Roebling | 8.8% | 4.3%(+4.40)#80 | 4.7%(+4.07)#5,537 |
| 81. | Cookstown | 8.7% | 4.3%(+4.39)#81 | 4.7%(+4.06)#5,551 |
| 82. | Pluckemin | 8.7% | 4.3%(+4.35)#82 | 4.7%(+4.01)#5,601 |
| 83. | Marmora | 8.6% | 4.3%(+4.25)#83 | 4.7%(+3.92)#5,695 |
| 84. | Wrightstown Borough | 8.6% | 4.3%(+4.22)#84 | 4.7%(+3.89)#5,724 |
| 85. | Northfield | 8.6% | 4.3%(+4.21)#85 | 4.7%(+3.87)#5,740 |
| 86. | Erma | 8.5% | 4.3%(+4.13)#86 | 4.7%(+3.79)#5,825 |
| 87. | Crosswicks | 8.5% | 4.3%(+4.12)#87 | 4.7%(+3.78)#5,834 |
| 88. | Trenton | 8.4% | 4.3%(+4.05)#88 | 4.7%(+3.72)#5,913 |
| 89. | Stirling | 8.4% | 4.3%(+4.03)#89 | 4.7%(+3.70)#5,937 |
| 90. | Leisure Village | 8.4% | 4.3%(+4.01)#90 | 4.7%(+3.67)#5,961 |
| 91. | Groveville | 8.3% | 4.3%(+4.00)#91 | 4.7%(+3.66)#5,967 |
| 92. | Cape May Court House | 8.3% | 4.3%(+3.91)#92 | 4.7%(+3.57)#6,073 |
| 93. | Linwood | 8.2% | 4.3%(+3.89)#93 | 4.7%(+3.55)#6,091 |
| 94. | Estell Manor | 8.2% | 4.3%(+3.87)#94 | 4.7%(+3.53)#6,113 |
| 95. | Mercerville | 8.1% | 4.3%(+3.79)#95 | 4.7%(+3.45)#6,210 |
| 96. | Mckee | 8.1% | 4.3%(+3.72)#96 | 4.7%(+3.39)#6,273 |
| 97. | Neshanic Station | 8.1% | 4.3%(+3.72)#97 | 4.7%(+3.38)#6,277 |
| 98. | North Middletown | 8.0% | 4.3%(+3.61)#98 | 4.7%(+3.28)#6,401 |
| 99. | Stanhope Borough | 7.9% | 4.3%(+3.58)#99 | 4.7%(+3.25)#6,441 |
| 100. | White Horse | 7.9% | 4.3%(+3.55)#100 | 4.7%(+3.21)#6,473 |
Common Questions
What are the Top 10 Cities with the Highest Percentage of Population Employed in Public Administration in New Jersey?
Top 10 Cities with the Highest Percentage of Population Employed in Public Administration in New Jersey are:
#1
24.0%
#2
23.2%
#3
22.6%
#4
21.7%
#5
20.3%
#6
20.1%
#7
19.1%
#8
19.0%
#9
15.7%
#10
14.9%
What city has the Highest Percentage of Population Employed in Public Administration in New Jersey?
Rio Grande has the Highest Percentage of Population Employed in Public Administration in New Jersey with 24.0%.
What is the Percentage of Population Employed in Public Administration in the State of New Jersey?
Percentage of Population Employed in Public Administration in New Jersey is 4.3%.
What is the Percentage of Population Employed in Public Administration in the United States?
Percentage of Population Employed in Public Administration in the United States is 4.7%.