Seaside Heights borough, NJ Map & Demographics
Seaside Heights borough Overview
$38,232
PER CAPITA INCOME
$51,364
AVG HOUSEHOLD INCOME
6.4%
WAGE / INCOME GAP [ % ]
93.6¢/ $1
WAGE / INCOME GAP [ $ ]
0.57
INEQUALITY / GINI INDEX
2,027
TOTAL POPULATION
1,291
MALE POPULATION
736
FEMALE POPULATION
175.41
MALES / 100 FEMALES
57.01
FEMALES / 100 MALES
47.4
MEDIAN AGE
2.7
AVG FAMILY SIZE
1.9
AVG HOUSEHOLD SIZE
805
LABOR FORCE [ PEOPLE ]
46.3%
PERCENT IN LABOR FORCE
5.7%
UNEMPLOYMENT RATE
Income in Seaside Heights borough
Income Overview in Seaside Heights borough
| Characteristic | Number | Measure |
| Per Capita Income | 2,027 | $38,232 |
| Median Family Income | 458 | $0 |
| Mean Family Income | 458 | $92,890 |
| Median Household Income | 1,046 | $51,364 |
| Mean Household Income | 1,046 | $72,780 |
| Income Deficit | 458 | $0 |
| Wage / Income Gap (%) | 2,027 | 6.38% |
| Wage / Income Gap ($) | 2,027 | 93.62¢ per $1 |
| Gini / Inequality Index | 2,027 | 0.57 |
Earnings by Sex in Seaside Heights borough
Average Earnings in Seaside Heights borough are $34,286, $33,510 for men and $35,795 for women, a difference of 6.4%.
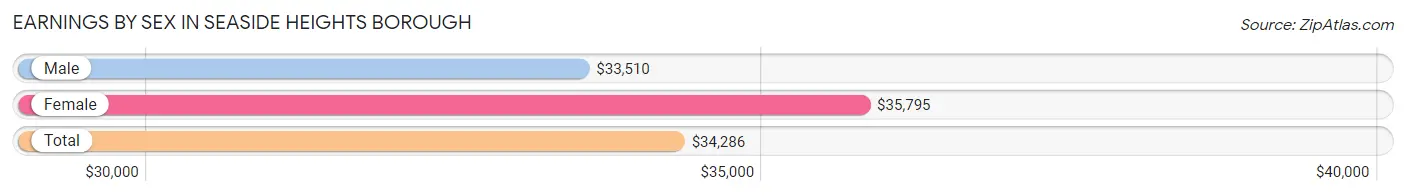
| Sex | Number | Average Earnings |
| Male | 609 (67.5%) | $33,510 |
| Female | 293 (32.5%) | $35,795 |
| Total | 902 (100.0%) | $34,286 |
Earnings by Sex by Income Bracket in Seaside Heights borough
The most common earnings brackets in Seaside Heights borough are $100,000+ for men (168 | 27.6%) and $35,000 to $39,999 for women (55 | 18.8%).
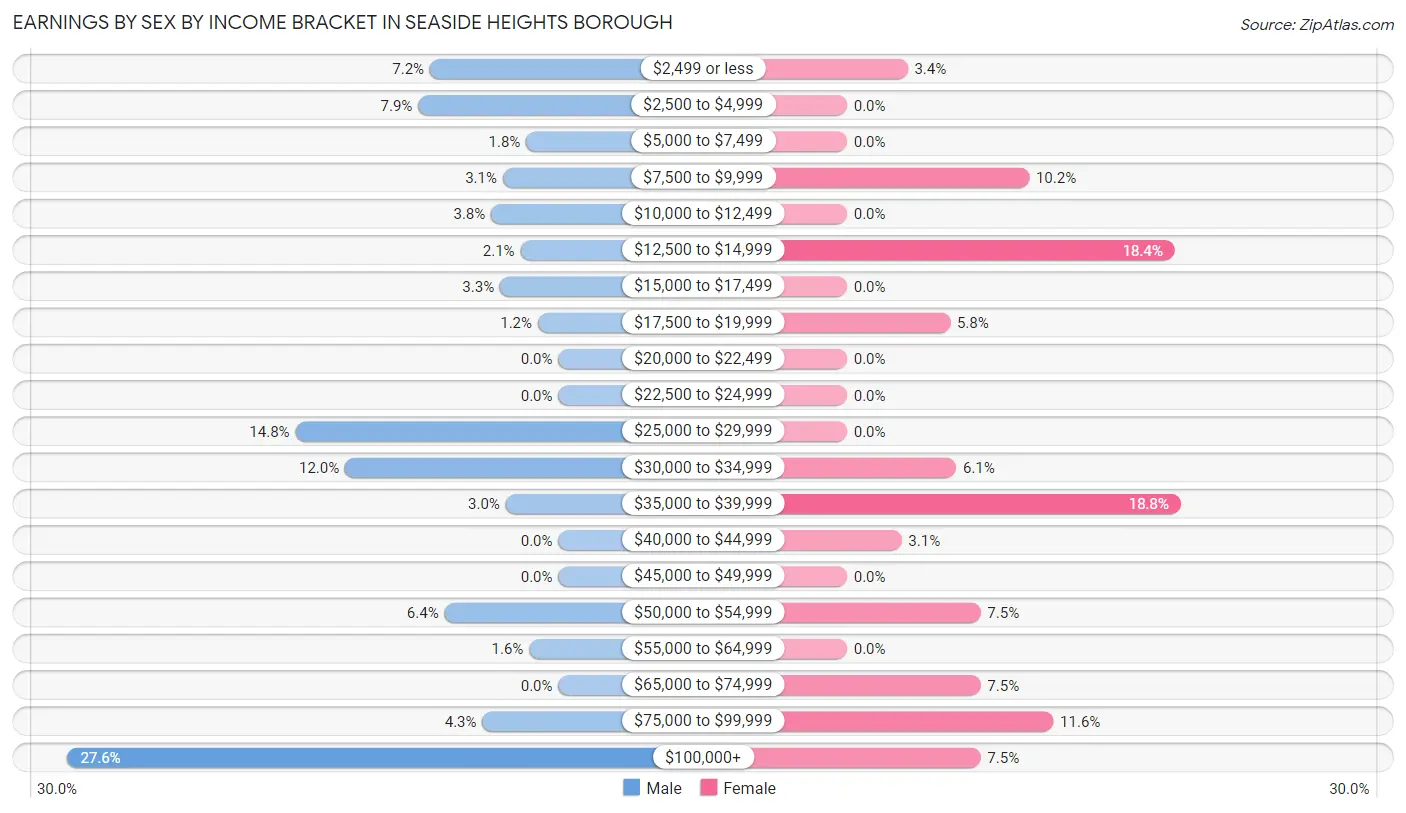
| Income | Male | Female |
| $2,499 or less | 44 (7.2%) | 10 (3.4%) |
| $2,500 to $4,999 | 48 (7.9%) | 0 (0.0%) |
| $5,000 to $7,499 | 11 (1.8%) | 0 (0.0%) |
| $7,500 to $9,999 | 19 (3.1%) | 30 (10.2%) |
| $10,000 to $12,499 | 23 (3.8%) | 0 (0.0%) |
| $12,500 to $14,999 | 13 (2.1%) | 54 (18.4%) |
| $15,000 to $17,499 | 20 (3.3%) | 0 (0.0%) |
| $17,500 to $19,999 | 7 (1.1%) | 17 (5.8%) |
| $20,000 to $22,499 | 0 (0.0%) | 0 (0.0%) |
| $22,500 to $24,999 | 0 (0.0%) | 0 (0.0%) |
| $25,000 to $29,999 | 90 (14.8%) | 0 (0.0%) |
| $30,000 to $34,999 | 73 (12.0%) | 18 (6.1%) |
| $35,000 to $39,999 | 18 (3.0%) | 55 (18.8%) |
| $40,000 to $44,999 | 0 (0.0%) | 9 (3.1%) |
| $45,000 to $49,999 | 0 (0.0%) | 0 (0.0%) |
| $50,000 to $54,999 | 39 (6.4%) | 22 (7.5%) |
| $55,000 to $64,999 | 10 (1.6%) | 0 (0.0%) |
| $65,000 to $74,999 | 0 (0.0%) | 22 (7.5%) |
| $75,000 to $99,999 | 26 (4.3%) | 34 (11.6%) |
| $100,000+ | 168 (27.6%) | 22 (7.5%) |
| Total | 609 (100.0%) | 293 (100.0%) |
Earnings by Sex by Educational Attainment in Seaside Heights borough
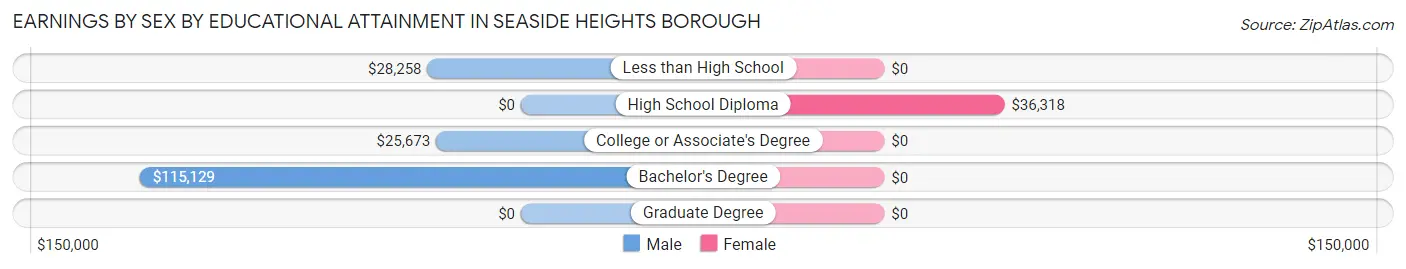
| Educational Attainment | Male Income | Female Income |
| Less than High School | $28,258 | $0 |
| High School Diploma | - | - |
| College or Associate's Degree | $25,673 | $0 |
| Bachelor's Degree | $115,129 | $0 |
| Graduate Degree | - | - |
| Total | - | - |
Family Income in Seaside Heights borough
Family Income Brackets in Seaside Heights borough
According to the Seaside Heights borough family income data, there are 169 families falling into the less than $10,000 income range, which is the most common income bracket and makes up 36.9% of all families.
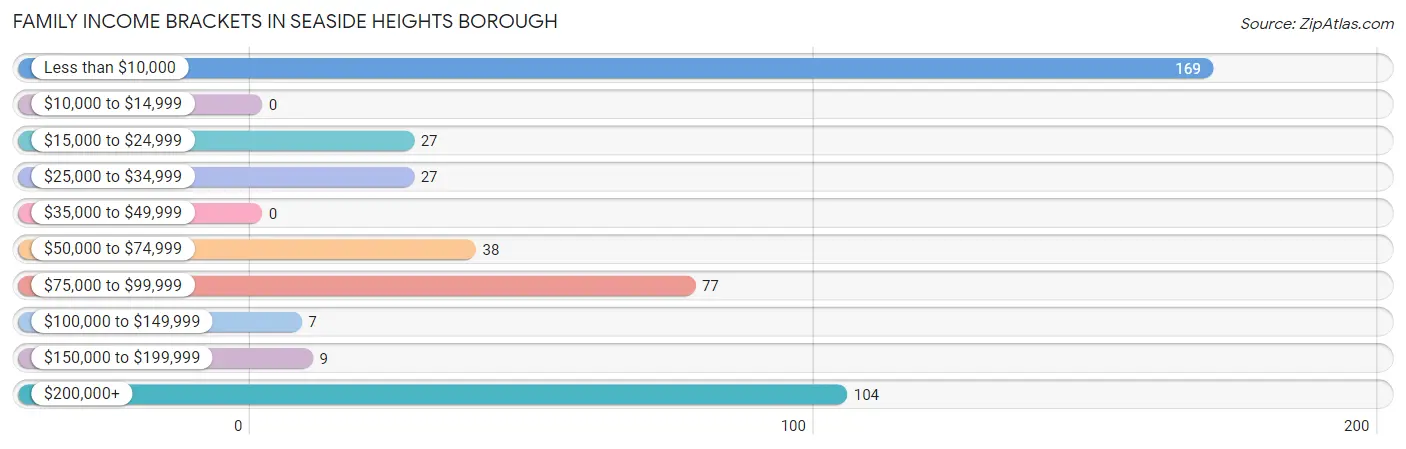
| Income Bracket | # Families | % Families |
| Less than $10,000 | 169 | 36.9% |
| $10,000 to $14,999 | 0 | 0.0% |
| $15,000 to $24,999 | 27 | 5.9% |
| $25,000 to $34,999 | 27 | 5.9% |
| $35,000 to $49,999 | 0 | 0.0% |
| $50,000 to $74,999 | 38 | 8.3% |
| $75,000 to $99,999 | 77 | 16.8% |
| $100,000 to $149,999 | 7 | 1.5% |
| $150,000 to $199,999 | 9 | 2.0% |
| $200,000+ | 104 | 22.7% |
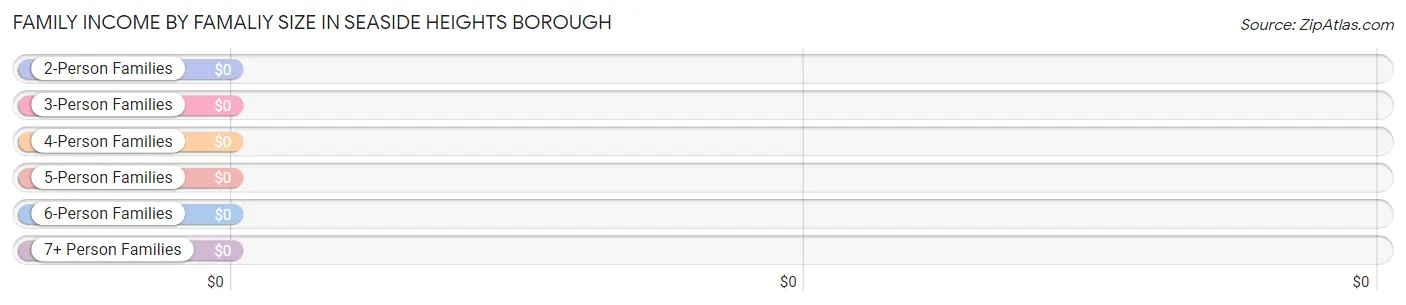
Family Income by Famaliy Size in Seaside Heights borough
| Income Bracket | # Families | Median Income |
| 2-Person Families | 223 (48.7%) | $0 |
| 3-Person Families | 200 (43.7%) | $0 |
| 4-Person Families | 0 (0.0%) | $0 |
| 5-Person Families | 35 (7.6%) | $0 |
| 6-Person Families | 0 (0.0%) | $0 |
| 7+ Person Families | 0 (0.0%) | $0 |
| Total | 458 (100.0%) | $0 |
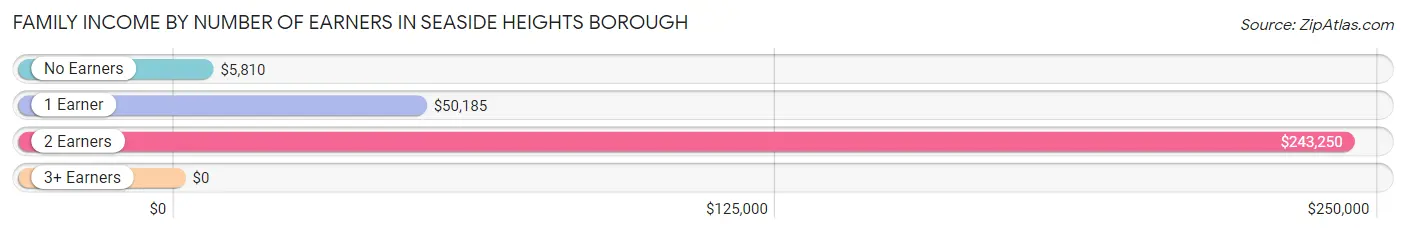
Family Income by Number of Earners in Seaside Heights borough
| Number of Earners | # Families | Median Income |
| No Earners | 192 (41.9%) | $5,810 |
| 1 Earner | 88 (19.2%) | $50,185 |
| 2 Earners | 178 (38.9%) | $243,250 |
| 3+ Earners | 0 (0.0%) | $0 |
| Total | 458 (100.0%) | $0 |
Household Income in Seaside Heights borough
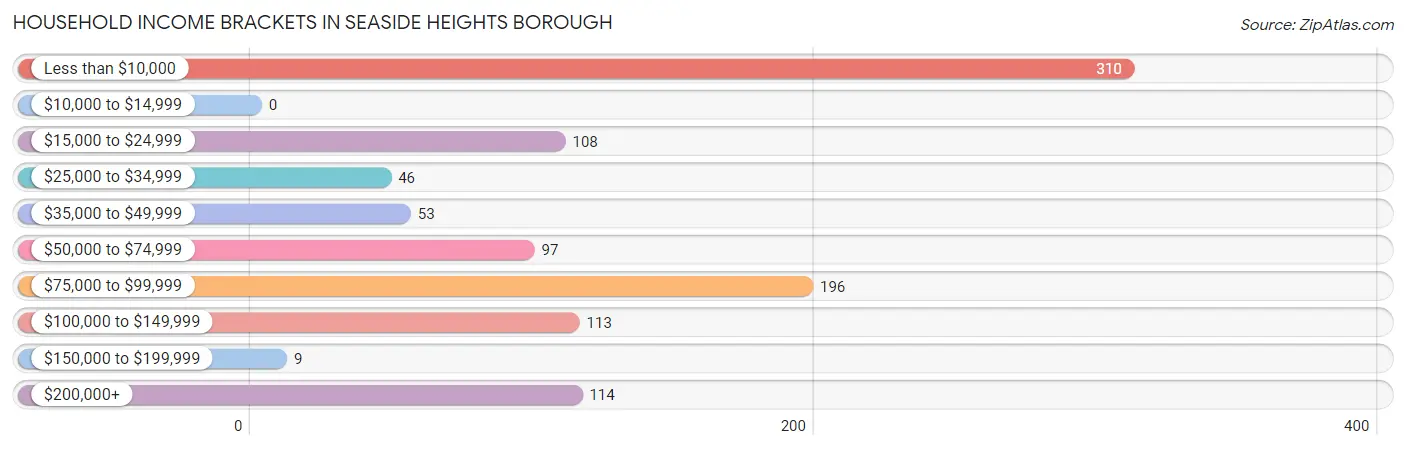
Household Income Brackets in Seaside Heights borough
With 310 households falling in the category, the less than $10,000 income range is the most frequent in Seaside Heights borough, accounting for 29.6% of all households.
| Income Bracket | # Households | % Households |
| Less than $10,000 | 310 | 29.6% |
| $10,000 to $14,999 | 0 | 0.0% |
| $15,000 to $24,999 | 108 | 10.3% |
| $25,000 to $34,999 | 46 | 4.4% |
| $35,000 to $49,999 | 53 | 5.1% |
| $50,000 to $74,999 | 97 | 9.3% |
| $75,000 to $99,999 | 196 | 18.7% |
| $100,000 to $149,999 | 113 | 10.8% |
| $150,000 to $199,999 | 9 | 0.9% |
| $200,000+ | 114 | 10.9% |
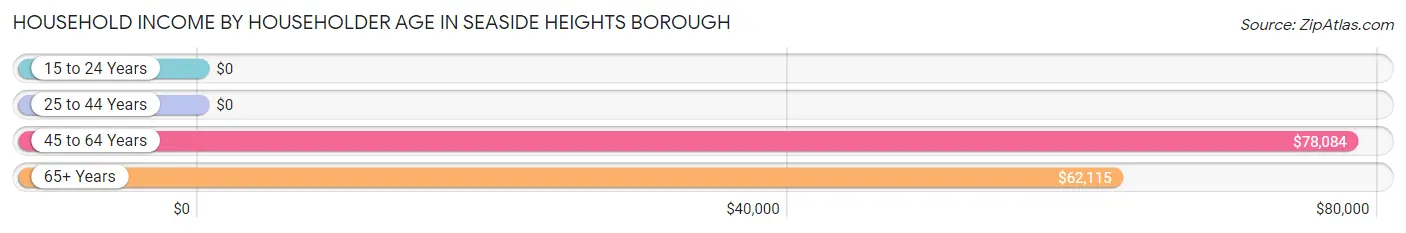
Household Income by Householder Age in Seaside Heights borough
The median household income in Seaside Heights borough is $51,364, with the highest median household income of $78,084 found in the 45 to 64 years age bracket for the primary householder. A total of 494 households (47.2%) fall into this category.
| Income Bracket | # Households | Median Income |
| 15 to 24 Years | 0 (0.0%) | $0 |
| 25 to 44 Years | 306 (29.2%) | $0 |
| 45 to 64 Years | 494 (47.2%) | $78,084 |
| 65+ Years | 246 (23.5%) | $62,115 |
| Total | 1,046 (100.0%) | $51,364 |
Poverty in Seaside Heights borough
Income Below Poverty by Sex and Age in Seaside Heights borough
With 36.4% poverty level for males and 38.6% for females among the residents of Seaside Heights borough, under 5 year old males and 6 to 11 year old females are the most vulnerable to poverty, with 92 males (100.0%) and 99 females (100.0%) in their respective age groups living below the poverty level.
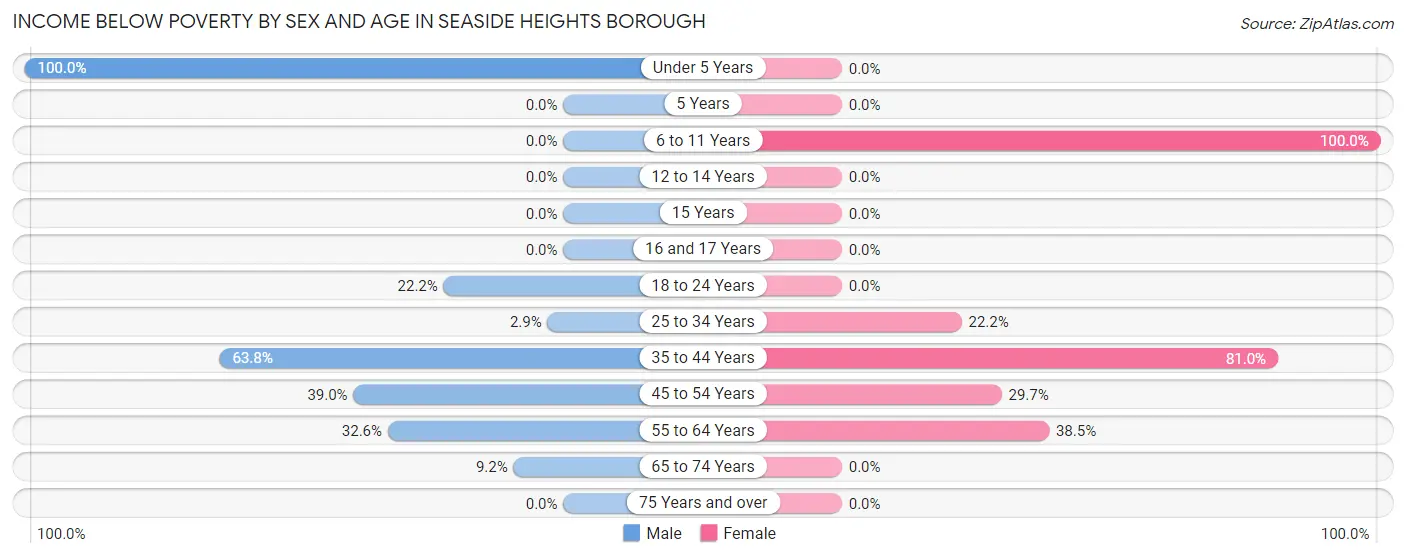
| Age Bracket | Male | Female |
| Under 5 Years | 92 (100.0%) | 0 (0.0%) |
| 5 Years | 0 (0.0%) | 0 (0.0%) |
| 6 to 11 Years | 0 (0.0%) | 99 (100.0%) |
| 12 to 14 Years | 0 (0.0%) | 0 (0.0%) |
| 15 Years | 0 (0.0%) | 0 (0.0%) |
| 16 and 17 Years | 0 (0.0%) | 0 (0.0%) |
| 18 to 24 Years | 48 (22.2%) | 0 (0.0%) |
| 25 to 34 Years | 1 (2.9%) | 10 (22.2%) |
| 35 to 44 Years | 187 (63.8%) | 51 (80.9%) |
| 45 to 54 Years | 60 (39.0%) | 59 (29.6%) |
| 55 to 64 Years | 71 (32.6%) | 65 (38.5%) |
| 65 to 74 Years | 11 (9.2%) | 0 (0.0%) |
| 75 Years and over | 0 (0.0%) | 0 (0.0%) |
| Total | 470 (36.4%) | 284 (38.6%) |
Income Above Poverty by Sex and Age in Seaside Heights borough
According to the poverty statistics in Seaside Heights borough, males aged 6 to 11 years and females aged under 5 years are the age groups that are most secure financially, with 100.0% of males and 100.0% of females in these age groups living above the poverty line.
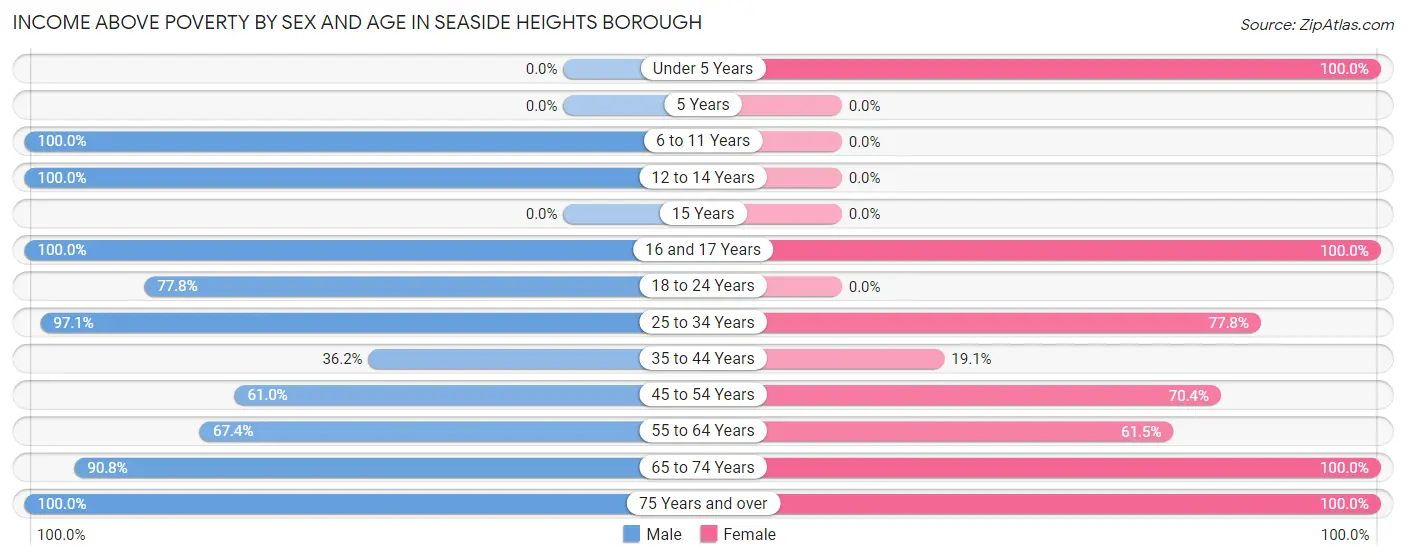
| Age Bracket | Male | Female |
| Under 5 Years | 0 (0.0%) | 16 (100.0%) |
| 5 Years | 0 (0.0%) | 0 (0.0%) |
| 6 to 11 Years | 40 (100.0%) | 0 (0.0%) |
| 12 to 14 Years | 41 (100.0%) | 0 (0.0%) |
| 15 Years | 0 (0.0%) | 0 (0.0%) |
| 16 and 17 Years | 44 (100.0%) | 10 (100.0%) |
| 18 to 24 Years | 168 (77.8%) | 0 (0.0%) |
| 25 to 34 Years | 33 (97.1%) | 35 (77.8%) |
| 35 to 44 Years | 106 (36.2%) | 12 (19.1%) |
| 45 to 54 Years | 94 (61.0%) | 140 (70.4%) |
| 55 to 64 Years | 147 (67.4%) | 104 (61.5%) |
| 65 to 74 Years | 108 (90.8%) | 96 (100.0%) |
| 75 Years and over | 40 (100.0%) | 39 (100.0%) |
| Total | 821 (63.6%) | 452 (61.4%) |
Income Below Poverty Among Married-Couple Families in Seaside Heights borough
The poverty statistics for married-couple families in Seaside Heights borough show that 25.6% or 61 of the total 238 families live below the poverty line. Families with no children have the highest poverty rate of 34.7%, comprising of 61 families. On the other hand, families with 1 or 2 children have the lowest poverty rate of 0.0%, which includes 0 families.
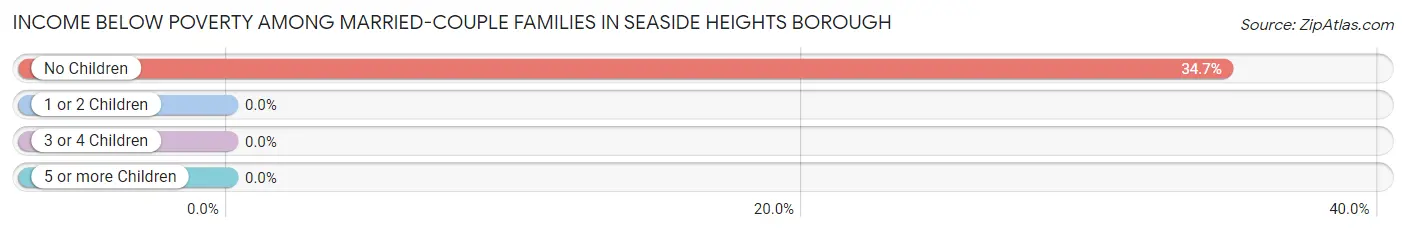
| Children | Above Poverty | Below Poverty |
| No Children | 115 (65.3%) | 61 (34.7%) |
| 1 or 2 Children | 27 (100.0%) | 0 (0.0%) |
| 3 or 4 Children | 35 (100.0%) | 0 (0.0%) |
| 5 or more Children | 0 (0.0%) | 0 (0.0%) |
| Total | 177 (74.4%) | 61 (25.6%) |
Income Below Poverty Among Single-Parent Households in Seaside Heights borough
According to the poverty data in Seaside Heights borough, 93.9% or 108 single-father households and 21.9% or 23 single-mother households are living below the poverty line. Among single-father households, those with 1 or 2 children have the highest poverty rate, with 108 households (100.0%) experiencing poverty. Likewise, among single-mother households, those with no children have the highest poverty rate, with 23 households (21.9%) falling below the poverty line.
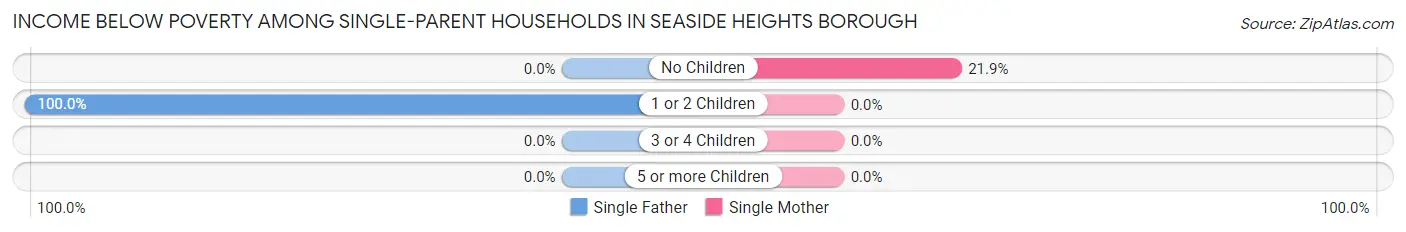
| Children | Single Father | Single Mother |
| No Children | 0 (0.0%) | 23 (21.9%) |
| 1 or 2 Children | 108 (100.0%) | 0 (0.0%) |
| 3 or 4 Children | 0 (0.0%) | 0 (0.0%) |
| 5 or more Children | 0 (0.0%) | 0 (0.0%) |
| Total | 108 (93.9%) | 23 (21.9%) |
Income Below Poverty Among Married-Couple vs Single-Parent Households in Seaside Heights borough
The poverty data for Seaside Heights borough shows that 61 of the married-couple family households (25.6%) and 131 of the single-parent households (59.6%) are living below the poverty level. Within the married-couple family households, those with no children have the highest poverty rate, with 61 households (34.7%) falling below the poverty line. Among the single-parent households, those with 1 or 2 children have the highest poverty rate, with 108 household (100.0%) living below poverty.
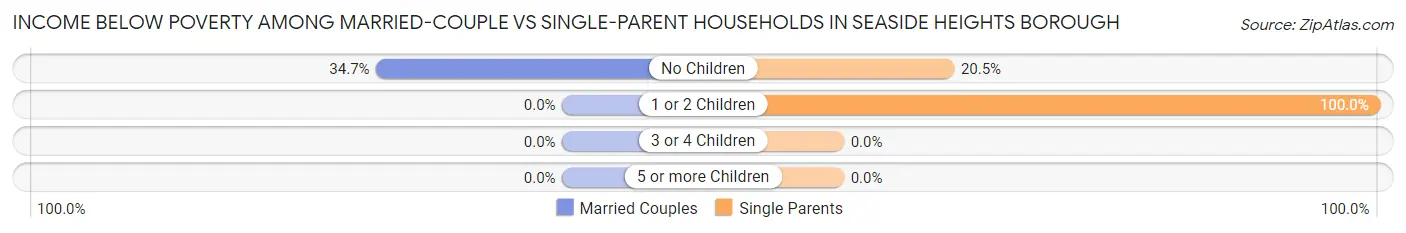
| Children | Married-Couple Families | Single-Parent Households |
| No Children | 61 (34.7%) | 23 (20.5%) |
| 1 or 2 Children | 0 (0.0%) | 108 (100.0%) |
| 3 or 4 Children | 0 (0.0%) | 0 (0.0%) |
| 5 or more Children | 0 (0.0%) | 0 (0.0%) |
| Total | 61 (25.6%) | 131 (59.6%) |
Race in Seaside Heights borough
The most populous races in Seaside Heights borough are White / Caucasian (1,825 | 90.0%), Hispanic or Latino (324 | 16.0%), and Some other Race (163 | 8.0%).
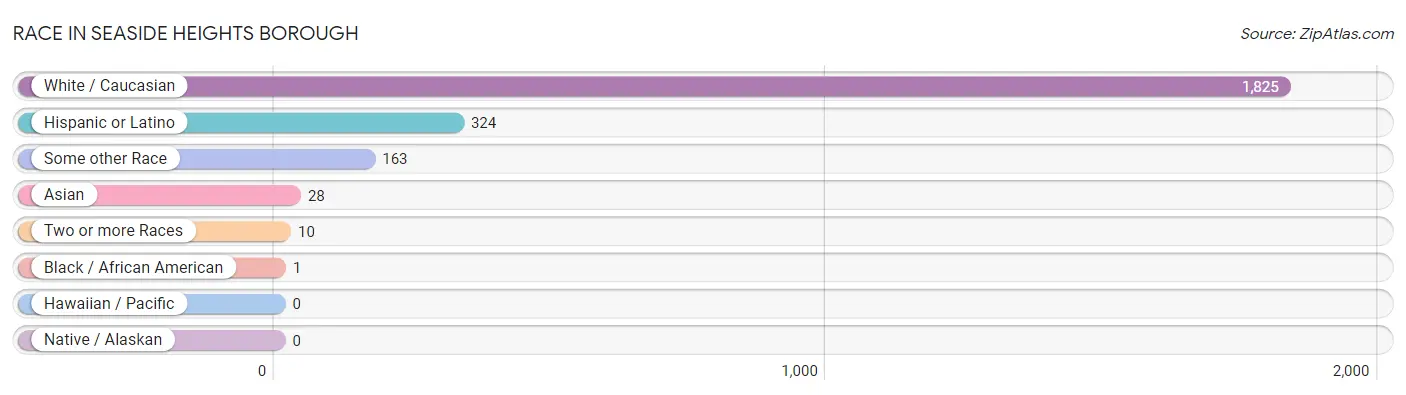
| Race | # Population | % Population |
| Asian | 28 | 1.4% |
| Black / African American | 1 | 0.1% |
| Hawaiian / Pacific | 0 | 0.0% |
| Hispanic or Latino | 324 | 16.0% |
| Native / Alaskan | 0 | 0.0% |
| White / Caucasian | 1,825 | 90.0% |
| Two or more Races | 10 | 0.5% |
| Some other Race | 163 | 8.0% |
| Total | 2,027 | 100.0% |
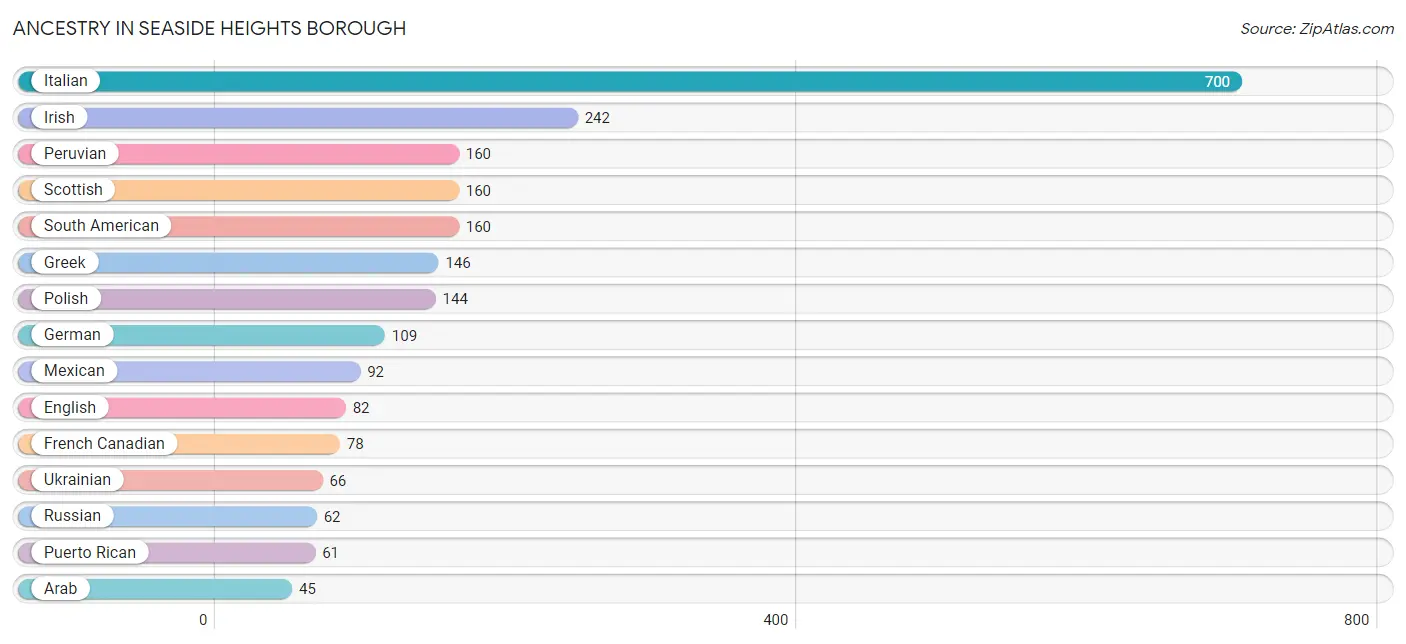
Ancestry in Seaside Heights borough
The most populous ancestries reported in Seaside Heights borough are Italian (700 | 34.5%), Irish (242 | 11.9%), Peruvian (160 | 7.9%), Scottish (160 | 7.9%), and South American (160 | 7.9%), together accounting for 70.1% of all Seaside Heights borough residents.
| Ancestry | # Population | % Population |
| American | 12 | 0.6% |
| Arab | 45 | 2.2% |
| Austrian | 28 | 1.4% |
| Dutch | 29 | 1.4% |
| Egyptian | 19 | 0.9% |
| English | 82 | 4.1% |
| European | 37 | 1.8% |
| French | 15 | 0.7% |
| French Canadian | 78 | 3.8% |
| German | 109 | 5.4% |
| Greek | 146 | 7.2% |
| Irish | 242 | 11.9% |
| Italian | 700 | 34.5% |
| Korean | 11 | 0.5% |
| Mexican | 92 | 4.5% |
| Peruvian | 160 | 7.9% |
| Polish | 144 | 7.1% |
| Puerto Rican | 61 | 3.0% |
| Russian | 62 | 3.1% |
| Scottish | 160 | 7.9% |
| Serbian | 33 | 1.6% |
| South American | 160 | 7.9% |
| Syrian | 26 | 1.3% |
| Thai | 17 | 0.8% |
| Turkish | 23 | 1.1% |
| Ukrainian | 66 | 3.3% | View All 26 Rows |
Immigrants in Seaside Heights borough
The most numerous immigrant groups reported in Seaside Heights borough came from Central America (60 | 3.0%), Latin America (60 | 3.0%), Mexico (60 | 3.0%), Europe (50 | 2.5%), and Eastern Europe (42 | 2.1%), together accounting for 13.4% of all Seaside Heights borough residents.
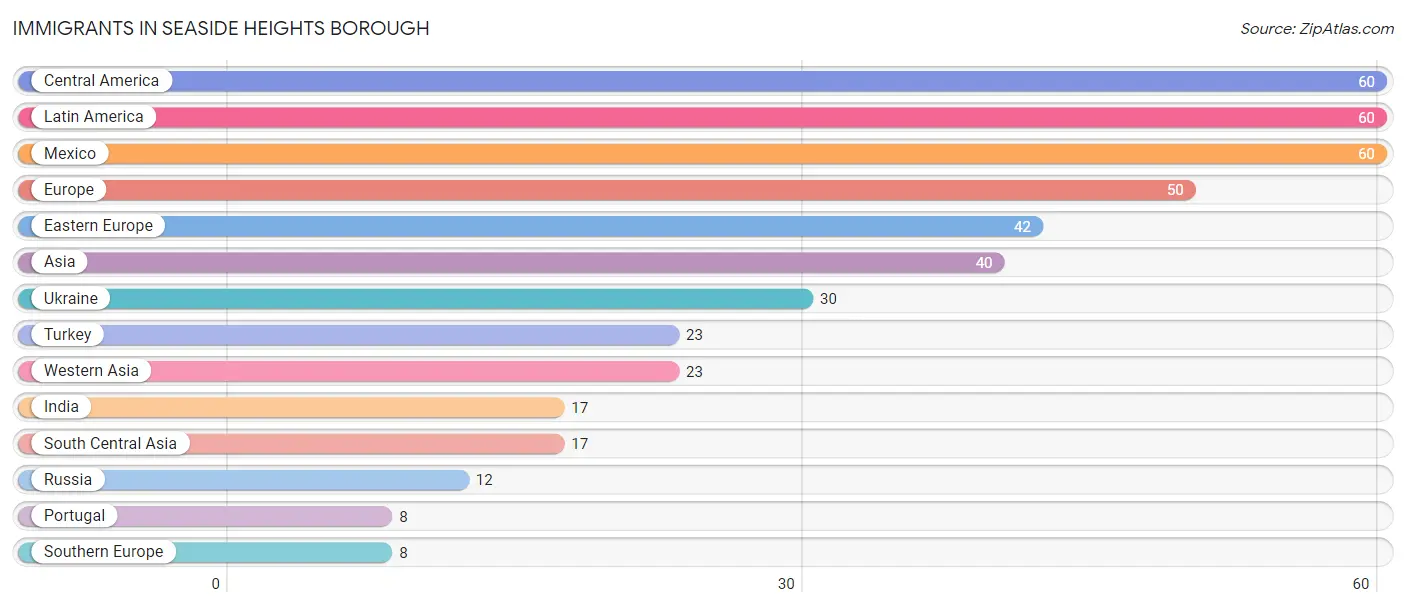
| Immigration Origin | # Population | % Population |
| Asia | 40 | 2.0% |
| Central America | 60 | 3.0% |
| Eastern Europe | 42 | 2.1% |
| Europe | 50 | 2.5% |
| India | 17 | 0.8% |
| Latin America | 60 | 3.0% |
| Mexico | 60 | 3.0% |
| Portugal | 8 | 0.4% |
| Russia | 12 | 0.6% |
| South Central Asia | 17 | 0.8% |
| Southern Europe | 8 | 0.4% |
| Turkey | 23 | 1.1% |
| Ukraine | 30 | 1.5% |
| Western Asia | 23 | 1.1% | View All 14 Rows |
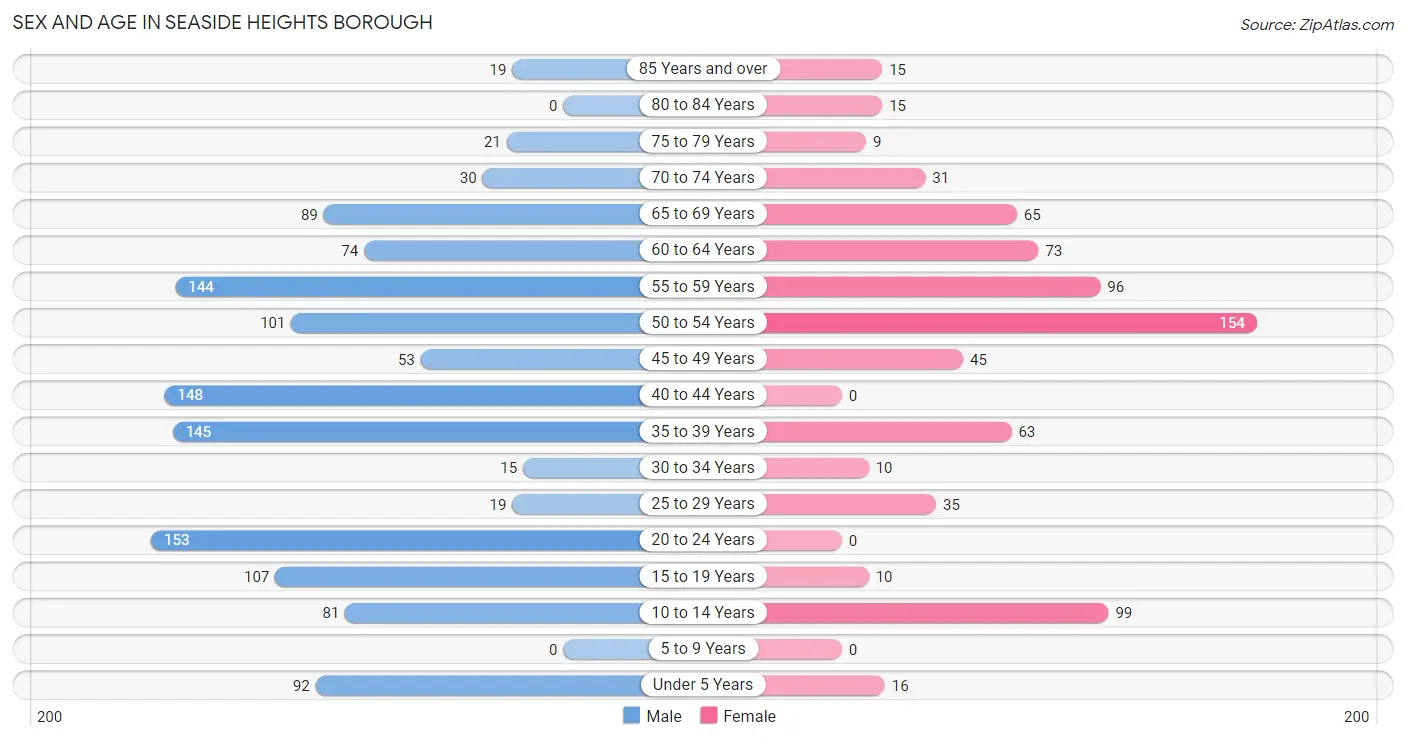
Sex and Age in Seaside Heights borough
Sex and Age in Seaside Heights borough
The most populous age groups in Seaside Heights borough are 20 to 24 Years (153 | 11.8%) for men and 50 to 54 Years (154 | 20.9%) for women.
| Age Bracket | Male | Female |
| Under 5 Years | 92 (7.1%) | 16 (2.2%) |
| 5 to 9 Years | 0 (0.0%) | 0 (0.0%) |
| 10 to 14 Years | 81 (6.3%) | 99 (13.5%) |
| 15 to 19 Years | 107 (8.3%) | 10 (1.4%) |
| 20 to 24 Years | 153 (11.8%) | 0 (0.0%) |
| 25 to 29 Years | 19 (1.5%) | 35 (4.8%) |
| 30 to 34 Years | 15 (1.2%) | 10 (1.4%) |
| 35 to 39 Years | 145 (11.2%) | 63 (8.6%) |
| 40 to 44 Years | 148 (11.5%) | 0 (0.0%) |
| 45 to 49 Years | 53 (4.1%) | 45 (6.1%) |
| 50 to 54 Years | 101 (7.8%) | 154 (20.9%) |
| 55 to 59 Years | 144 (11.2%) | 96 (13.0%) |
| 60 to 64 Years | 74 (5.7%) | 73 (9.9%) |
| 65 to 69 Years | 89 (6.9%) | 65 (8.8%) |
| 70 to 74 Years | 30 (2.3%) | 31 (4.2%) |
| 75 to 79 Years | 21 (1.6%) | 9 (1.2%) |
| 80 to 84 Years | 0 (0.0%) | 15 (2.0%) |
| 85 Years and over | 19 (1.5%) | 15 (2.0%) |
| Total | 1,291 (100.0%) | 736 (100.0%) |
Families and Households in Seaside Heights borough
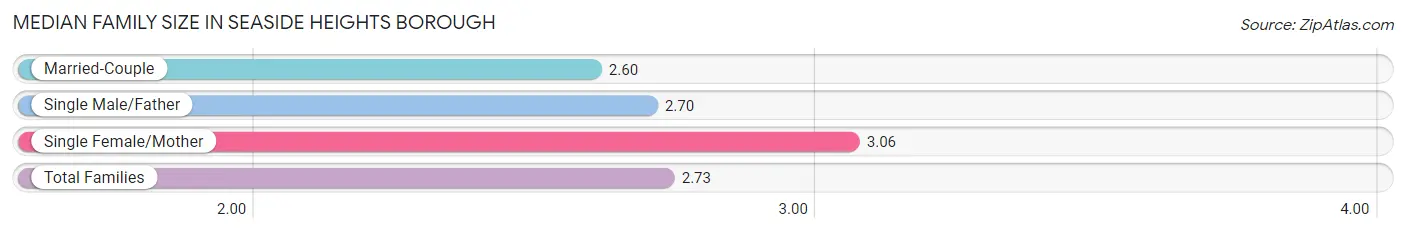
Median Family Size in Seaside Heights borough
The median family size in Seaside Heights borough is 2.73 persons per family, with single female/mother families (105 | 22.9%) accounting for the largest median family size of 3.06 persons per family. On the other hand, married-couple families (238 | 52.0%) represent the smallest median family size with 2.60 persons per family.
| Family Type | # Families | Family Size |
| Married-Couple | 238 (52.0%) | 2.60 |
| Single Male/Father | 115 (25.1%) | 2.70 |
| Single Female/Mother | 105 (22.9%) | 3.06 |
| Total Families | 458 (100.0%) | 2.73 |
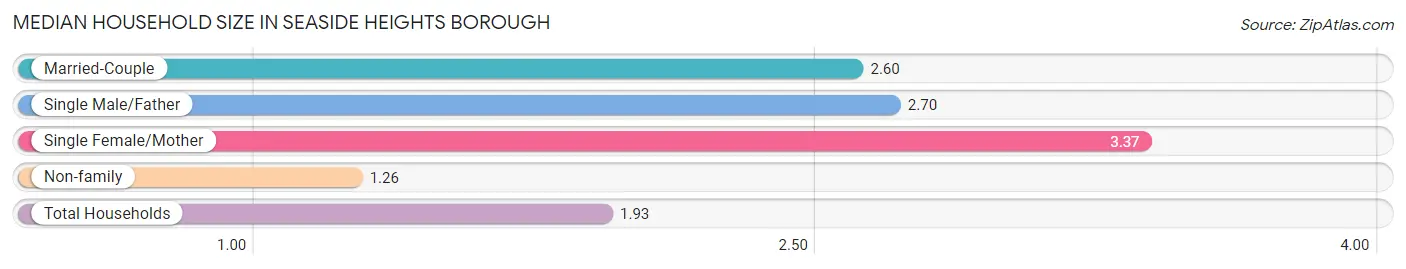
Median Household Size in Seaside Heights borough
The median household size in Seaside Heights borough is 1.93 persons per household, with single female/mother households (105 | 10.0%) accounting for the largest median household size of 3.37 persons per household. non-family households (588 | 56.2%) represent the smallest median household size with 1.26 persons per household.
| Household Type | # Households | Household Size |
| Married-Couple | 238 (22.8%) | 2.60 |
| Single Male/Father | 115 (11.0%) | 2.70 |
| Single Female/Mother | 105 (10.0%) | 3.37 |
| Non-family | 588 (56.2%) | 1.26 |
| Total Households | 1,046 (100.0%) | 1.93 |
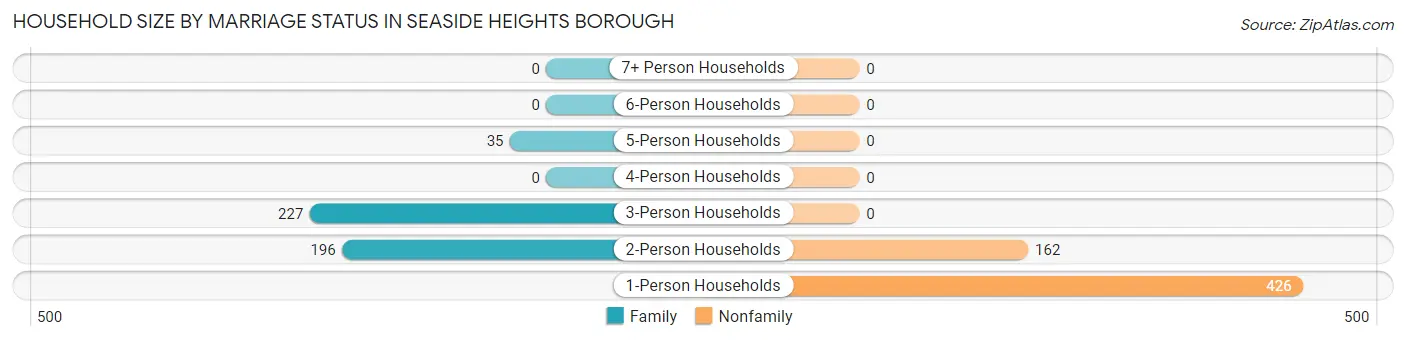
Household Size by Marriage Status in Seaside Heights borough
Out of a total of 1,046 households in Seaside Heights borough, 458 (43.8%) are family households, while 588 (56.2%) are nonfamily households. The most numerous type of family households are 3-person households, comprising 227, and the most common type of nonfamily households are 1-person households, comprising 426.
| Household Size | Family Households | Nonfamily Households |
| 1-Person Households | - | 426 (40.7%) |
| 2-Person Households | 196 (18.7%) | 162 (15.5%) |
| 3-Person Households | 227 (21.7%) | 0 (0.0%) |
| 4-Person Households | 0 (0.0%) | 0 (0.0%) |
| 5-Person Households | 35 (3.4%) | 0 (0.0%) |
| 6-Person Households | 0 (0.0%) | 0 (0.0%) |
| 7+ Person Households | 0 (0.0%) | 0 (0.0%) |
| Total | 458 (43.8%) | 588 (56.2%) |
Female Fertility in Seaside Heights borough
Fertility by Age in Seaside Heights borough
| Age Bracket | Women with Births | Births / 1,000 Women |
| 15 to 19 years | 0 (0.0%) | 0.0 |
| 20 to 34 years | 0 (0.0%) | 0.0 |
| 35 to 50 years | 0 (0.0%) | 0.0 |
| Total | 0 (0.0%) | 0.0 |
Fertility by Age by Marriage Status in Seaside Heights borough
| Age Bracket | Married | Unmarried |
| 15 to 19 years | 0 (0.0%) | 0 (0.0%) |
| 20 to 34 years | 0 (0.0%) | 0 (0.0%) |
| 35 to 50 years | 0 (0.0%) | 0 (0.0%) |
| Total | 0 (0.0%) | 0 (0.0%) |
Fertility by Education in Seaside Heights borough
| Educational Attainment | Women with Births | Births / 1,000 Women |
| Less than High School | 0 (0.0%) | 0.0 |
| High School Diploma | 0 (0.0%) | 0.0 |
| College or Associate's Degree | 0 (0.0%) | 0.0 |
| Bachelor's Degree | 0 (0.0%) | 0.0 |
| Graduate Degree | 0 (0.0%) | 0.0 |
| Total | 0 (0.0%) | 0.0 |
Fertility by Education by Marriage Status in Seaside Heights borough
| Educational Attainment | Married | Unmarried |
| Less than High School | 0 (0.0%) | 0 (0.0%) |
| High School Diploma | 0 (0.0%) | 0 (0.0%) |
| College or Associate's Degree | 0 (0.0%) | 0 (0.0%) |
| Bachelor's Degree | 0 (0.0%) | 0 (0.0%) |
| Graduate Degree | 0 (0.0%) | 0 (0.0%) |
| Total | 0 (0.0%) | 0 (0.0%) |
Employment Characteristics in Seaside Heights borough
Employment by Class of Employer in Seaside Heights borough
Among the 760 employed individuals in Seaside Heights borough, private company employees (551 | 72.5%), local government employees (74 | 9.7%), and self-employed (not incorporated) (53 | 7.0%) make up the most common classes of employment.
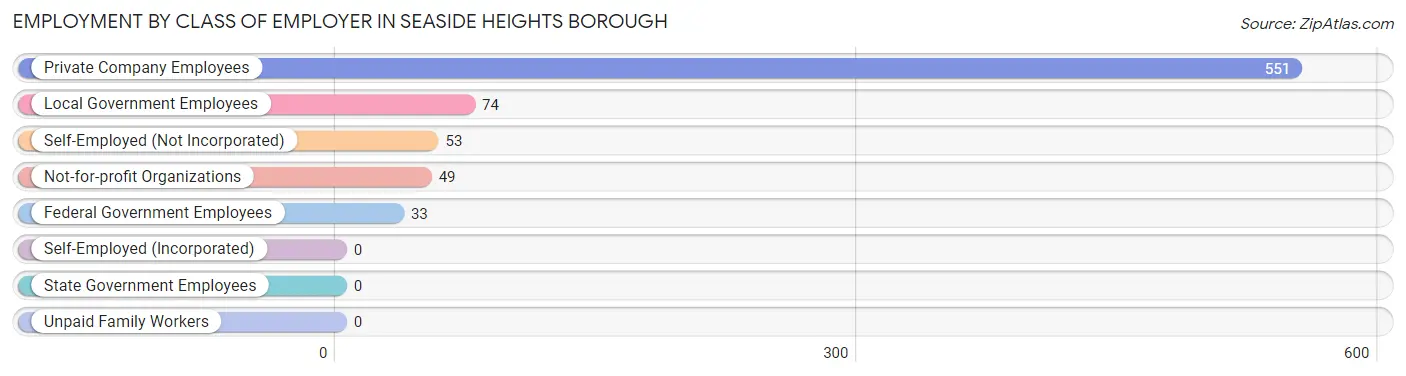
| Employer Class | # Employees | % Employees |
| Private Company Employees | 551 | 72.5% |
| Self-Employed (Incorporated) | 0 | 0.0% |
| Self-Employed (Not Incorporated) | 53 | 7.0% |
| Not-for-profit Organizations | 49 | 6.5% |
| Local Government Employees | 74 | 9.7% |
| State Government Employees | 0 | 0.0% |
| Federal Government Employees | 33 | 4.3% |
| Unpaid Family Workers | 0 | 0.0% |
| Total | 760 | 100.0% |
Employment Status by Age in Seaside Heights borough
According to the labor force statistics for Seaside Heights borough, out of the total population over 16 years of age (1,739), 46.3% or 805 individuals are in the labor force, with 5.7% or 46 of them unemployed. The age group with the highest labor force participation rate is 30 to 34 years, with 96.0% or 24 individuals in the labor force. Within the labor force, the 60 to 64 years age range has the highest percentage of unemployed individuals, with 31.6% or 18 of them being unemployed.
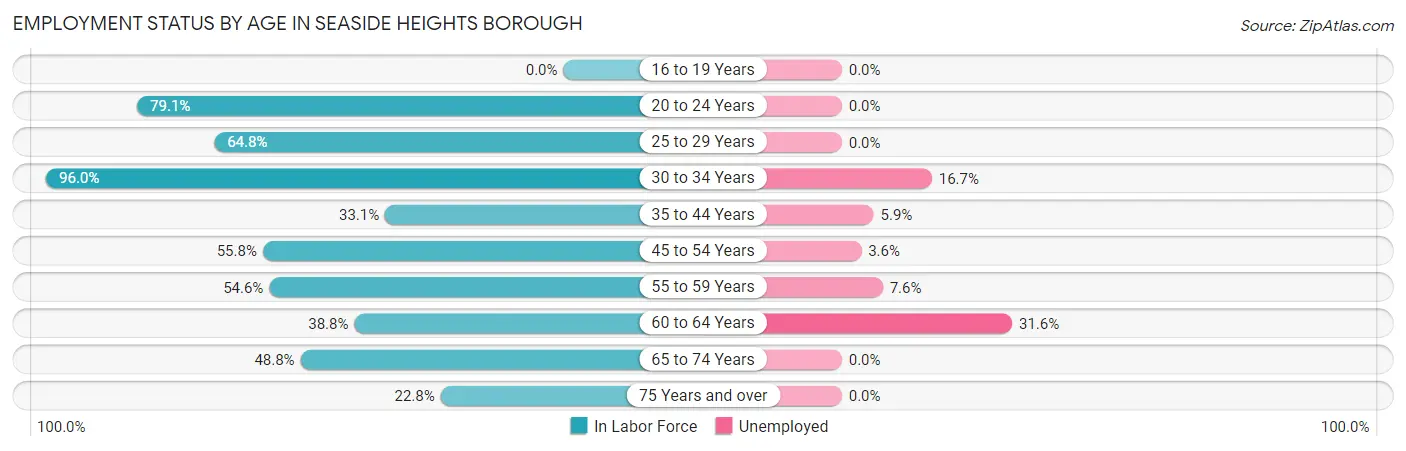
| Age Bracket | In Labor Force | Unemployed |
| 16 to 19 Years | 0 (0.0%) | 0 (0.0%) |
| 20 to 24 Years | 121 (79.1%) | 0 (0.0%) |
| 25 to 29 Years | 35 (64.8%) | 0 (0.0%) |
| 30 to 34 Years | 24 (96.0%) | 4 (16.7%) |
| 35 to 44 Years | 118 (33.1%) | 7 (5.9%) |
| 45 to 54 Years | 197 (55.8%) | 7 (3.6%) |
| 55 to 59 Years | 131 (54.6%) | 10 (7.6%) |
| 60 to 64 Years | 57 (38.8%) | 18 (31.6%) |
| 65 to 74 Years | 105 (48.8%) | 0 (0.0%) |
| 75 Years and over | 18 (22.8%) | 0 (0.0%) |
| Total | 805 (46.3%) | 46 (5.7%) |
Employment Status by Educational Attainment in Seaside Heights borough
According to labor force statistics for Seaside Heights borough, 47.8% of individuals (562) out of the total population between 25 and 64 years of age (1,175) are in the labor force, with 8.2% or 46 of them being unemployed. The group with the highest labor force participation rate are those with the educational attainment of bachelor's degree or higher, with 70.2% or 271 individuals in the labor force. Within the labor force, individuals with college / associate degree education have the highest percentage of unemployment, with 26.4% or 24 of them being unemployed.
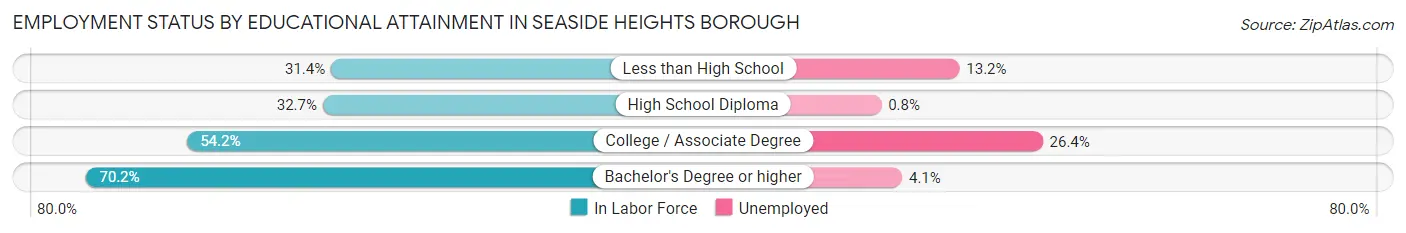
| Educational Attainment | In Labor Force | Unemployed |
| Less than High School | 76 (31.4%) | 32 (13.2%) |
| High School Diploma | 124 (32.7%) | 3 (0.8%) |
| College / Associate Degree | 91 (54.2%) | 44 (26.4%) |
| Bachelor's Degree or higher | 271 (70.2%) | 16 (4.1%) |
| Total | 562 (47.8%) | 96 (8.2%) |
Employment Occupations by Sex in Seaside Heights borough
Management, Business, Science and Arts Occupations
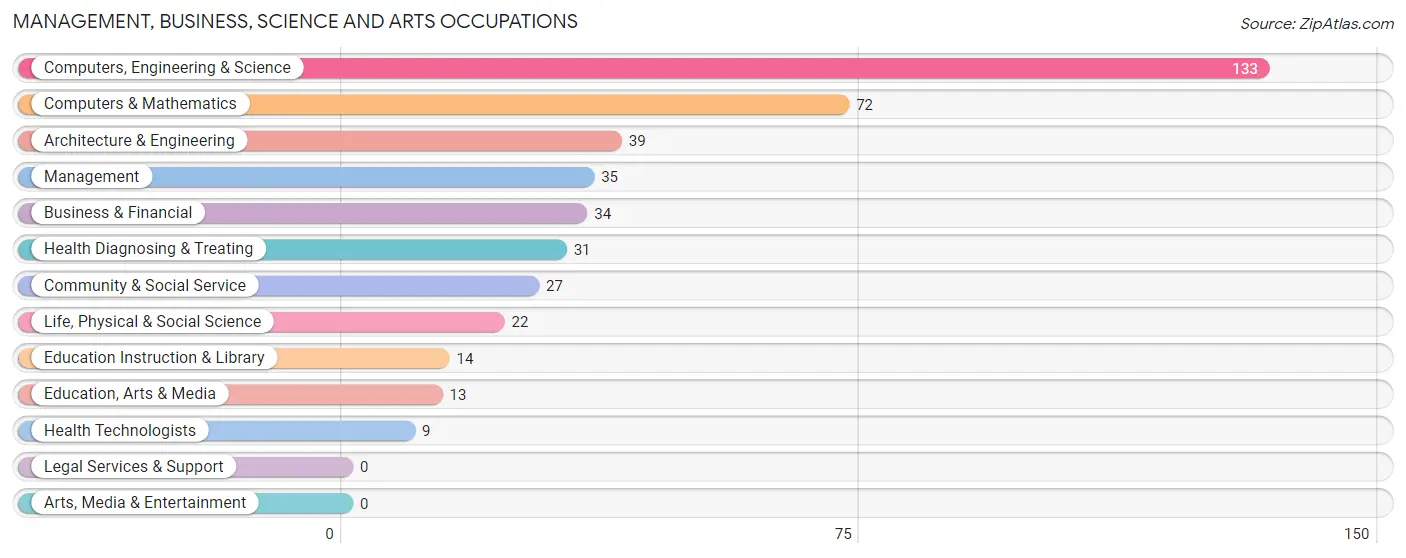
The most common Management, Business, Science and Arts occupations in Seaside Heights borough are Computers, Engineering & Science (133 | 17.5%), Computers & Mathematics (72 | 9.5%), Architecture & Engineering (39 | 5.1%), Management (35 | 4.6%), and Business & Financial (34 | 4.5%).
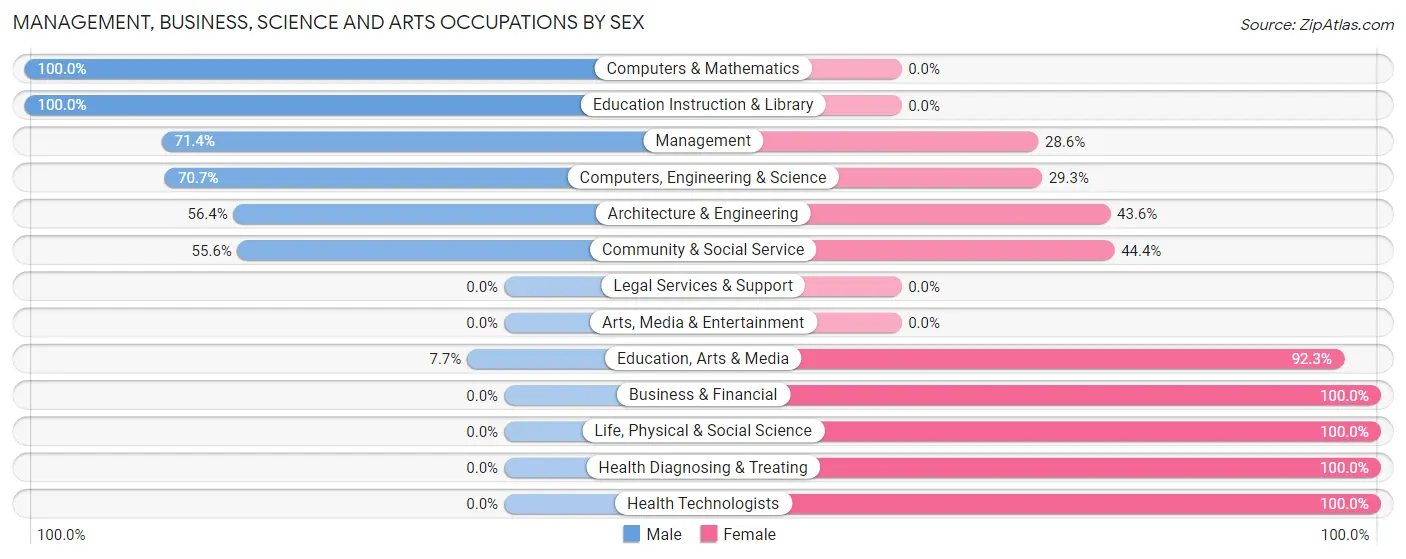
Management, Business, Science and Arts Occupations by Sex
Within the Management, Business, Science and Arts occupations in Seaside Heights borough, the most male-oriented occupations are Computers & Mathematics (100.0%), Education Instruction & Library (100.0%), and Management (71.4%), while the most female-oriented occupations are Business & Financial (100.0%), Life, Physical & Social Science (100.0%), and Health Diagnosing & Treating (100.0%).
| Occupation | Male | Female |
| Management | 25 (71.4%) | 10 (28.6%) |
| Business & Financial | 0 (0.0%) | 34 (100.0%) |
| Computers, Engineering & Science | 94 (70.7%) | 39 (29.3%) |
| Computers & Mathematics | 72 (100.0%) | 0 (0.0%) |
| Architecture & Engineering | 22 (56.4%) | 17 (43.6%) |
| Life, Physical & Social Science | 0 (0.0%) | 22 (100.0%) |
| Community & Social Service | 15 (55.6%) | 12 (44.4%) |
| Education, Arts & Media | 1 (7.7%) | 12 (92.3%) |
| Legal Services & Support | 0 (0.0%) | 0 (0.0%) |
| Education Instruction & Library | 14 (100.0%) | 0 (0.0%) |
| Arts, Media & Entertainment | 0 (0.0%) | 0 (0.0%) |
| Health Diagnosing & Treating | 0 (0.0%) | 31 (100.0%) |
| Health Technologists | 0 (0.0%) | 9 (100.0%) |
| Total (Category) | 134 (51.5%) | 126 (48.5%) |
| Total (Overall) | 467 (61.5%) | 293 (38.6%) |
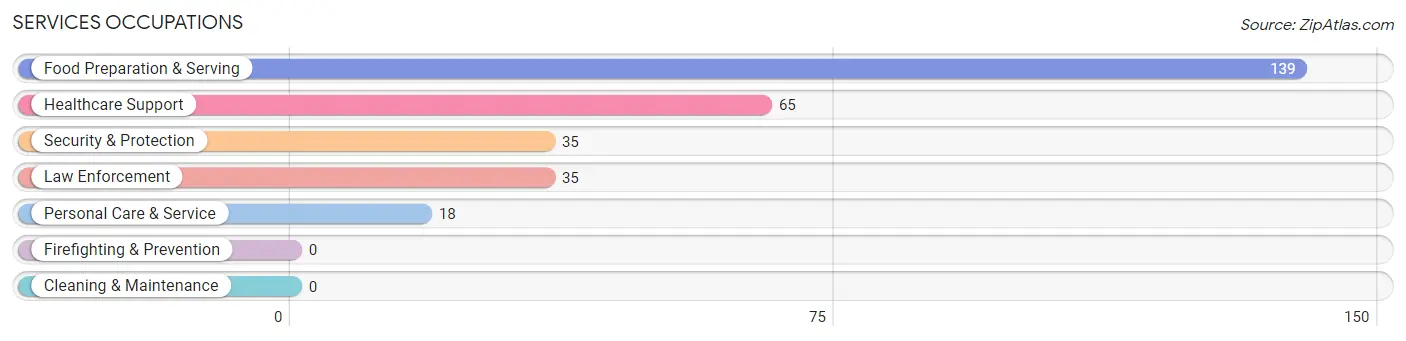
Services Occupations
The most common Services occupations in Seaside Heights borough are Food Preparation & Serving (139 | 18.3%), Healthcare Support (65 | 8.6%), Security & Protection (35 | 4.6%), Law Enforcement (35 | 4.6%), and Personal Care & Service (18 | 2.4%).
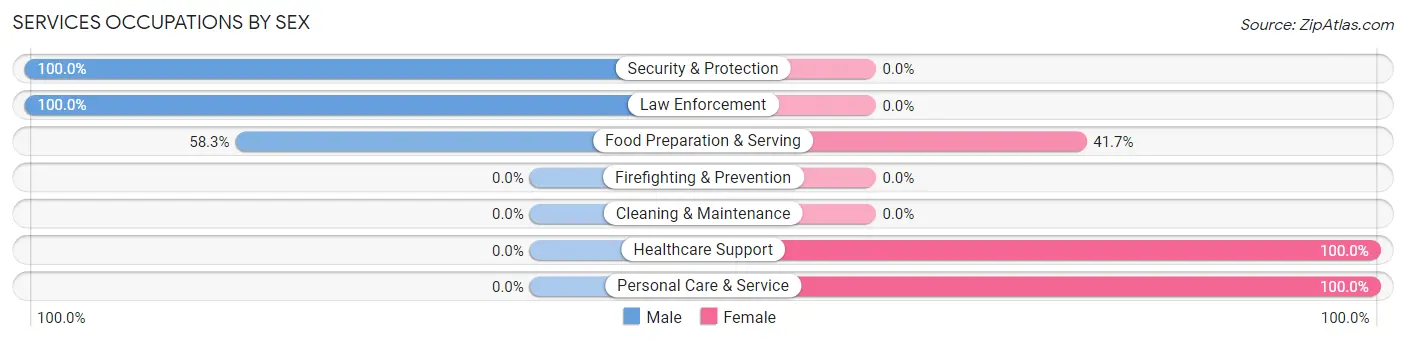
Services Occupations by Sex
Within the Services occupations in Seaside Heights borough, the most male-oriented occupations are Security & Protection (100.0%), Law Enforcement (100.0%), and Food Preparation & Serving (58.3%), while the most female-oriented occupations are Healthcare Support (100.0%), Personal Care & Service (100.0%), and Food Preparation & Serving (41.7%).
| Occupation | Male | Female |
| Healthcare Support | 0 (0.0%) | 65 (100.0%) |
| Security & Protection | 35 (100.0%) | 0 (0.0%) |
| Firefighting & Prevention | 0 (0.0%) | 0 (0.0%) |
| Law Enforcement | 35 (100.0%) | 0 (0.0%) |
| Food Preparation & Serving | 81 (58.3%) | 58 (41.7%) |
| Cleaning & Maintenance | 0 (0.0%) | 0 (0.0%) |
| Personal Care & Service | 0 (0.0%) | 18 (100.0%) |
| Total (Category) | 116 (45.1%) | 141 (54.9%) |
| Total (Overall) | 467 (61.5%) | 293 (38.6%) |
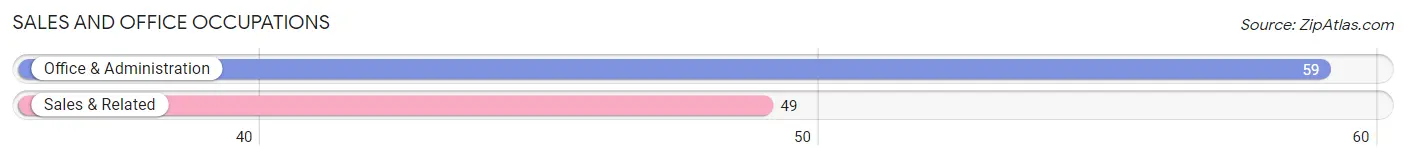
Sales and Office Occupations
The most common Sales and Office occupations in Seaside Heights borough are Office & Administration (59 | 7.8%), and Sales & Related (49 | 6.5%).
Sales and Office Occupations by Sex
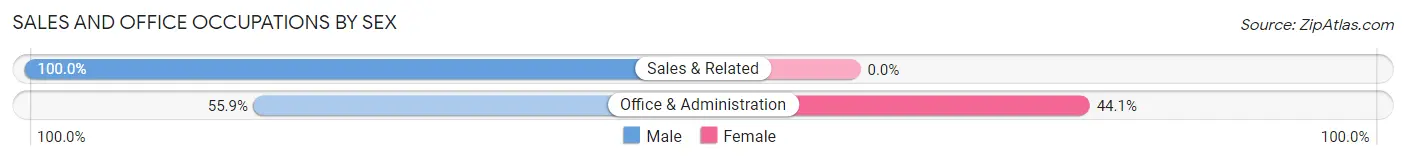
| Occupation | Male | Female |
| Sales & Related | 49 (100.0%) | 0 (0.0%) |
| Office & Administration | 33 (55.9%) | 26 (44.1%) |
| Total (Category) | 82 (75.9%) | 26 (24.1%) |
| Total (Overall) | 467 (61.5%) | 293 (38.6%) |
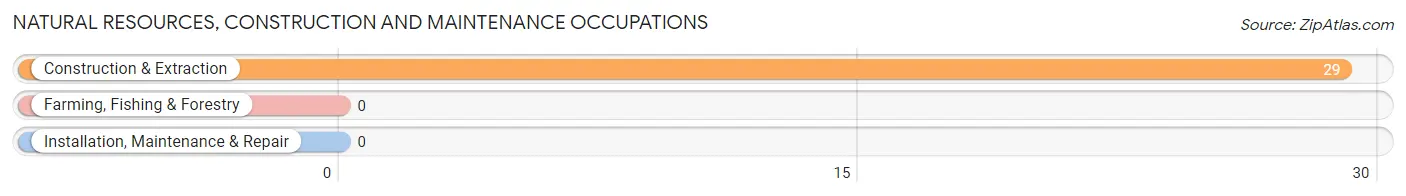
Natural Resources, Construction and Maintenance Occupations
The most common Natural Resources, Construction and Maintenance occupations in Seaside Heights borough are , and Construction & Extraction (29 | 3.8%).
Natural Resources, Construction and Maintenance Occupations by Sex
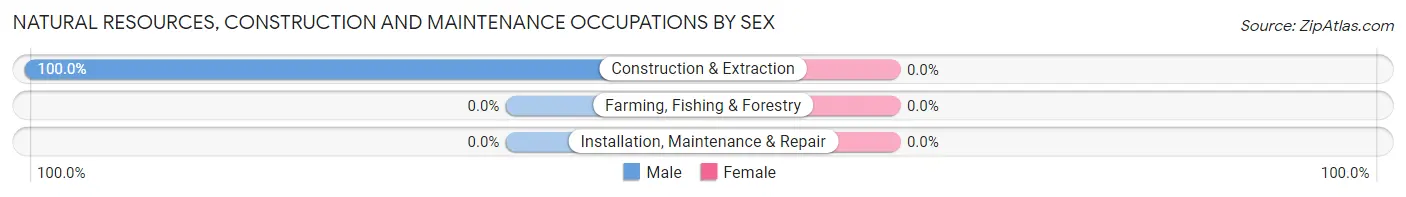
| Occupation | Male | Female |
| Farming, Fishing & Forestry | 0 (0.0%) | 0 (0.0%) |
| Construction & Extraction | 29 (100.0%) | 0 (0.0%) |
| Installation, Maintenance & Repair | 0 (0.0%) | 0 (0.0%) |
| Total (Category) | 29 (100.0%) | 0 (0.0%) |
| Total (Overall) | 467 (61.5%) | 293 (38.6%) |
Production, Transportation and Moving Occupations
The most common Production, Transportation and Moving occupations in Seaside Heights borough are , and Transportation (106 | 14.0%).
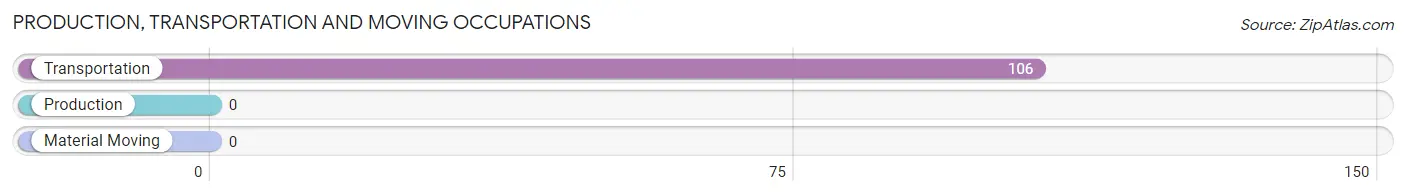
Production, Transportation and Moving Occupations by Sex
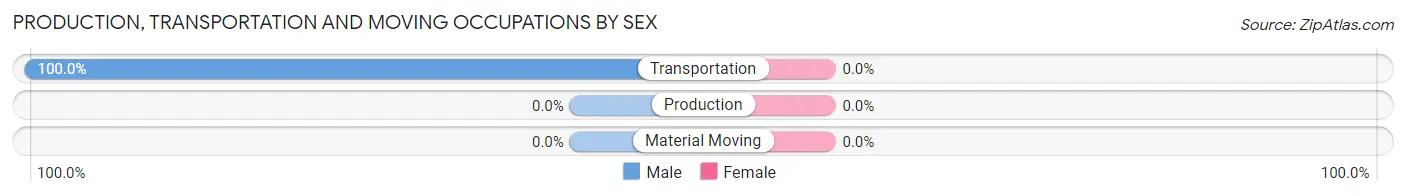
| Occupation | Male | Female |
| Production | 0 (0.0%) | 0 (0.0%) |
| Transportation | 106 (100.0%) | 0 (0.0%) |
| Material Moving | 0 (0.0%) | 0 (0.0%) |
| Total (Category) | 106 (100.0%) | 0 (0.0%) |
| Total (Overall) | 467 (61.5%) | 293 (38.6%) |
Employment Industries by Sex in Seaside Heights borough
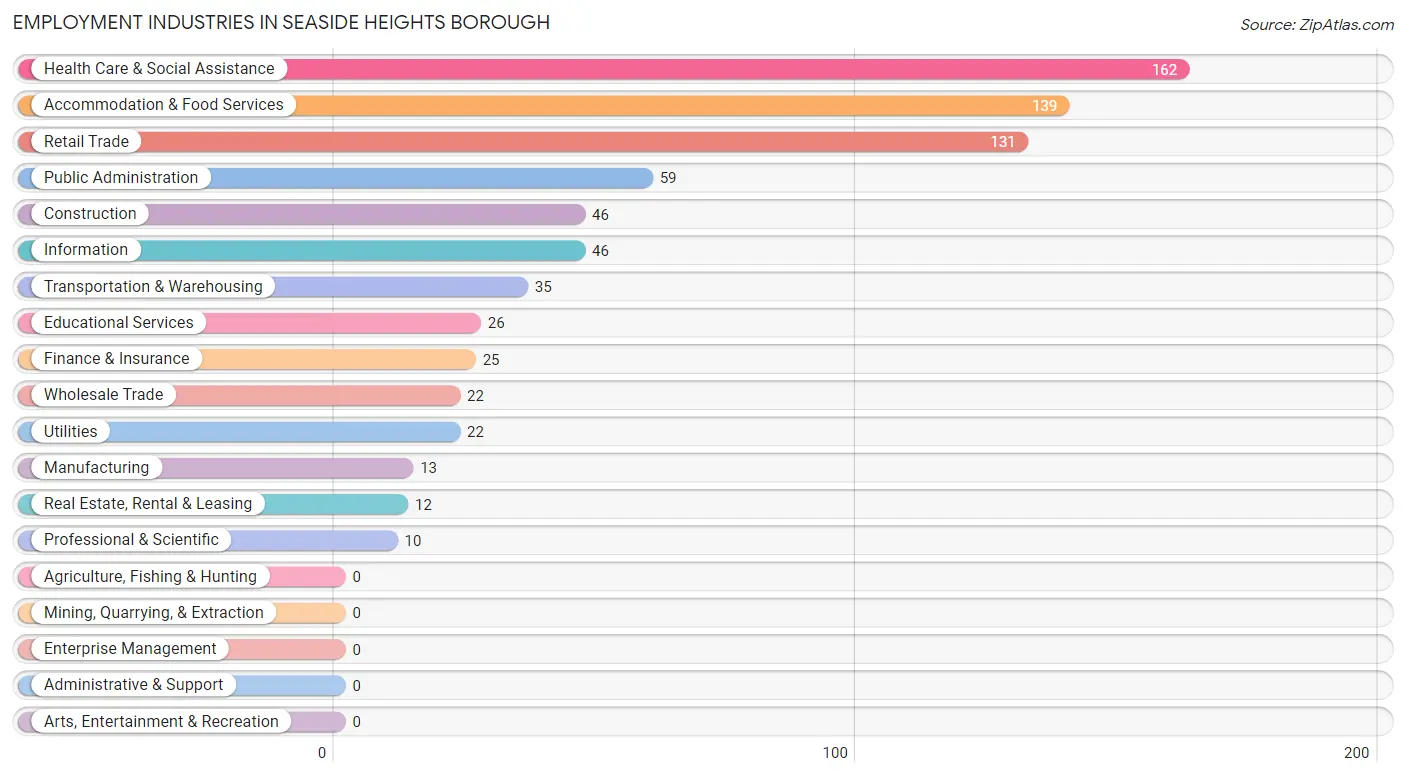
Employment Industries in Seaside Heights borough
The major employment industries in Seaside Heights borough include Health Care & Social Assistance (162 | 21.3%), Accommodation & Food Services (139 | 18.3%), Retail Trade (131 | 17.2%), Public Administration (59 | 7.8%), and Construction (46 | 6.0%).
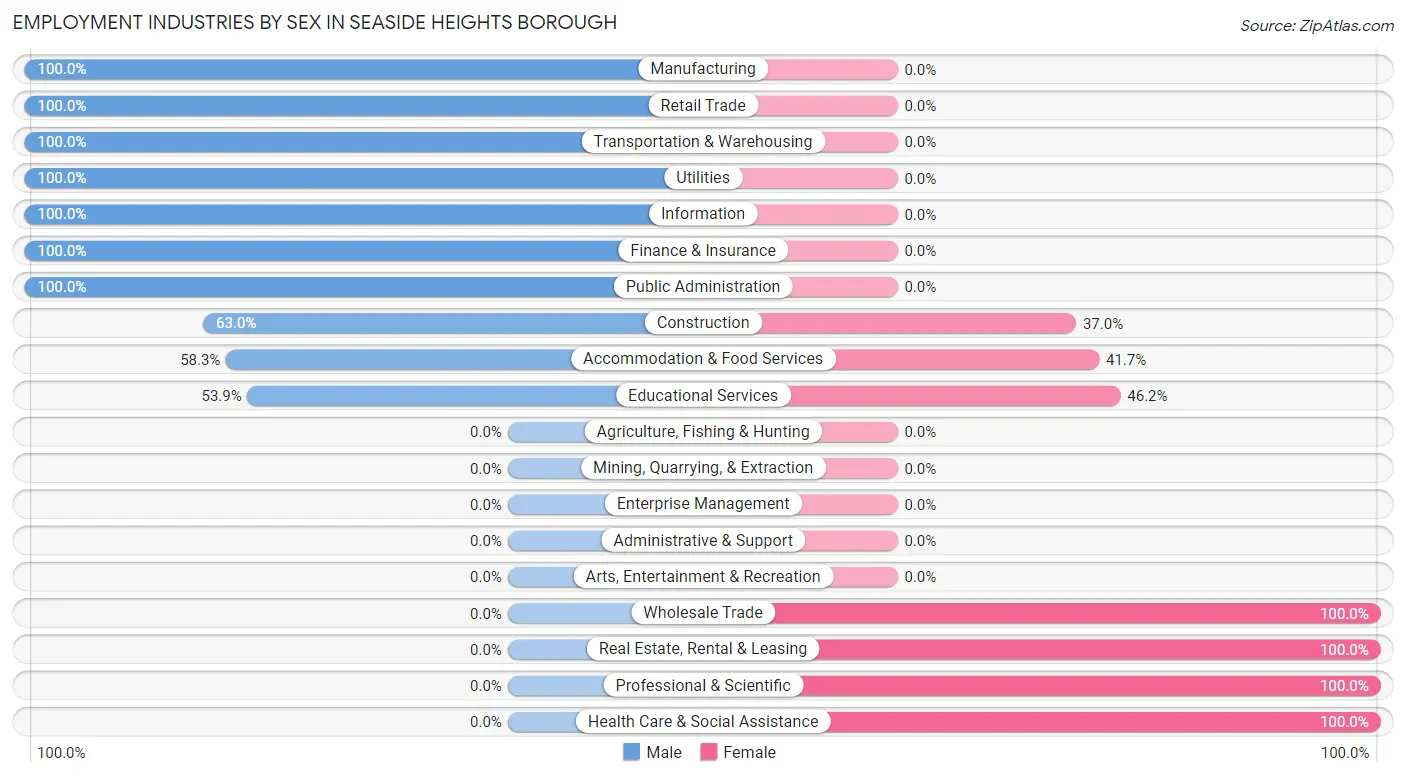
Employment Industries by Sex in Seaside Heights borough
The Seaside Heights borough industries that see more men than women are Manufacturing (100.0%), Retail Trade (100.0%), and Transportation & Warehousing (100.0%), whereas the industries that tend to have a higher number of women are Wholesale Trade (100.0%), Real Estate, Rental & Leasing (100.0%), and Professional & Scientific (100.0%).
| Industry | Male | Female |
| Agriculture, Fishing & Hunting | 0 (0.0%) | 0 (0.0%) |
| Mining, Quarrying, & Extraction | 0 (0.0%) | 0 (0.0%) |
| Construction | 29 (63.0%) | 17 (37.0%) |
| Manufacturing | 13 (100.0%) | 0 (0.0%) |
| Wholesale Trade | 0 (0.0%) | 22 (100.0%) |
| Retail Trade | 131 (100.0%) | 0 (0.0%) |
| Transportation & Warehousing | 35 (100.0%) | 0 (0.0%) |
| Utilities | 22 (100.0%) | 0 (0.0%) |
| Information | 46 (100.0%) | 0 (0.0%) |
| Finance & Insurance | 25 (100.0%) | 0 (0.0%) |
| Real Estate, Rental & Leasing | 0 (0.0%) | 12 (100.0%) |
| Professional & Scientific | 0 (0.0%) | 10 (100.0%) |
| Enterprise Management | 0 (0.0%) | 0 (0.0%) |
| Administrative & Support | 0 (0.0%) | 0 (0.0%) |
| Educational Services | 14 (53.8%) | 12 (46.2%) |
| Health Care & Social Assistance | 0 (0.0%) | 162 (100.0%) |
| Arts, Entertainment & Recreation | 0 (0.0%) | 0 (0.0%) |
| Accommodation & Food Services | 81 (58.3%) | 58 (41.7%) |
| Public Administration | 59 (100.0%) | 0 (0.0%) |
| Total | 467 (61.5%) | 293 (38.6%) |
Education in Seaside Heights borough
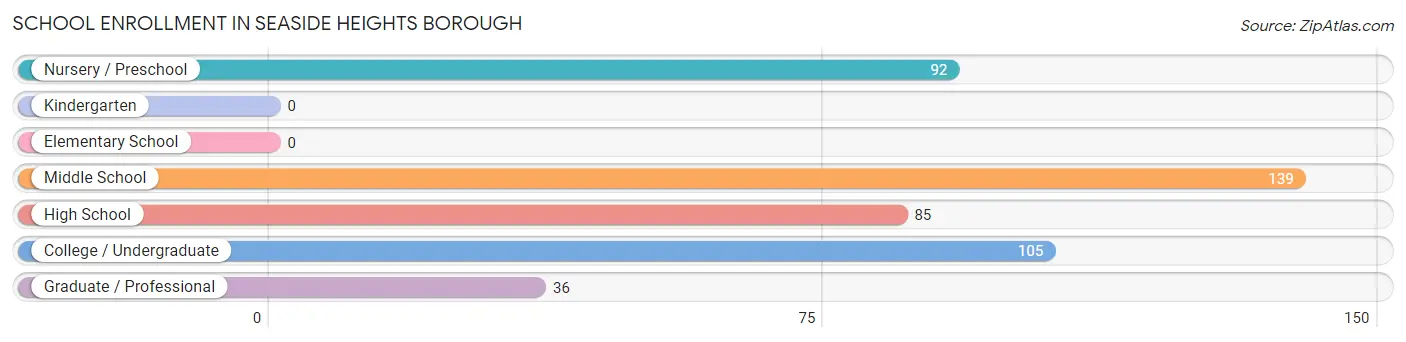
School Enrollment in Seaside Heights borough
The most common levels of schooling among the 457 students in Seaside Heights borough are middle school (139 | 30.4%), college / undergraduate (105 | 23.0%), and nursery / preschool (92 | 20.1%).
| School Level | # Students | % Students |
| Nursery / Preschool | 92 | 20.1% |
| Kindergarten | 0 | 0.0% |
| Elementary School | 0 | 0.0% |
| Middle School | 139 | 30.4% |
| High School | 85 | 18.6% |
| College / Undergraduate | 105 | 23.0% |
| Graduate / Professional | 36 | 7.9% |
| Total | 457 | 100.0% |
School Enrollment by Age by Funding Source in Seaside Heights borough
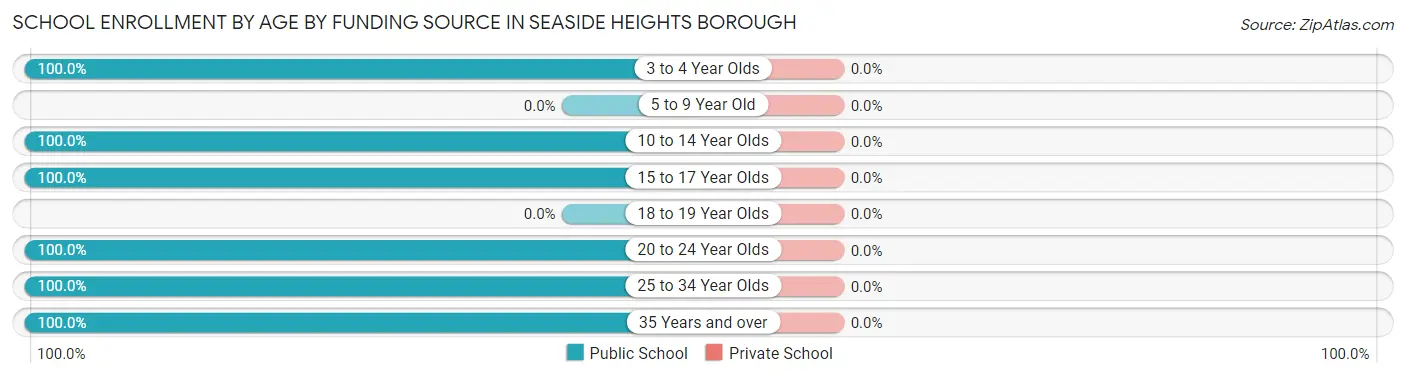
| Age Bracket | Public School | Private School |
| 3 to 4 Year Olds | 92 (100.0%) | 0 (0.0%) |
| 5 to 9 Year Old | 0 (0.0%) | 0 (0.0%) |
| 10 to 14 Year Olds | 180 (100.0%) | 0 (0.0%) |
| 15 to 17 Year Olds | 44 (100.0%) | 0 (0.0%) |
| 18 to 19 Year Olds | 0 (0.0%) | 0 (0.0%) |
| 20 to 24 Year Olds | 80 (100.0%) | 0 (0.0%) |
| 25 to 34 Year Olds | 10 (100.0%) | 0 (0.0%) |
| 35 Years and over | 51 (100.0%) | 0 (0.0%) |
| Total | 457 (100.0%) | 0 (0.0%) |
Educational Attainment by Field of Study in Seaside Heights borough
Business (136 | 27.6%), communications (89 | 18.0%), engineering (76 | 15.4%), arts & humanities (54 | 11.0%), and liberal arts & history (40 | 8.1%) are the most common fields of study among 493 individuals in Seaside Heights borough who have obtained a bachelor's degree or higher.
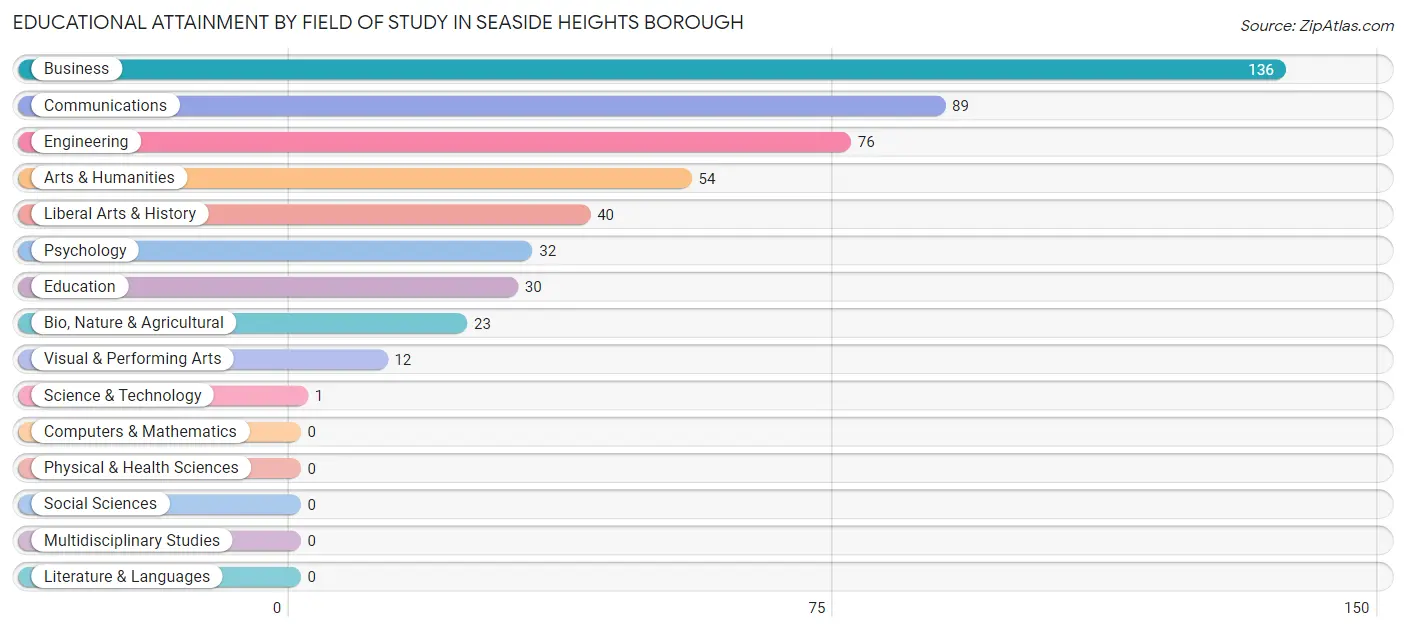
| Field of Study | # Graduates | % Graduates |
| Computers & Mathematics | 0 | 0.0% |
| Bio, Nature & Agricultural | 23 | 4.7% |
| Physical & Health Sciences | 0 | 0.0% |
| Psychology | 32 | 6.5% |
| Social Sciences | 0 | 0.0% |
| Engineering | 76 | 15.4% |
| Multidisciplinary Studies | 0 | 0.0% |
| Science & Technology | 1 | 0.2% |
| Business | 136 | 27.6% |
| Education | 30 | 6.1% |
| Literature & Languages | 0 | 0.0% |
| Liberal Arts & History | 40 | 8.1% |
| Visual & Performing Arts | 12 | 2.4% |
| Communications | 89 | 18.0% |
| Arts & Humanities | 54 | 11.0% |
| Total | 493 | 100.0% |
Transportation & Commute in Seaside Heights borough
Vehicle Availability by Sex in Seaside Heights borough
The most prevalent vehicle ownership categories in Seaside Heights borough are males with 2 vehicles (210, accounting for 45.1%) and females with 2 vehicles (181, making up 71.7%).
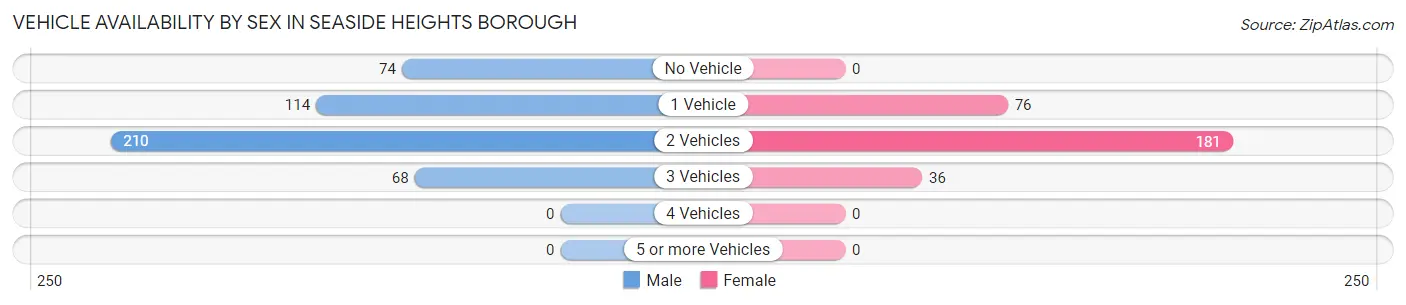
| Vehicles Available | Male | Female |
| No Vehicle | 74 (15.9%) | 0 (0.0%) |
| 1 Vehicle | 114 (24.5%) | 76 (25.9%) |
| 2 Vehicles | 210 (45.1%) | 181 (61.8%) |
| 3 Vehicles | 68 (14.6%) | 36 (12.3%) |
| 4 Vehicles | 0 (0.0%) | 0 (0.0%) |
| 5 or more Vehicles | 0 (0.0%) | 0 (0.0%) |
| Total | 466 (100.0%) | 293 (100.0%) |
Commute Time in Seaside Heights borough
The most frequently occuring commute durations in Seaside Heights borough are 5 to 9 minutes (189 commuters, 26.2%), 20 to 24 minutes (125 commuters, 17.3%), and 90 or more minutes (79 commuters, 11.0%).
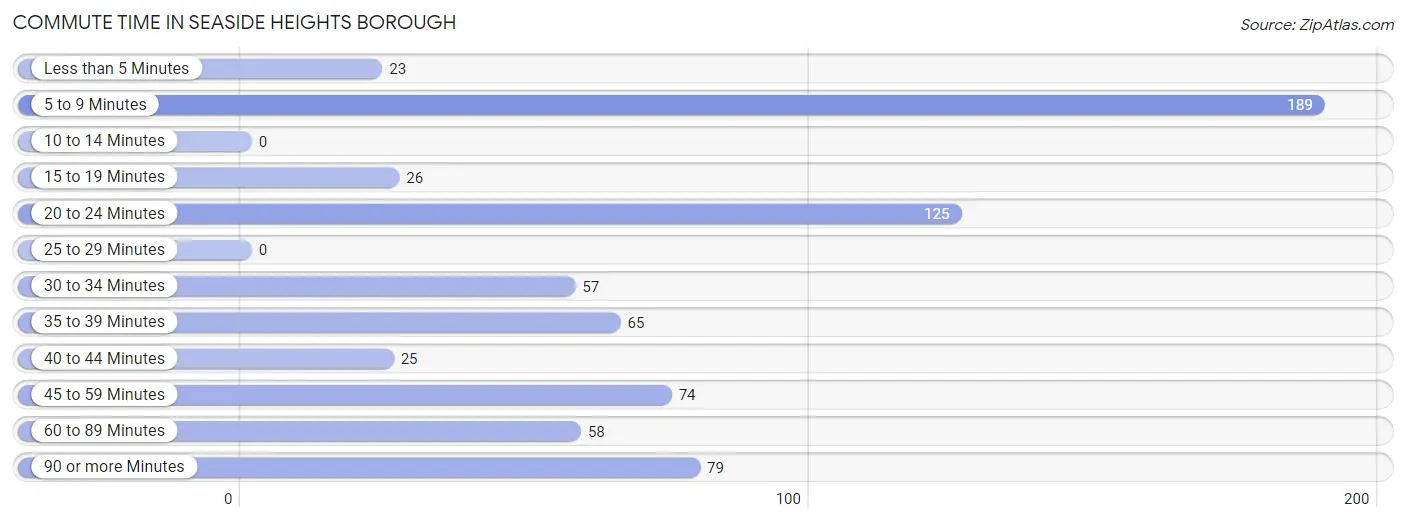
| Commute Time | # Commuters | % Commuters |
| Less than 5 Minutes | 23 | 3.2% |
| 5 to 9 Minutes | 189 | 26.2% |
| 10 to 14 Minutes | 0 | 0.0% |
| 15 to 19 Minutes | 26 | 3.6% |
| 20 to 24 Minutes | 125 | 17.3% |
| 25 to 29 Minutes | 0 | 0.0% |
| 30 to 34 Minutes | 57 | 7.9% |
| 35 to 39 Minutes | 65 | 9.0% |
| 40 to 44 Minutes | 25 | 3.5% |
| 45 to 59 Minutes | 74 | 10.3% |
| 60 to 89 Minutes | 58 | 8.0% |
| 90 or more Minutes | 79 | 11.0% |
Commute Time by Sex in Seaside Heights borough
The most common commute times in Seaside Heights borough are 20 to 24 minutes (113 commuters, 24.8%) for males and 5 to 9 minutes (140 commuters, 52.6%) for females.
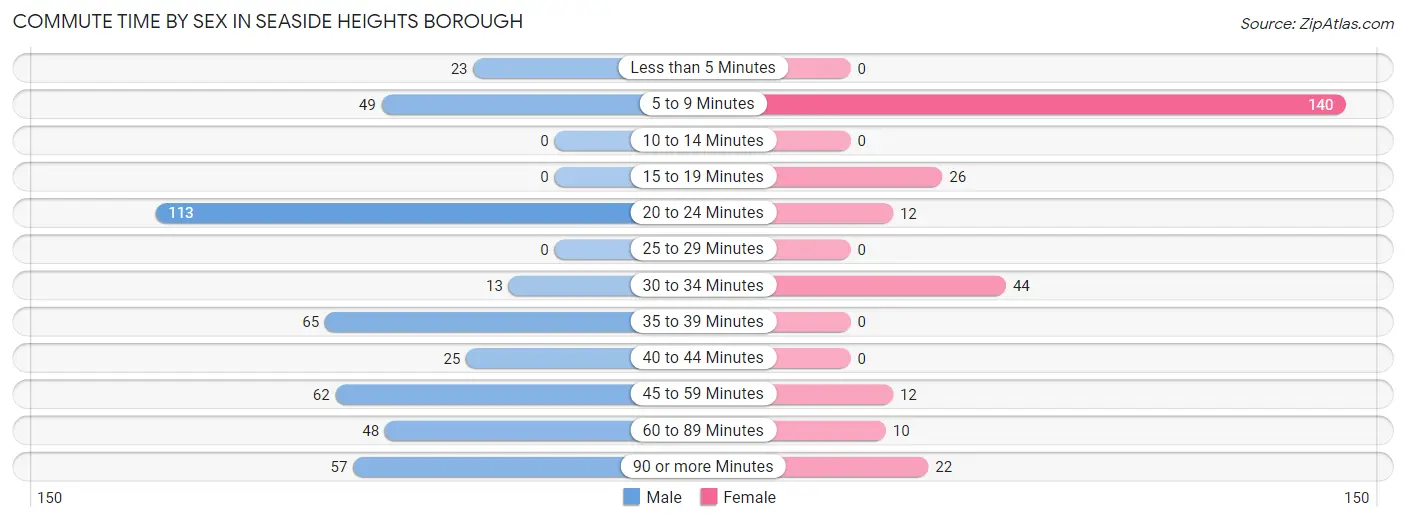
| Commute Time | Male | Female |
| Less than 5 Minutes | 23 (5.1%) | 0 (0.0%) |
| 5 to 9 Minutes | 49 (10.8%) | 140 (52.6%) |
| 10 to 14 Minutes | 0 (0.0%) | 0 (0.0%) |
| 15 to 19 Minutes | 0 (0.0%) | 26 (9.8%) |
| 20 to 24 Minutes | 113 (24.8%) | 12 (4.5%) |
| 25 to 29 Minutes | 0 (0.0%) | 0 (0.0%) |
| 30 to 34 Minutes | 13 (2.9%) | 44 (16.5%) |
| 35 to 39 Minutes | 65 (14.3%) | 0 (0.0%) |
| 40 to 44 Minutes | 25 (5.5%) | 0 (0.0%) |
| 45 to 59 Minutes | 62 (13.6%) | 12 (4.5%) |
| 60 to 89 Minutes | 48 (10.5%) | 10 (3.8%) |
| 90 or more Minutes | 57 (12.5%) | 22 (8.3%) |
Time of Departure to Work by Sex in Seaside Heights borough
The most frequent times of departure to work in Seaside Heights borough are 12:00 AM to 4:59 AM (81, 17.8%) for males and 8:00 AM to 8:29 AM (99, 37.2%) for females.
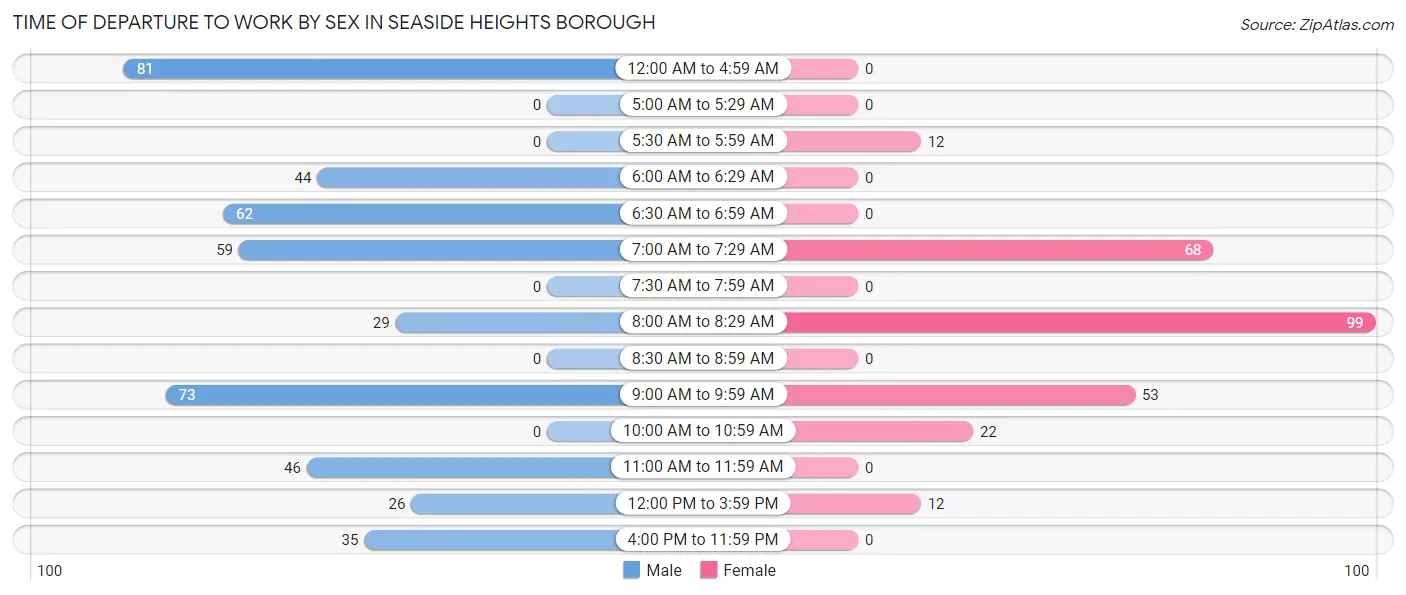
| Time of Departure | Male | Female |
| 12:00 AM to 4:59 AM | 81 (17.8%) | 0 (0.0%) |
| 5:00 AM to 5:29 AM | 0 (0.0%) | 0 (0.0%) |
| 5:30 AM to 5:59 AM | 0 (0.0%) | 12 (4.5%) |
| 6:00 AM to 6:29 AM | 44 (9.7%) | 0 (0.0%) |
| 6:30 AM to 6:59 AM | 62 (13.6%) | 0 (0.0%) |
| 7:00 AM to 7:29 AM | 59 (13.0%) | 68 (25.6%) |
| 7:30 AM to 7:59 AM | 0 (0.0%) | 0 (0.0%) |
| 8:00 AM to 8:29 AM | 29 (6.4%) | 99 (37.2%) |
| 8:30 AM to 8:59 AM | 0 (0.0%) | 0 (0.0%) |
| 9:00 AM to 9:59 AM | 73 (16.0%) | 53 (19.9%) |
| 10:00 AM to 10:59 AM | 0 (0.0%) | 22 (8.3%) |
| 11:00 AM to 11:59 AM | 46 (10.1%) | 0 (0.0%) |
| 12:00 PM to 3:59 PM | 26 (5.7%) | 12 (4.5%) |
| 4:00 PM to 11:59 PM | 35 (7.7%) | 0 (0.0%) |
| Total | 455 (100.0%) | 266 (100.0%) |
Housing Occupancy in Seaside Heights borough
Occupancy by Ownership in Seaside Heights borough
Of the total 1,046 dwellings in Seaside Heights borough, owner-occupied units account for 400 (38.2%), while renter-occupied units make up 646 (61.8%).
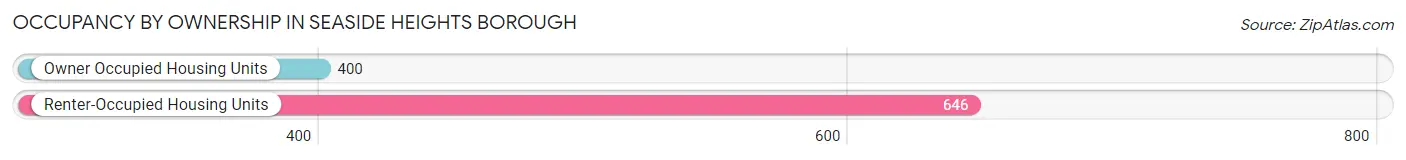
| Occupancy | # Housing Units | % Housing Units |
| Owner Occupied Housing Units | 400 | 38.2% |
| Renter-Occupied Housing Units | 646 | 61.8% |
| Total Occupied Housing Units | 1,046 | 100.0% |
Occupancy by Household Size in Seaside Heights borough
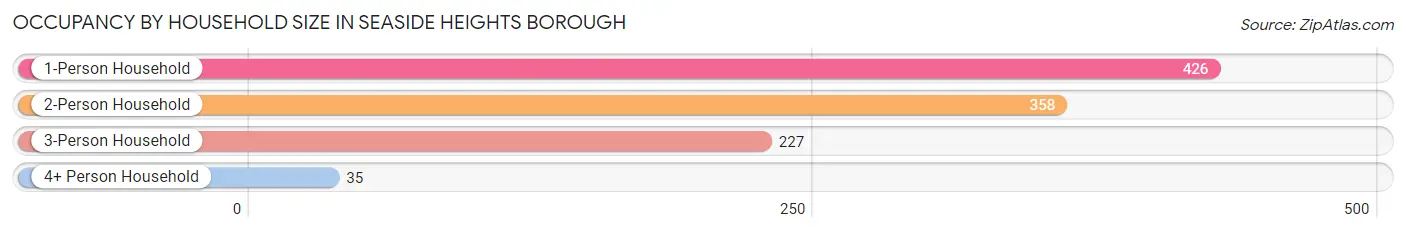
| Household Size | # Housing Units | % Housing Units |
| 1-Person Household | 426 | 40.7% |
| 2-Person Household | 358 | 34.2% |
| 3-Person Household | 227 | 21.7% |
| 4+ Person Household | 35 | 3.4% |
| Total Housing Units | 1,046 | 100.0% |
Occupancy by Ownership by Household Size in Seaside Heights borough
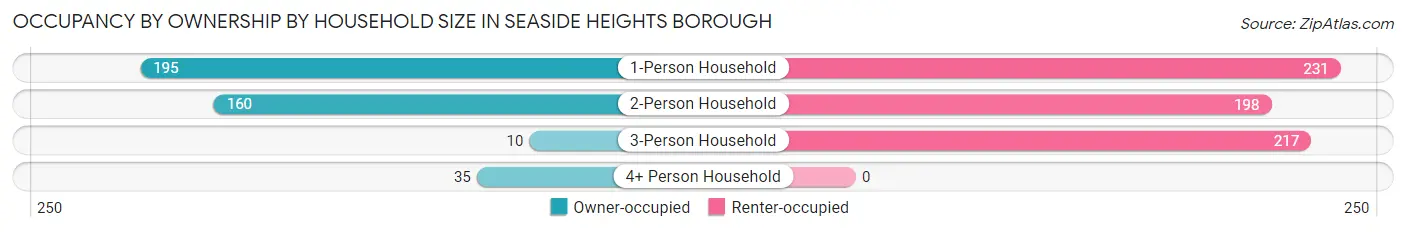
| Household Size | Owner-occupied | Renter-occupied |
| 1-Person Household | 195 (45.8%) | 231 (54.2%) |
| 2-Person Household | 160 (44.7%) | 198 (55.3%) |
| 3-Person Household | 10 (4.4%) | 217 (95.6%) |
| 4+ Person Household | 35 (100.0%) | 0 (0.0%) |
| Total Housing Units | 400 (38.2%) | 646 (61.8%) |
Occupancy by Educational Attainment in Seaside Heights borough
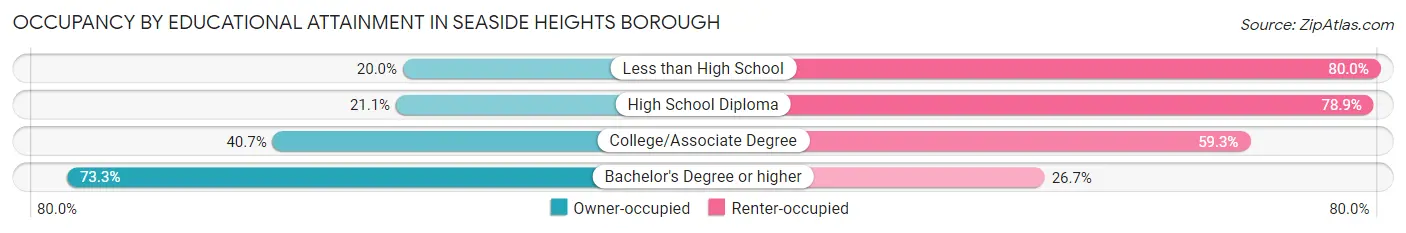
| Household Size | Owner-occupied | Renter-occupied |
| Less than High School | 34 (20.0%) | 136 (80.0%) |
| High School Diploma | 96 (21.1%) | 359 (78.9%) |
| College/Associate Degree | 48 (40.7%) | 70 (59.3%) |
| Bachelor's Degree or higher | 222 (73.3%) | 81 (26.7%) |
Occupancy by Age of Householder in Seaside Heights borough
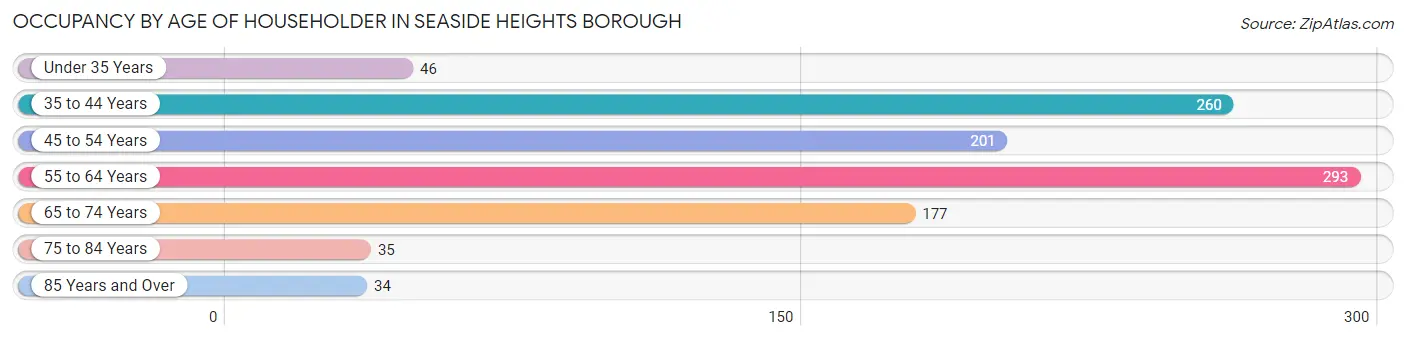
| Age Bracket | # Households | % Households |
| Under 35 Years | 46 | 4.4% |
| 35 to 44 Years | 260 | 24.9% |
| 45 to 54 Years | 201 | 19.2% |
| 55 to 64 Years | 293 | 28.0% |
| 65 to 74 Years | 177 | 16.9% |
| 75 to 84 Years | 35 | 3.4% |
| 85 Years and Over | 34 | 3.3% |
| Total | 1,046 | 100.0% |
Housing Finances in Seaside Heights borough
Median Income by Occupancy in Seaside Heights borough
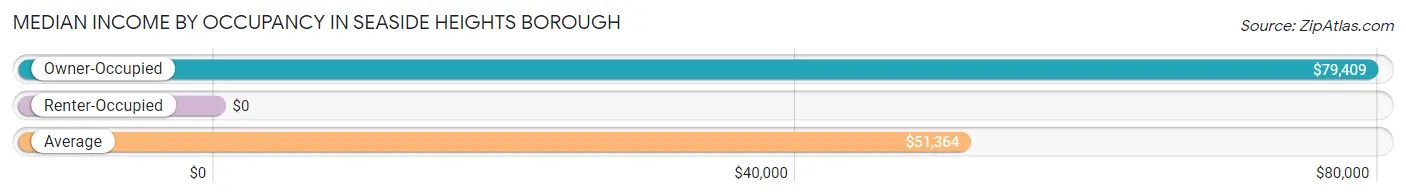
| Occupancy Type | # Households | Median Income |
| Owner-Occupied | 400 (38.2%) | $79,409 |
| Renter-Occupied | 646 (61.8%) | $0 |
| Average | 1,046 (100.0%) | $51,364 |
Occupancy by Householder Income Bracket in Seaside Heights borough
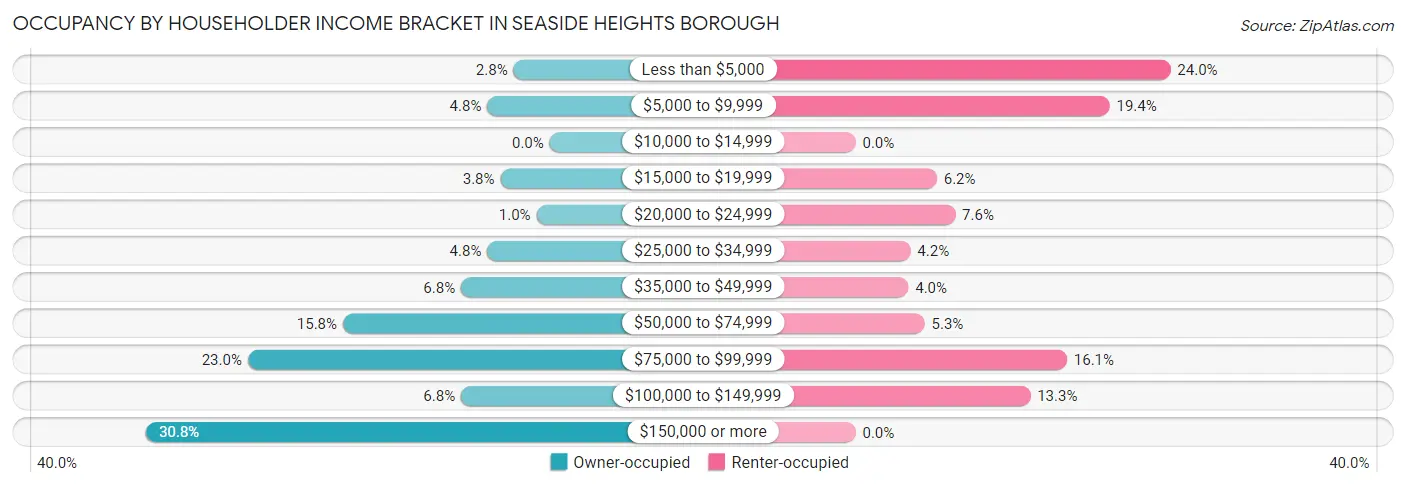
| Income Bracket | Owner-occupied | Renter-occupied |
| Less than $5,000 | 11 (2.8%) | 155 (24.0%) |
| $5,000 to $9,999 | 19 (4.8%) | 125 (19.4%) |
| $10,000 to $14,999 | 0 (0.0%) | 0 (0.0%) |
| $15,000 to $19,999 | 15 (3.7%) | 40 (6.2%) |
| $20,000 to $24,999 | 4 (1.0%) | 49 (7.6%) |
| $25,000 to $34,999 | 19 (4.8%) | 27 (4.2%) |
| $35,000 to $49,999 | 27 (6.8%) | 26 (4.0%) |
| $50,000 to $74,999 | 63 (15.8%) | 34 (5.3%) |
| $75,000 to $99,999 | 92 (23.0%) | 104 (16.1%) |
| $100,000 to $149,999 | 27 (6.8%) | 86 (13.3%) |
| $150,000 or more | 123 (30.7%) | 0 (0.0%) |
| Total | 400 (100.0%) | 646 (100.0%) |
Monthly Housing Cost Tiers in Seaside Heights borough
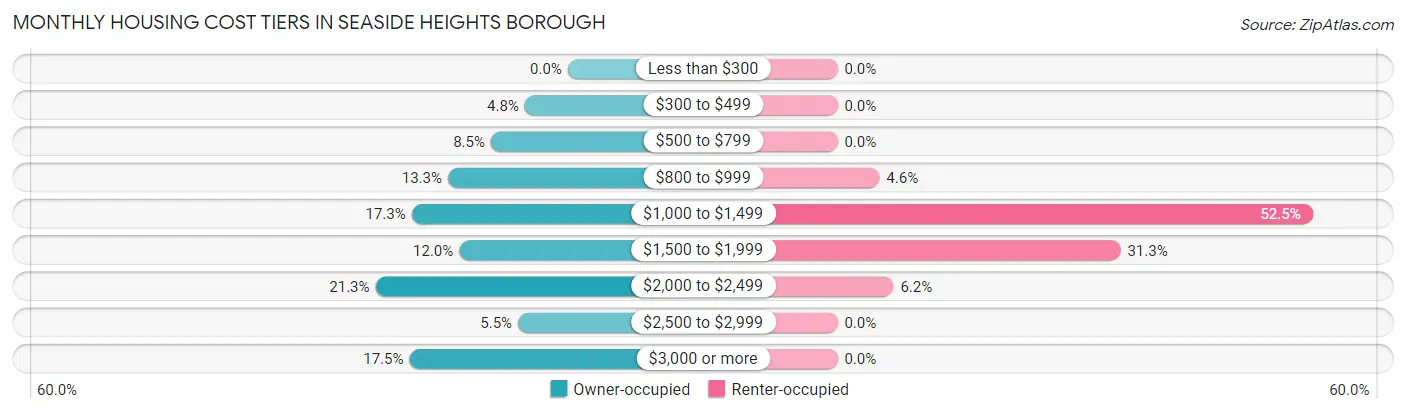
| Monthly Cost | Owner-occupied | Renter-occupied |
| Less than $300 | 0 (0.0%) | 0 (0.0%) |
| $300 to $499 | 19 (4.8%) | 0 (0.0%) |
| $500 to $799 | 34 (8.5%) | 0 (0.0%) |
| $800 to $999 | 53 (13.3%) | 30 (4.6%) |
| $1,000 to $1,499 | 69 (17.2%) | 339 (52.5%) |
| $1,500 to $1,999 | 48 (12.0%) | 202 (31.3%) |
| $2,000 to $2,499 | 85 (21.2%) | 40 (6.2%) |
| $2,500 to $2,999 | 22 (5.5%) | 0 (0.0%) |
| $3,000 or more | 70 (17.5%) | 0 (0.0%) |
| Total | 400 (100.0%) | 646 (100.0%) |
Physical Housing Characteristics in Seaside Heights borough
Housing Structures in Seaside Heights borough
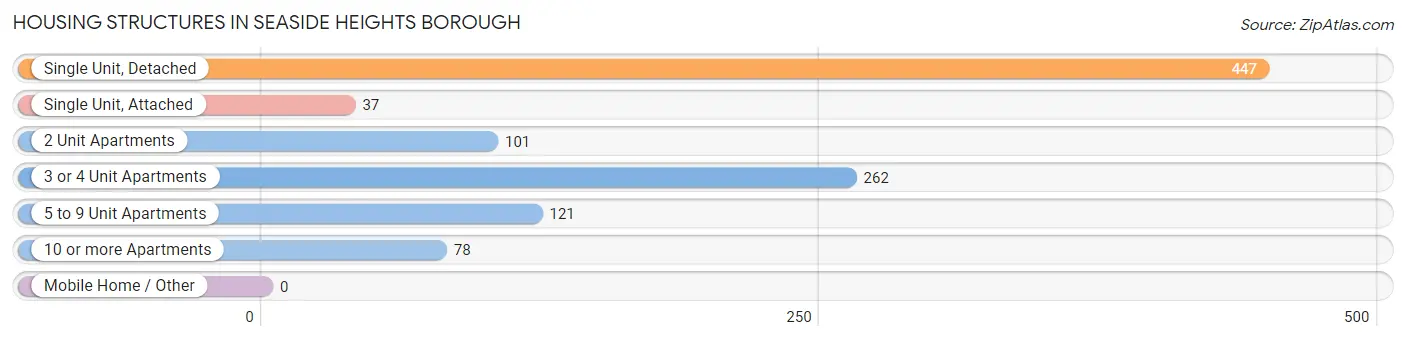
| Structure Type | # Housing Units | % Housing Units |
| Single Unit, Detached | 447 | 42.7% |
| Single Unit, Attached | 37 | 3.5% |
| 2 Unit Apartments | 101 | 9.7% |
| 3 or 4 Unit Apartments | 262 | 25.1% |
| 5 to 9 Unit Apartments | 121 | 11.6% |
| 10 or more Apartments | 78 | 7.5% |
| Mobile Home / Other | 0 | 0.0% |
| Total | 1,046 | 100.0% |
Housing Structures by Occupancy in Seaside Heights borough
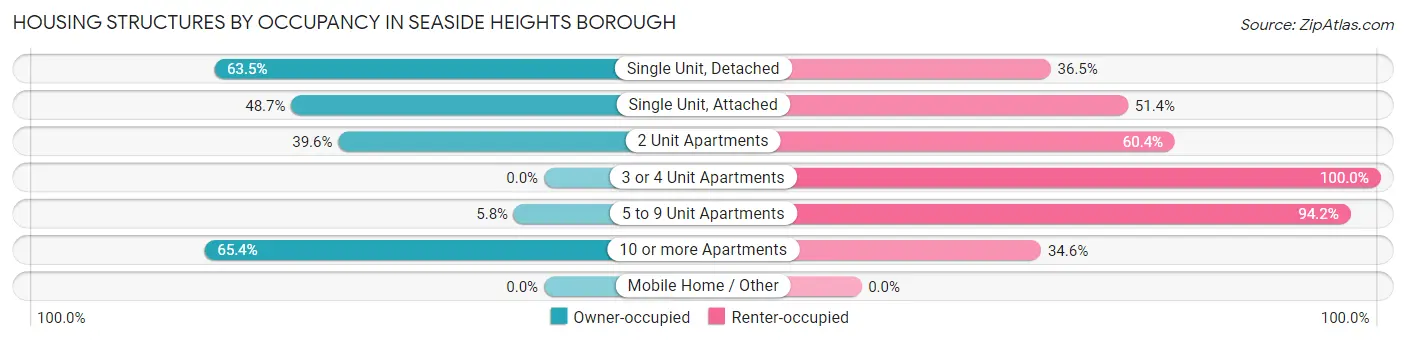
| Structure Type | Owner-occupied | Renter-occupied |
| Single Unit, Detached | 284 (63.5%) | 163 (36.5%) |
| Single Unit, Attached | 18 (48.6%) | 19 (51.3%) |
| 2 Unit Apartments | 40 (39.6%) | 61 (60.4%) |
| 3 or 4 Unit Apartments | 0 (0.0%) | 262 (100.0%) |
| 5 to 9 Unit Apartments | 7 (5.8%) | 114 (94.2%) |
| 10 or more Apartments | 51 (65.4%) | 27 (34.6%) |
| Mobile Home / Other | 0 (0.0%) | 0 (0.0%) |
| Total | 400 (38.2%) | 646 (61.8%) |
Housing Structures by Number of Rooms in Seaside Heights borough
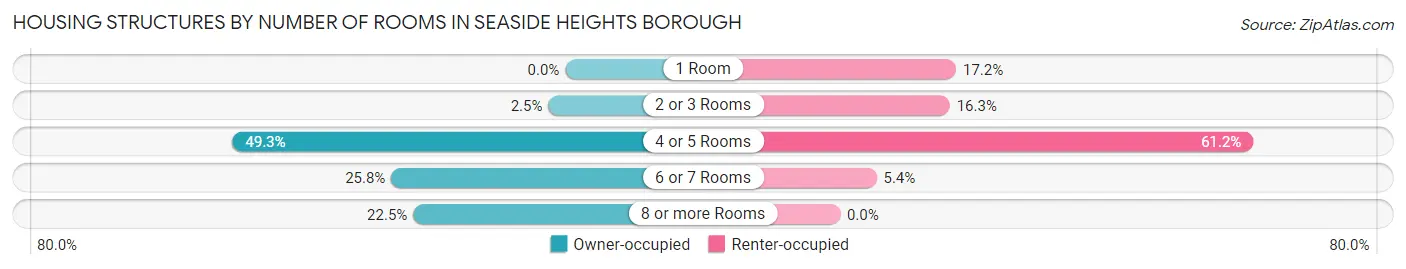
| Number of Rooms | Owner-occupied | Renter-occupied |
| 1 Room | 0 (0.0%) | 111 (17.2%) |
| 2 or 3 Rooms | 10 (2.5%) | 105 (16.3%) |
| 4 or 5 Rooms | 197 (49.2%) | 395 (61.2%) |
| 6 or 7 Rooms | 103 (25.8%) | 35 (5.4%) |
| 8 or more Rooms | 90 (22.5%) | 0 (0.0%) |
| Total | 400 (100.0%) | 646 (100.0%) |
Housing Structure by Heating Type in Seaside Heights borough
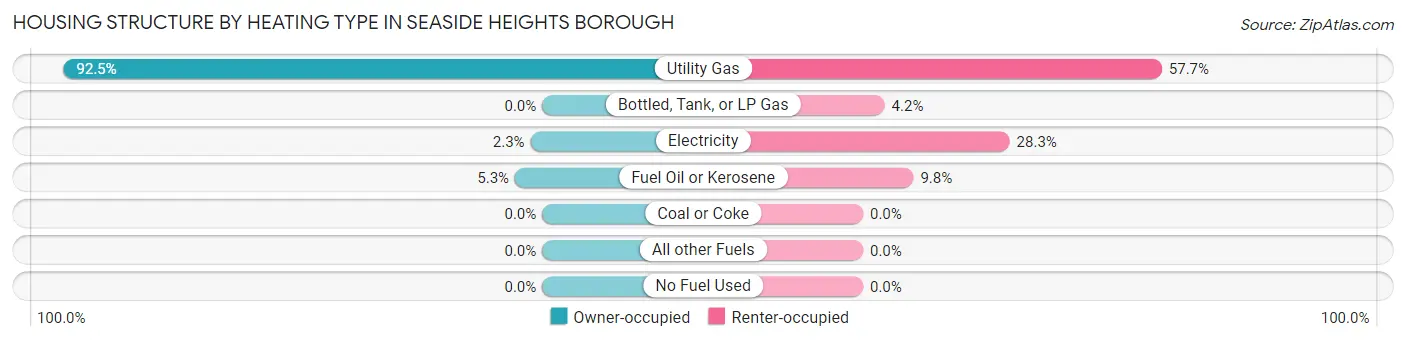
| Heating Type | Owner-occupied | Renter-occupied |
| Utility Gas | 370 (92.5%) | 373 (57.7%) |
| Bottled, Tank, or LP Gas | 0 (0.0%) | 27 (4.2%) |
| Electricity | 9 (2.2%) | 183 (28.3%) |
| Fuel Oil or Kerosene | 21 (5.2%) | 63 (9.8%) |
| Coal or Coke | 0 (0.0%) | 0 (0.0%) |
| All other Fuels | 0 (0.0%) | 0 (0.0%) |
| No Fuel Used | 0 (0.0%) | 0 (0.0%) |
| Total | 400 (100.0%) | 646 (100.0%) |
Household Vehicle Usage in Seaside Heights borough
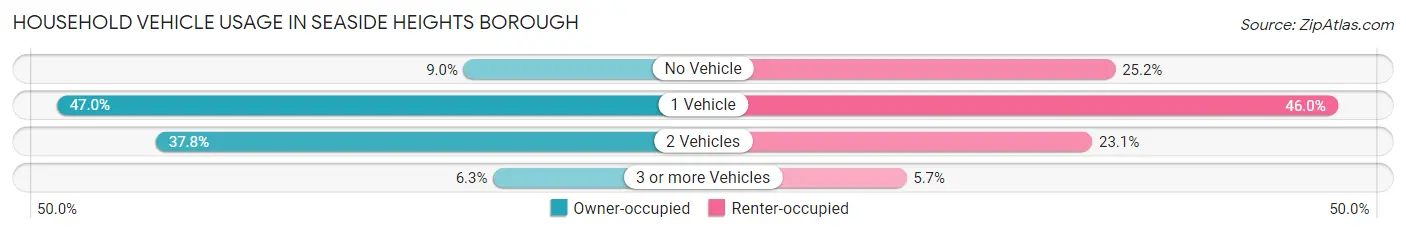
| Vehicles per Household | Owner-occupied | Renter-occupied |
| No Vehicle | 36 (9.0%) | 163 (25.2%) |
| 1 Vehicle | 188 (47.0%) | 297 (46.0%) |
| 2 Vehicles | 151 (37.8%) | 149 (23.1%) |
| 3 or more Vehicles | 25 (6.2%) | 37 (5.7%) |
| Total | 400 (100.0%) | 646 (100.0%) |
Real Estate & Mortgages in Seaside Heights borough
Real Estate and Mortgage Overview in Seaside Heights borough
| Characteristic | Without Mortgage | With Mortgage |
| Housing Units | 133 | 267 |
| Median Property Value | $364,800 | $376,600 |
| Median Household Income | $60,917 | $92 |
| Monthly Housing Costs | $825 | $70 |
| Real Estate Taxes | $6,168 | $0 |
Property Value by Mortgage Status in Seaside Heights borough
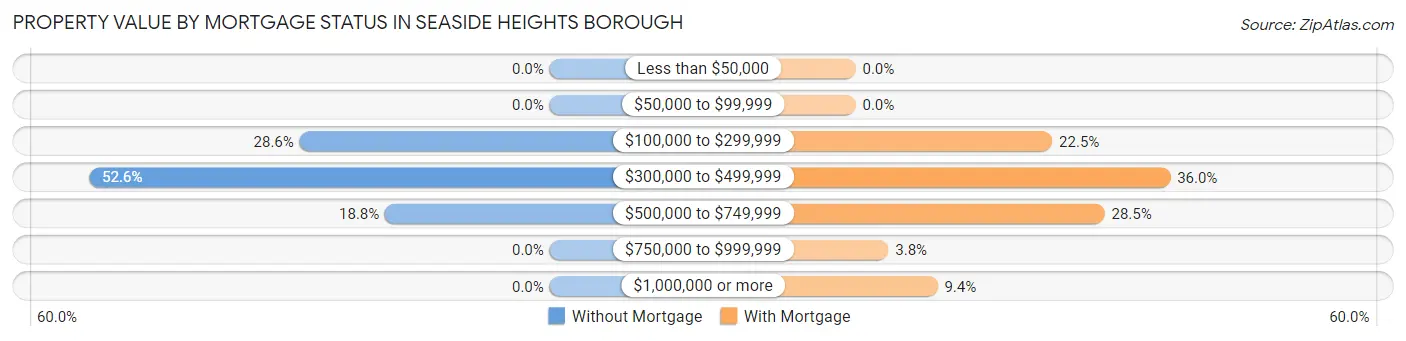
| Property Value | Without Mortgage | With Mortgage |
| Less than $50,000 | 0 (0.0%) | 0 (0.0%) |
| $50,000 to $99,999 | 0 (0.0%) | 0 (0.0%) |
| $100,000 to $299,999 | 38 (28.6%) | 60 (22.5%) |
| $300,000 to $499,999 | 70 (52.6%) | 96 (36.0%) |
| $500,000 to $749,999 | 25 (18.8%) | 76 (28.5%) |
| $750,000 to $999,999 | 0 (0.0%) | 10 (3.7%) |
| $1,000,000 or more | 0 (0.0%) | 25 (9.4%) |
| Total | 133 (100.0%) | 267 (100.0%) |
Household Income by Mortgage Status in Seaside Heights borough
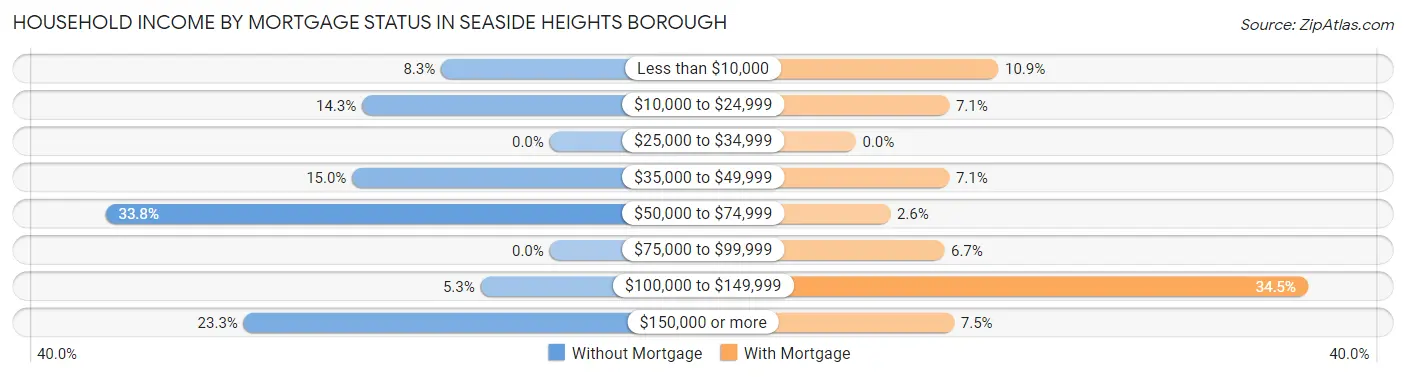
| Household Income | Without Mortgage | With Mortgage |
| Less than $10,000 | 11 (8.3%) | 29 (10.9%) |
| $10,000 to $24,999 | 19 (14.3%) | 19 (7.1%) |
| $25,000 to $34,999 | 0 (0.0%) | 0 (0.0%) |
| $35,000 to $49,999 | 20 (15.0%) | 19 (7.1%) |
| $50,000 to $74,999 | 45 (33.8%) | 7 (2.6%) |
| $75,000 to $99,999 | 0 (0.0%) | 18 (6.7%) |
| $100,000 to $149,999 | 7 (5.3%) | 92 (34.5%) |
| $150,000 or more | 31 (23.3%) | 20 (7.5%) |
| Total | 133 (100.0%) | 267 (100.0%) |
Property Value to Household Income Ratio in Seaside Heights borough
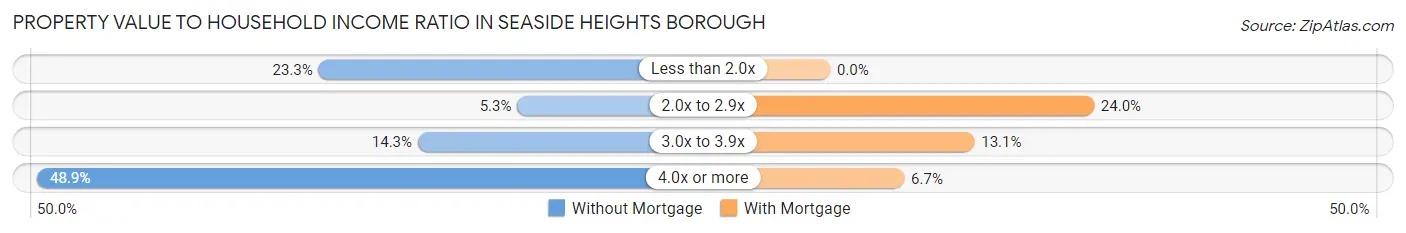
| Value-to-Income Ratio | Without Mortgage | With Mortgage |
| Less than 2.0x | 31 (23.3%) | 0 (0.0%) |
| 2.0x to 2.9x | 7 (5.3%) | 64 (24.0%) |
| 3.0x to 3.9x | 19 (14.3%) | 35 (13.1%) |
| 4.0x or more | 65 (48.9%) | 18 (6.7%) |
| Total | 133 (100.0%) | 267 (100.0%) |
Real Estate Taxes by Mortgage Status in Seaside Heights borough
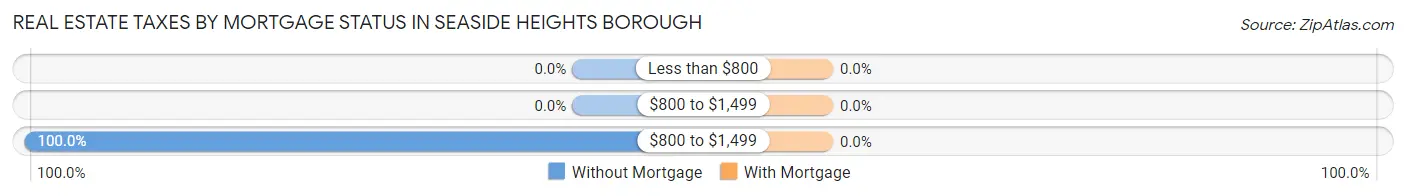
| Property Taxes | Without Mortgage | With Mortgage |
| Less than $800 | 0 (0.0%) | 0 (0.0%) |
| $800 to $1,499 | 0 (0.0%) | 0 (0.0%) |
| $800 to $1,499 | 133 (100.0%) | 0 (0.0%) |
| Total | 133 (100.0%) | 267 (100.0%) |
Health & Disability in Seaside Heights borough
Health Insurance Coverage by Age in Seaside Heights borough
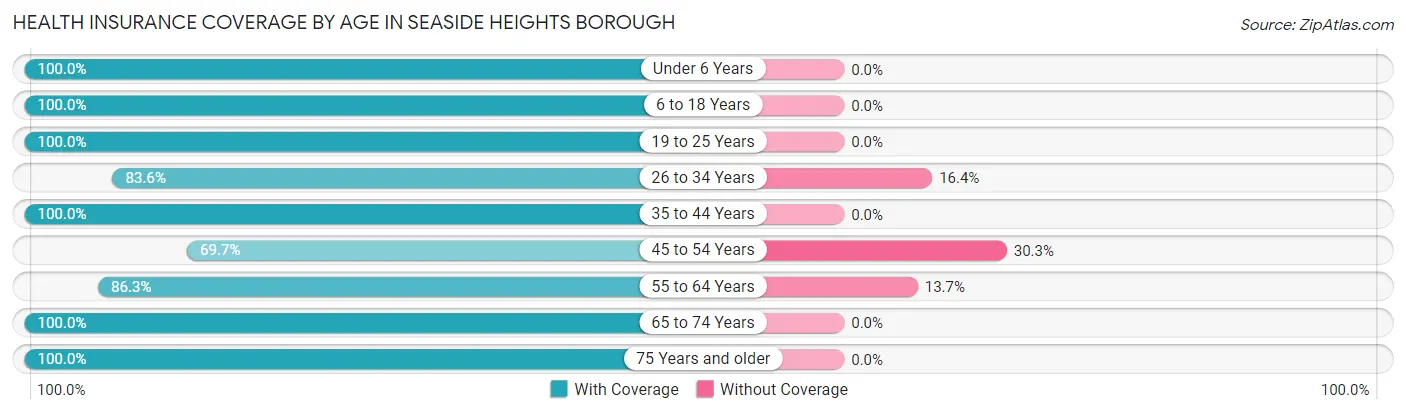
| Age Bracket | With Coverage | Without Coverage |
| Under 6 Years | 108 (100.0%) | 0 (0.0%) |
| 6 to 18 Years | 234 (100.0%) | 0 (0.0%) |
| 19 to 25 Years | 234 (100.0%) | 0 (0.0%) |
| 26 to 34 Years | 51 (83.6%) | 10 (16.4%) |
| 35 to 44 Years | 356 (100.0%) | 0 (0.0%) |
| 45 to 54 Years | 246 (69.7%) | 107 (30.3%) |
| 55 to 64 Years | 334 (86.3%) | 53 (13.7%) |
| 65 to 74 Years | 215 (100.0%) | 0 (0.0%) |
| 75 Years and older | 79 (100.0%) | 0 (0.0%) |
| Total | 1,857 (91.6%) | 170 (8.4%) |
Health Insurance Coverage by Citizenship Status in Seaside Heights borough
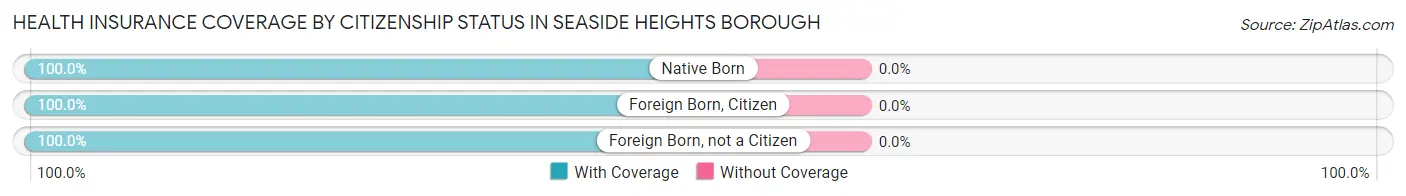
| Citizenship Status | With Coverage | Without Coverage |
| Native Born | 108 (100.0%) | 0 (0.0%) |
| Foreign Born, Citizen | 234 (100.0%) | 0 (0.0%) |
| Foreign Born, not a Citizen | 234 (100.0%) | 0 (0.0%) |
Health Insurance Coverage by Household Income in Seaside Heights borough
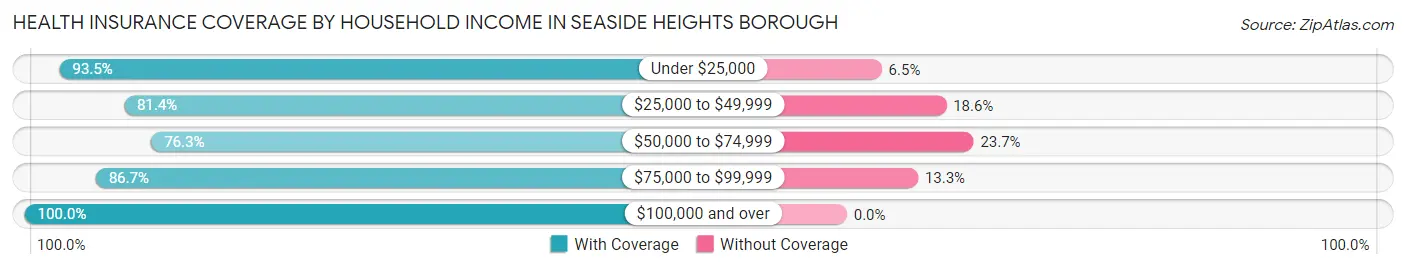
| Household Income | With Coverage | Without Coverage |
| Under $25,000 | 673 (93.5%) | 47 (6.5%) |
| $25,000 to $49,999 | 153 (81.4%) | 35 (18.6%) |
| $50,000 to $74,999 | 90 (76.3%) | 28 (23.7%) |
| $75,000 to $99,999 | 390 (86.7%) | 60 (13.3%) |
| $100,000 and over | 546 (100.0%) | 0 (0.0%) |
Public vs Private Health Insurance Coverage by Age in Seaside Heights borough
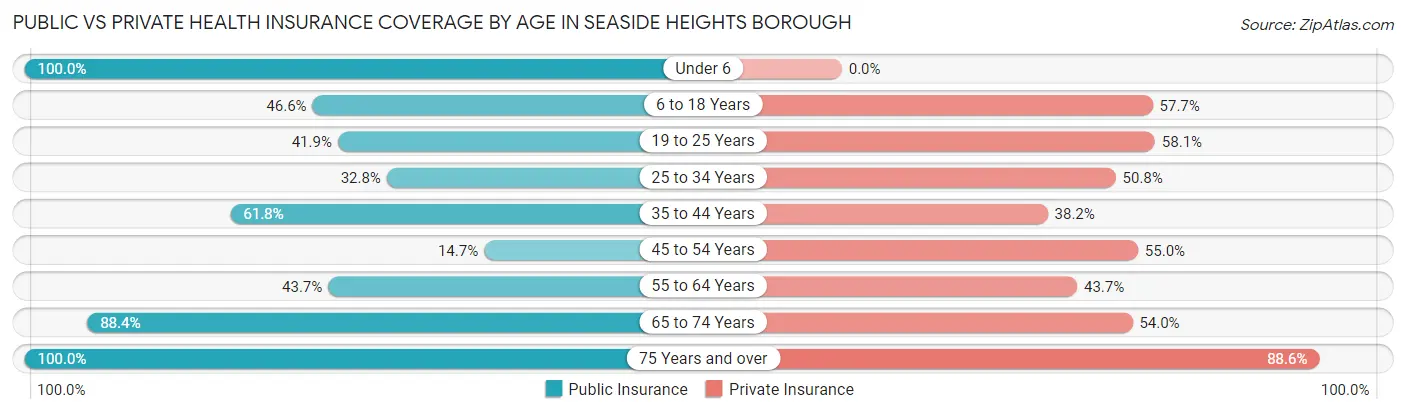
| Age Bracket | Public Insurance | Private Insurance |
| Under 6 | 108 (100.0%) | 0 (0.0%) |
| 6 to 18 Years | 109 (46.6%) | 135 (57.7%) |
| 19 to 25 Years | 98 (41.9%) | 136 (58.1%) |
| 25 to 34 Years | 20 (32.8%) | 31 (50.8%) |
| 35 to 44 Years | 220 (61.8%) | 136 (38.2%) |
| 45 to 54 Years | 52 (14.7%) | 194 (55.0%) |
| 55 to 64 Years | 169 (43.7%) | 169 (43.7%) |
| 65 to 74 Years | 190 (88.4%) | 116 (53.9%) |
| 75 Years and over | 79 (100.0%) | 70 (88.6%) |
| Total | 1,045 (51.5%) | 987 (48.7%) |
Disability Status by Sex by Age in Seaside Heights borough
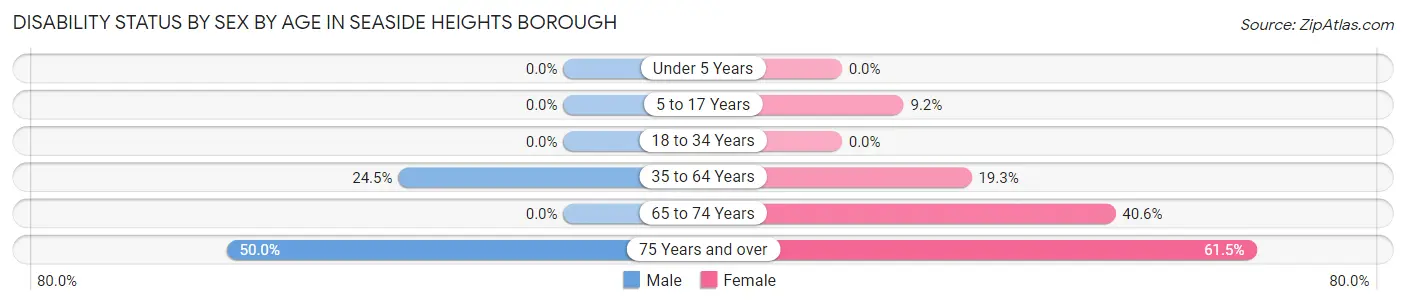
| Age Bracket | Male | Female |
| Under 5 Years | 0 (0.0%) | 0 (0.0%) |
| 5 to 17 Years | 0 (0.0%) | 10 (9.2%) |
| 18 to 34 Years | 0 (0.0%) | 0 (0.0%) |
| 35 to 64 Years | 163 (24.5%) | 83 (19.3%) |
| 65 to 74 Years | 0 (0.0%) | 39 (40.6%) |
| 75 Years and over | 20 (50.0%) | 24 (61.5%) |
Disability Class by Sex by Age in Seaside Heights borough
Disability Class: Hearing Difficulty
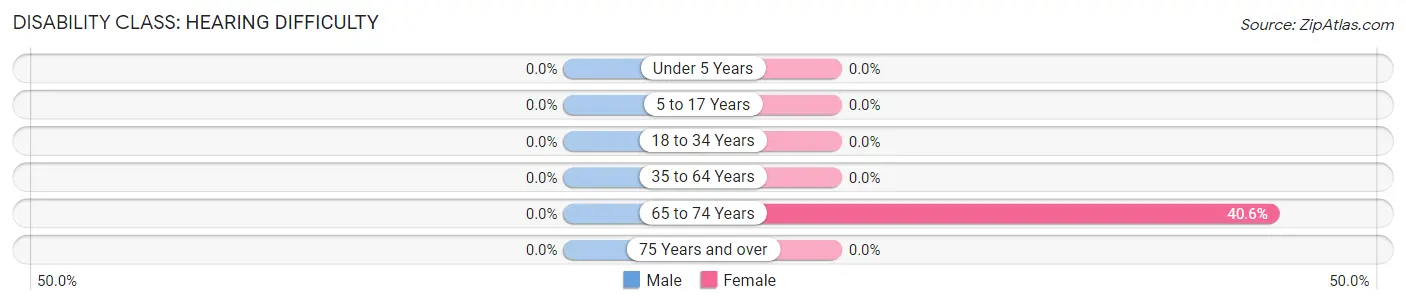
| Age Bracket | Male | Female |
| Under 5 Years | 0 (0.0%) | 0 (0.0%) |
| 5 to 17 Years | 0 (0.0%) | 0 (0.0%) |
| 18 to 34 Years | 0 (0.0%) | 0 (0.0%) |
| 35 to 64 Years | 0 (0.0%) | 0 (0.0%) |
| 65 to 74 Years | 0 (0.0%) | 39 (40.6%) |
| 75 Years and over | 0 (0.0%) | 0 (0.0%) |
Disability Class: Vision Difficulty
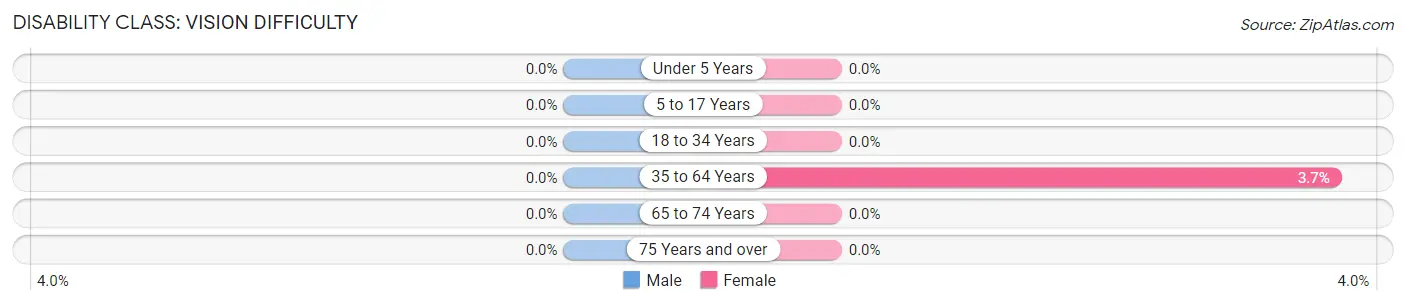
| Age Bracket | Male | Female |
| Under 5 Years | 0 (0.0%) | 0 (0.0%) |
| 5 to 17 Years | 0 (0.0%) | 0 (0.0%) |
| 18 to 34 Years | 0 (0.0%) | 0 (0.0%) |
| 35 to 64 Years | 0 (0.0%) | 16 (3.7%) |
| 65 to 74 Years | 0 (0.0%) | 0 (0.0%) |
| 75 Years and over | 0 (0.0%) | 0 (0.0%) |
Disability Class: Cognitive Difficulty
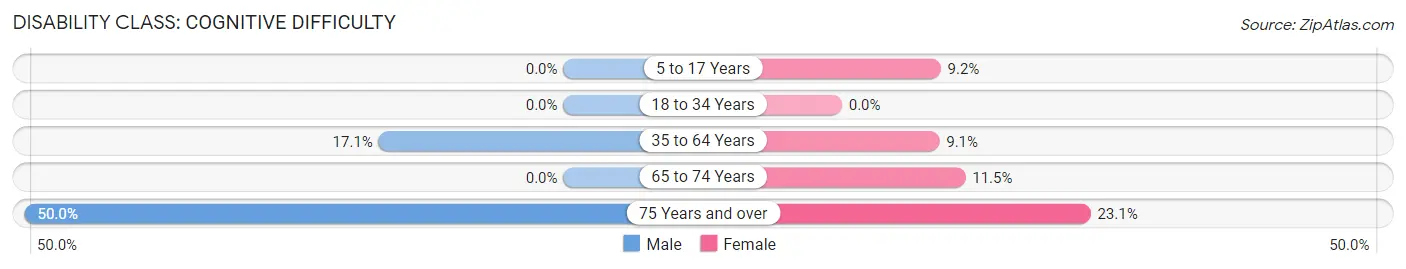
| Age Bracket | Male | Female |
| 5 to 17 Years | 0 (0.0%) | 10 (9.2%) |
| 18 to 34 Years | 0 (0.0%) | 0 (0.0%) |
| 35 to 64 Years | 114 (17.1%) | 39 (9.0%) |
| 65 to 74 Years | 0 (0.0%) | 11 (11.5%) |
| 75 Years and over | 20 (50.0%) | 9 (23.1%) |
Disability Class: Ambulatory Difficulty
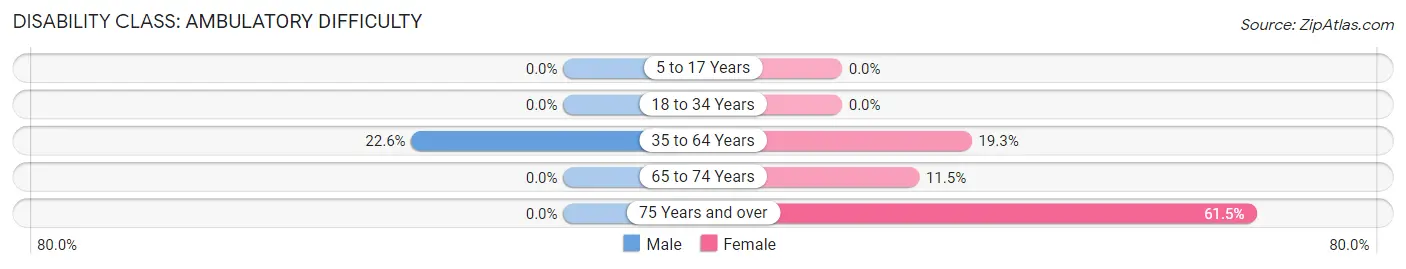
| Age Bracket | Male | Female |
| 5 to 17 Years | 0 (0.0%) | 0 (0.0%) |
| 18 to 34 Years | 0 (0.0%) | 0 (0.0%) |
| 35 to 64 Years | 150 (22.6%) | 83 (19.3%) |
| 65 to 74 Years | 0 (0.0%) | 11 (11.5%) |
| 75 Years and over | 0 (0.0%) | 24 (61.5%) |
Disability Class: Self-Care Difficulty
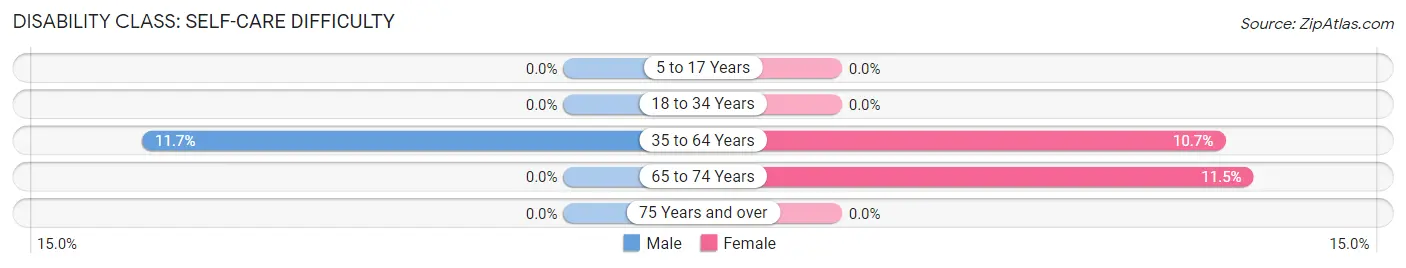
| Age Bracket | Male | Female |
| 5 to 17 Years | 0 (0.0%) | 0 (0.0%) |
| 18 to 34 Years | 0 (0.0%) | 0 (0.0%) |
| 35 to 64 Years | 78 (11.7%) | 46 (10.7%) |
| 65 to 74 Years | 0 (0.0%) | 11 (11.5%) |
| 75 Years and over | 0 (0.0%) | 0 (0.0%) |
Technology Access in Seaside Heights borough
Computing Device Access in Seaside Heights borough
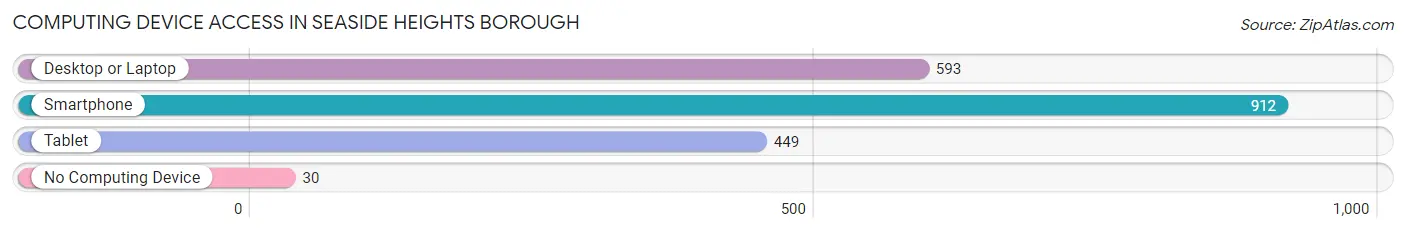
| Device Type | # Households | % Households |
| Desktop or Laptop | 593 | 56.7% |
| Smartphone | 912 | 87.2% |
| Tablet | 449 | 42.9% |
| No Computing Device | 30 | 2.9% |
| Total | 1,046 | 100.0% |
Internet Access in Seaside Heights borough
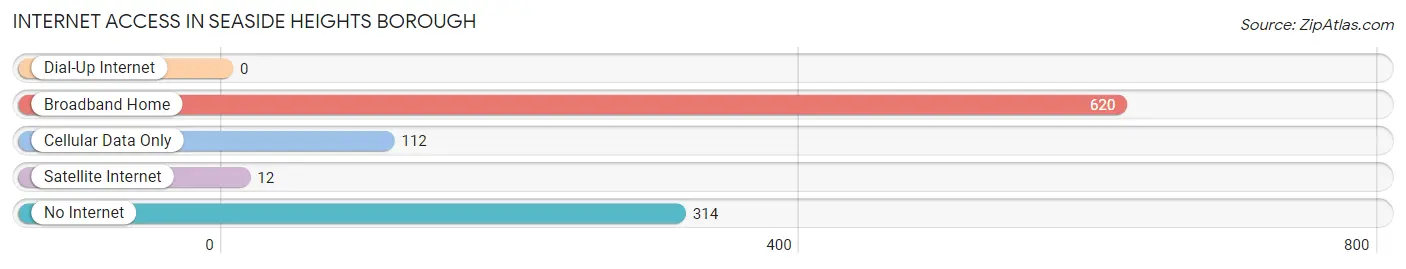
| Internet Type | # Households | % Households |
| Dial-Up Internet | 0 | 0.0% |
| Broadband Home | 620 | 59.3% |
| Cellular Data Only | 112 | 10.7% |
| Satellite Internet | 12 | 1.1% |
| No Internet | 314 | 30.0% |
| Total | 1,046 | 100.0% |
Seaside Heights borough Summary
Seaside Heights Borough is a small borough located in Ocean County, New Jersey. It is situated on the Barnegat Peninsula, a long, narrow strip of land that separates Barnegat Bay from the Atlantic Ocean. The borough is bordered by Berkeley Township to the north, Toms River Township to the west, and the Atlantic Ocean to the east. Seaside Heights is a popular summer destination for tourists and beachgoers, and is known for its boardwalk, amusement rides, and beachfront attractions.
History
The area that is now Seaside Heights was originally inhabited by the Lenape Native Americans. The first European settlers arrived in the area in the late 17th century, and the area was part of Berkeley Township until it was incorporated as a borough in 1913. The borough was named after the nearby community of Seaside Park, which was established in 1878.
The borough was a popular summer destination for tourists and beachgoers in the early 20th century, and the boardwalk was built in 1920. The boardwalk was destroyed by a fire in 1932, but was quickly rebuilt. The borough was also home to a number of amusement parks, including Casino Pier, which opened in 1932.
Geography
Seaside Heights is located at 39°55'N 74°05'W (39.917, -74.083). According to the United States Census Bureau, the borough has a total area of 1.2 square miles (3.2 km2), all of which is land.
The borough is situated on the Barnegat Peninsula, a long, narrow strip of land that separates Barnegat Bay from the Atlantic Ocean. The borough is bordered by Berkeley Township to the north, Toms River Township to the west, and the Atlantic Ocean to the east.
Economy
The economy of Seaside Heights is largely based on tourism. The borough is a popular summer destination for tourists and beachgoers, and is known for its boardwalk, amusement rides, and beachfront attractions. The borough is also home to a number of restaurants, bars, and shops.
Demographics
As of the 2010 United States Census, there were 2,887 people, 1,093 households, and 690 families residing in the borough. The population density was 2,400.3 people per square mile (926.2/km2). There were 1,541 housing units at an average density of 1,269.2 per square mile (489.3/km2). The racial makeup of the borough was 92.2% White, 2.2% African American, 0.2% Native American, 1.7% Asian, 0.1% Pacific Islander, 1.7% from other races, and 2.0% from two or more races. Hispanic or Latino of any race were 6.2% of the population.
There were 1,093 households, out of which 28.2% had children under the age of 18 living with them, 44.2% were married couples living together, 12.2% had a female householder with no husband present, and 37.2% were non-families. 30.2% of all households were made up of individuals, and 10.2% had someone living alone who was 65 years of age or older. The average household size was 2.63 and the average family size was 3.27.
In the borough, the population was spread out, with 22.7% under the age of 18, 8.3% from 18 to 24, 28.7% from 25 to 44, 27.2% from 45 to 64, and 13.1% who were 65 years of age or older. The median age was 38.4 years. For every 100 females, there were 97.2 males. For every 100 females age 18 and over, there were 95.2 males.
The median income for a household in the borough was $50,972, and the median income for a family was $60,000. Males had a median income of $41,964 versus $31,250 for females. The per capita income for the borough was $24,945. About 5.2% of families and 7.2% of the population were below the poverty line, including 8.3% of those under age 18 and 5.2% of those age 65 or over.
Common Questions
What is Per Capita Income in Seaside Heights borough?
Per Capita income in Seaside Heights borough is $38,232.
What is the Median Household income in Seaside Heights borough?
Median Household Income in Seaside Heights borough is $51,364.
What is Income or Wage Gap in Seaside Heights borough?
Income or Wage Gap in Seaside Heights borough is 6.4%.
Women in Seaside Heights borough earn 93.6 cents for every dollar earned by a man.
What is Inequality or Gini Index in Seaside Heights borough?
Inequality or Gini Index in Seaside Heights borough is 0.57.
What is the Total Population of Seaside Heights borough?
Total Population of Seaside Heights borough is 2,027.
What is the Total Male Population of Seaside Heights borough?
Total Male Population of Seaside Heights borough is 1,291.
What is the Total Female Population of Seaside Heights borough?
Total Female Population of Seaside Heights borough is 736.
What is the Ratio of Males per 100 Females in Seaside Heights borough?
There are 175.41 Males per 100 Females in Seaside Heights borough.
What is the Ratio of Females per 100 Males in Seaside Heights borough?
There are 57.01 Females per 100 Males in Seaside Heights borough.
What is the Median Population Age in Seaside Heights borough?
Median Population Age in Seaside Heights borough is 47.4 Years.
What is the Average Family Size in Seaside Heights borough
Average Family Size in Seaside Heights borough is 2.7 People.
What is the Average Household Size in Seaside Heights borough
Average Household Size in Seaside Heights borough is 1.9 People.
How Large is the Labor Force in Seaside Heights borough?
There are 805 People in the Labor Forcein in Seaside Heights borough.
What is the Percentage of People in the Labor Force in Seaside Heights borough?
46.3% of People are in the Labor Force in Seaside Heights borough.
What is the Unemployment Rate in Seaside Heights borough?
Unemployment Rate in Seaside Heights borough is 5.7%.