Cities with the Most Immigrants from Portugal in New Jersey
RELATED REPORTS & OPTIONS
Portugal
New Jersey
Compare Cities
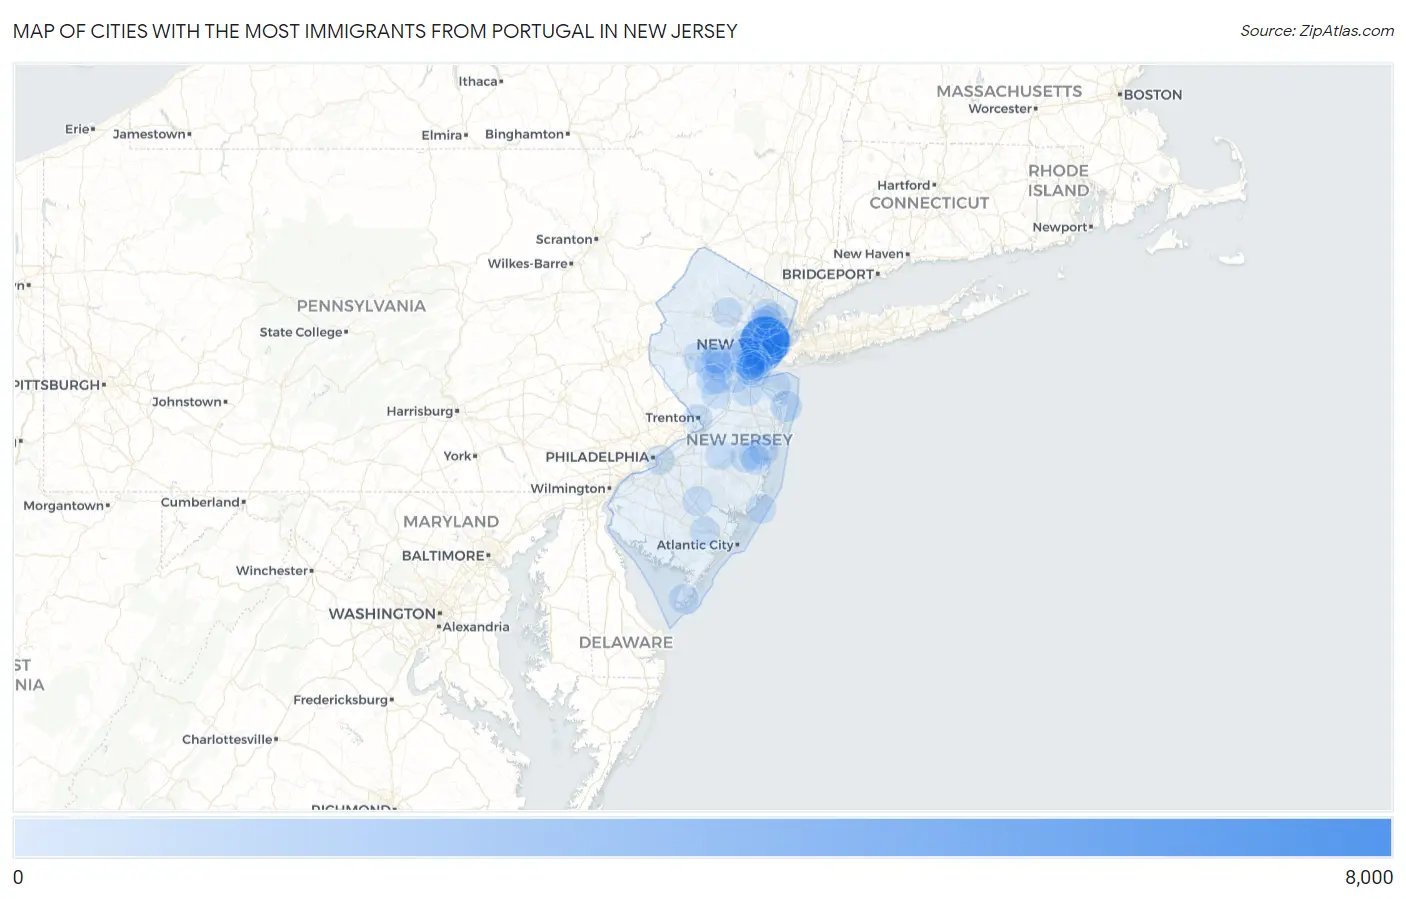
Map of Cities with the Most Immigrants from Portugal in New Jersey
0
8,000
Cities with the Most Immigrants from Portugal in New Jersey
| City | Portugal | vs State | vs National | |
| 1. | Newark | 6,281 | 28,871(21.76%)#1 | 169,177(3.71%)#3 |
| 2. | Elizabeth | 2,973 | 28,871(10.30%)#2 | 169,177(1.76%)#5 |
| 3. | Kearny | 2,126 | 28,871(7.36%)#3 | 169,177(1.26%)#8 |
| 4. | Linden | 1,266 | 28,871(4.39%)#4 | 169,177(0.75%)#14 |
| 5. | North Arlington Borough | 687 | 28,871(2.38%)#5 | 169,177(0.41%)#32 |
| 6. | South River Borough | 663 | 28,871(2.30%)#6 | 169,177(0.39%)#33 |
| 7. | Harrison | 483 | 28,871(1.67%)#7 | 169,177(0.29%)#43 |
| 8. | Sayreville Borough | 446 | 28,871(1.54%)#8 | 169,177(0.26%)#47 |
| 9. | Colonia | 409 | 28,871(1.42%)#9 | 169,177(0.24%)#51 |
| 10. | Lodi Borough | 384 | 28,871(1.33%)#10 | 169,177(0.23%)#55 |
| 11. | Long Branch | 379 | 28,871(1.31%)#11 | 169,177(0.22%)#56 |
| 12. | Rahway | 242 | 28,871(0.84%)#12 | 169,177(0.14%)#79 |
| 13. | Carteret Borough | 230 | 28,871(0.80%)#13 | 169,177(0.14%)#83 |
| 14. | Garfield | 172 | 28,871(0.60%)#14 | 169,177(0.10%)#102 |
| 15. | Martinsville | 170 | 28,871(0.59%)#15 | 169,177(0.10%)#106 |
| 16. | Flanders | 131 | 28,871(0.45%)#16 | 169,177(0.08%)#144 |
| 17. | Cliffside Park Borough | 107 | 28,871(0.37%)#17 | 169,177(0.06%)#179 |
| 18. | Eatontown Borough | 96 | 28,871(0.33%)#18 | 169,177(0.06%)#194 |
| 19. | Perth Amboy | 94 | 28,871(0.33%)#19 | 169,177(0.06%)#199 |
| 20. | Bradley Gardens | 86 | 28,871(0.30%)#20 | 169,177(0.05%)#215 |
| 21. | Jersey City | 85 | 28,871(0.29%)#21 | 169,177(0.05%)#216 |
| 22. | Toms River | 69 | 28,871(0.24%)#22 | 169,177(0.04%)#251 |
| 23. | Lake Hopatcong | 67 | 28,871(0.23%)#23 | 169,177(0.04%)#261 |
| 24. | Old Bridge | 66 | 28,871(0.23%)#24 | 169,177(0.04%)#266 |
| 25. | Avenel | 66 | 28,871(0.23%)#25 | 169,177(0.04%)#269 |
| 26. | Bound Brook Borough | 65 | 28,871(0.23%)#26 | 169,177(0.04%)#272 |
| 27. | Mountainside Borough | 62 | 28,871(0.21%)#27 | 169,177(0.04%)#283 |
| 28. | South Plainfield Borough | 59 | 28,871(0.20%)#28 | 169,177(0.03%)#297 |
| 29. | Towaco | 59 | 28,871(0.20%)#29 | 169,177(0.03%)#300 |
| 30. | Summit | 58 | 28,871(0.20%)#30 | 169,177(0.03%)#306 |
| 31. | Plainfield | 56 | 28,871(0.19%)#31 | 169,177(0.03%)#312 |
| 32. | Woodbridge | 55 | 28,871(0.19%)#32 | 169,177(0.03%)#319 |
| 33. | Paramus Borough | 52 | 28,871(0.18%)#33 | 169,177(0.03%)#334 |
| 34. | Roselle Borough | 51 | 28,871(0.18%)#34 | 169,177(0.03%)#344 |
| 35. | White Meadow Lake | 51 | 28,871(0.18%)#35 | 169,177(0.03%)#345 |
| 36. | Camden | 49 | 28,871(0.17%)#36 | 169,177(0.03%)#352 |
| 37. | Fords | 49 | 28,871(0.17%)#37 | 169,177(0.03%)#355 |
| 38. | Madison Borough | 47 | 28,871(0.16%)#38 | 169,177(0.03%)#368 |
| 39. | East Newark Borough | 47 | 28,871(0.16%)#39 | 169,177(0.03%)#371 |
| 40. | White House Station | 46 | 28,871(0.16%)#40 | 169,177(0.03%)#381 |
| 41. | Browns Mills | 44 | 28,871(0.15%)#41 | 169,177(0.03%)#396 |
| 42. | Fairview Borough | 43 | 28,871(0.15%)#42 | 169,177(0.03%)#407 |
| 43. | Westwood Borough | 43 | 28,871(0.15%)#43 | 169,177(0.03%)#408 |
| 44. | Springfield | 43 | 28,871(0.15%)#44 | 169,177(0.03%)#410 |
| 45. | Clifton | 42 | 28,871(0.15%)#45 | 169,177(0.02%)#414 |
| 46. | New Brunswick | 42 | 28,871(0.15%)#46 | 169,177(0.02%)#417 |
| 47. | Finderne | 42 | 28,871(0.15%)#47 | 169,177(0.02%)#424 |
| 48. | Jamesburg Borough | 41 | 28,871(0.14%)#48 | 169,177(0.02%)#431 |
| 49. | Union | 41 | 28,871(0.14%)#49 | 169,177(0.02%)#433 |
| 50. | Parsippany | 40 | 28,871(0.14%)#50 | 169,177(0.02%)#439 |
| 51. | The Hills | 40 | 28,871(0.14%)#51 | 169,177(0.02%)#440 |
| 52. | Crestwood Village | 40 | 28,871(0.14%)#52 | 169,177(0.02%)#441 |
| 53. | Westfield | 39 | 28,871(0.14%)#53 | 169,177(0.02%)#444 |
| 54. | North Plainfield Borough | 39 | 28,871(0.14%)#54 | 169,177(0.02%)#446 |
| 55. | Preakness | 39 | 28,871(0.14%)#55 | 169,177(0.02%)#447 |
| 56. | Troy Hills | 39 | 28,871(0.14%)#56 | 169,177(0.02%)#451 |
| 57. | Holiday City Berkeley | 38 | 28,871(0.13%)#57 | 169,177(0.02%)#458 |
| 58. | Upper Montclair | 37 | 28,871(0.13%)#58 | 169,177(0.02%)#466 |
| 59. | Kenilworth Borough | 37 | 28,871(0.13%)#59 | 169,177(0.02%)#468 |
| 60. | Ampere North | 37 | 28,871(0.13%)#60 | 169,177(0.02%)#469 |
| 61. | Tinton Falls Borough | 35 | 28,871(0.12%)#61 | 169,177(0.02%)#482 |
| 62. | Middlesex Borough | 35 | 28,871(0.12%)#62 | 169,177(0.02%)#485 |
| 63. | Florham Park Borough | 35 | 28,871(0.12%)#63 | 169,177(0.02%)#486 |
| 64. | Green Knoll | 35 | 28,871(0.12%)#64 | 169,177(0.02%)#490 |
| 65. | Hopatcong Borough | 33 | 28,871(0.11%)#65 | 169,177(0.02%)#509 |
| 66. | Hammonton | 32 | 28,871(0.11%)#66 | 169,177(0.02%)#520 |
| 67. | Ringwood Borough | 32 | 28,871(0.11%)#67 | 169,177(0.02%)#521 |
| 68. | Chatham Borough | 32 | 28,871(0.11%)#68 | 169,177(0.02%)#522 |
| 69. | Menlo Park Terrace | 31 | 28,871(0.11%)#69 | 169,177(0.02%)#537 |
| 70. | Gillette | 31 | 28,871(0.11%)#70 | 169,177(0.02%)#538 |
| 71. | Holiday Heights | 31 | 28,871(0.11%)#71 | 169,177(0.02%)#539 |
| 72. | Trenton | 29 | 28,871(0.10%)#72 | 169,177(0.02%)#554 |
| 73. | West New York | 29 | 28,871(0.10%)#73 | 169,177(0.02%)#557 |
| 74. | Rutherford Borough | 29 | 28,871(0.10%)#74 | 169,177(0.02%)#559 |
| 75. | Blackwells Mills | 29 | 28,871(0.10%)#75 | 169,177(0.02%)#562 |
| 76. | Hightstown Borough | 29 | 28,871(0.10%)#76 | 169,177(0.02%)#564 |
| 77. | Brielle Borough | 29 | 28,871(0.10%)#77 | 169,177(0.02%)#565 |
| 78. | Port Reading | 29 | 28,871(0.10%)#78 | 169,177(0.02%)#567 |
| 79. | Paterson | 27 | 28,871(0.09%)#79 | 169,177(0.02%)#592 |
| 80. | Watchung Borough | 27 | 28,871(0.09%)#80 | 169,177(0.02%)#604 |
| 81. | Mays Landing | 27 | 28,871(0.09%)#81 | 169,177(0.02%)#605 |
| 82. | Belle Mead | 27 | 28,871(0.09%)#82 | 169,177(0.02%)#606 |
| 83. | Belmar Borough | 26 | 28,871(0.09%)#83 | 169,177(0.02%)#624 |
| 84. | Landing | 26 | 28,871(0.09%)#84 | 169,177(0.02%)#625 |
| 85. | Dumont Borough | 25 | 28,871(0.09%)#85 | 169,177(0.01%)#641 |
| 86. | Bellmawr Borough | 25 | 28,871(0.09%)#86 | 169,177(0.01%)#644 |
| 87. | Spotswood Borough | 25 | 28,871(0.09%)#87 | 169,177(0.01%)#645 |
| 88. | Barrington Borough | 25 | 28,871(0.09%)#88 | 169,177(0.01%)#646 |
| 89. | Keasbey | 24 | 28,871(0.08%)#89 | 169,177(0.01%)#668 |
| 90. | North Beach Haven | 24 | 28,871(0.08%)#90 | 169,177(0.01%)#669 |
| 91. | Erma | 24 | 28,871(0.08%)#91 | 169,177(0.01%)#670 |
| 92. | Garwood Borough | 23 | 28,871(0.08%)#92 | 169,177(0.01%)#683 |
| 93. | Hopelawn | 23 | 28,871(0.08%)#93 | 169,177(0.01%)#684 |
| 94. | Iselin | 22 | 28,871(0.08%)#94 | 169,177(0.01%)#694 |
| 95. | Manville Borough | 22 | 28,871(0.08%)#95 | 169,177(0.01%)#696 |
| 96. | Vauxhall | 22 | 28,871(0.08%)#96 | 169,177(0.01%)#701 |
| 97. | Kingston | 22 | 28,871(0.08%)#97 | 169,177(0.01%)#704 |
| 98. | East Rutherford Borough | 21 | 28,871(0.07%)#98 | 169,177(0.01%)#717 |
| 99. | Belford | 21 | 28,871(0.07%)#99 | 169,177(0.01%)#722 |
| 100. | Sicklerville | 20 | 28,871(0.07%)#100 | 169,177(0.01%)#730 |
Common Questions
What are the Top 10 Cities with the Most Immigrants from Portugal in New Jersey?
Top 10 Cities with the Most Immigrants from Portugal in New Jersey are:
#1
6,281
#2
2,973
#3
2,126
#4
1,266
#5
483
#6
409
#7
379
#8
242
#9
172
#10
170
What city has the Most Immigrants from Portugal in New Jersey?
Newark has the Most Immigrants from Portugal in New Jersey with 6,281.
What is the Total Immigrants from Portugal in the State of New Jersey?
Total Immigrants from Portugal in New Jersey is 28,871.
What is the Total Immigrants from Portugal in the United States?
Total Immigrants from Portugal in the United States is 169,177.