Cities with the Highest Percentage of Immigrants from Indonesia in New Jersey
RELATED REPORTS & OPTIONS
Indonesia
New Jersey
Compare Cities
Map of Cities with the Highest Percentage of Immigrants from Indonesia in New Jersey
0.00%
1.50%
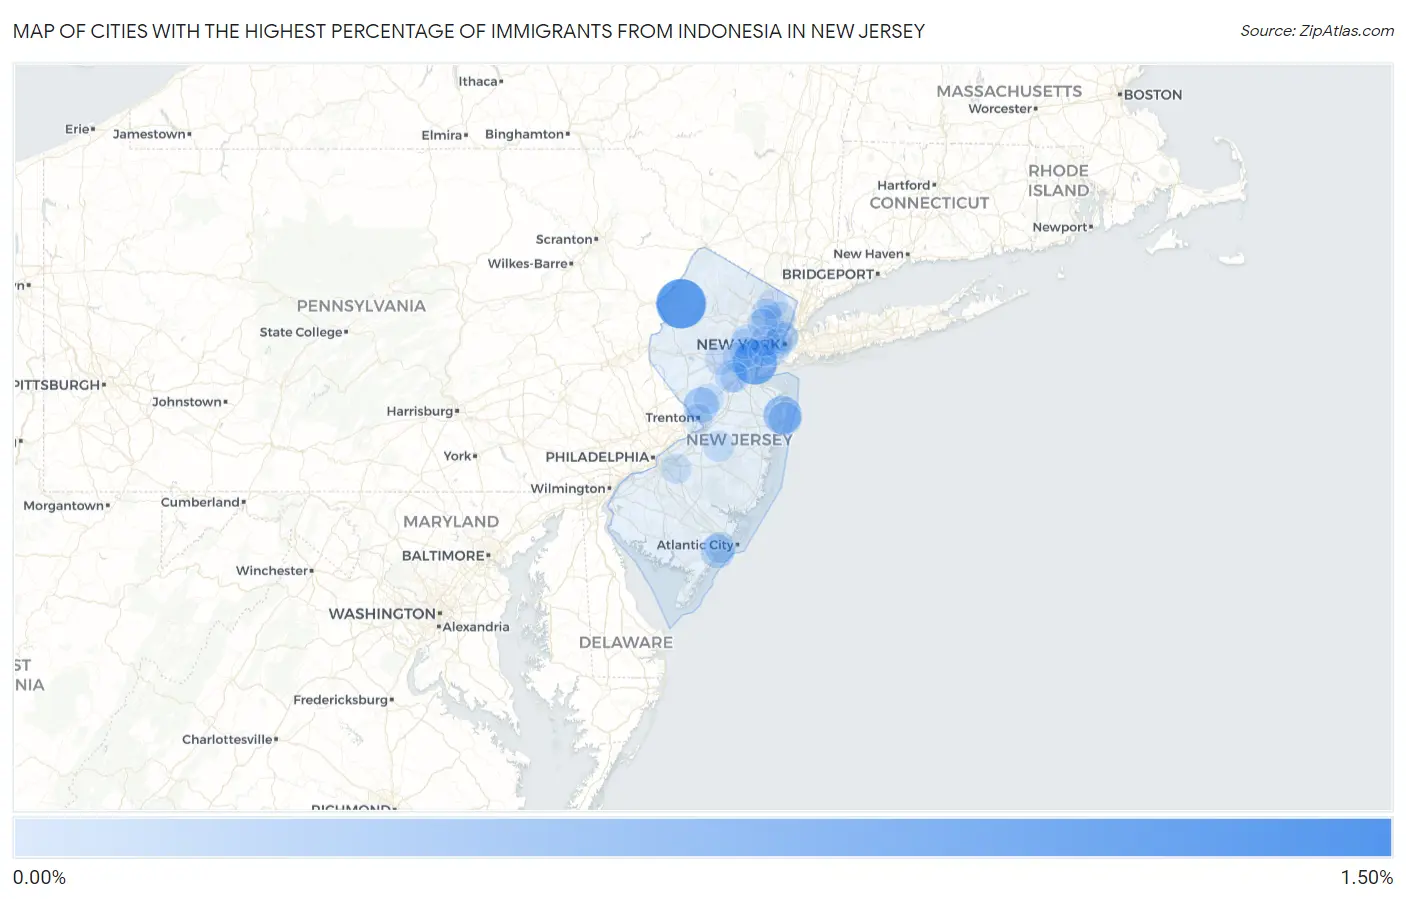
Cities with the Highest Percentage of Immigrants from Indonesia in New Jersey
| City | Indonesia | vs State | vs National | |
| 1. | Menlo Park Terrace | 1.41% | 0.022%(+1.39)#-1 | 0.030%(+1.38)#0 |
| 2. | Marksboro | 1.21% | 0.022%(+1.19)#0 | 0.030%(+1.18)#1 |
| 3. | Avenel | 0.89% | 0.022%(+0.867)#1 | 0.030%(+0.859)#2 |
| 4. | Alpha Borough | 0.63% | 0.022%(+0.608)#2 | 0.030%(+0.600)#3 |
| 5. | Fanwood Borough | 0.53% | 0.022%(+0.509)#3 | 0.030%(+0.501)#4 |
| 6. | Wanamassa | 0.51% | 0.022%(+0.485)#4 | 0.030%(+0.476)#5 |
| 7. | The Hills | 0.43% | 0.022%(+0.408)#5 | 0.030%(+0.400)#6 |
| 8. | Spotswood Borough | 0.41% | 0.022%(+0.384)#6 | 0.030%(+0.376)#7 |
| 9. | River Edge Borough | 0.36% | 0.022%(+0.336)#7 | 0.030%(+0.328)#8 |
| 10. | Lawrenceville | 0.32% | 0.022%(+0.298)#8 | 0.030%(+0.289)#9 |
| 11. | Closter Borough | 0.30% | 0.022%(+0.282)#9 | 0.030%(+0.274)#10 |
| 12. | Somers Point | 0.23% | 0.022%(+0.207)#10 | 0.030%(+0.199)#11 |
| 13. | Leonia Borough | 0.19% | 0.022%(+0.172)#11 | 0.030%(+0.164)#12 |
| 14. | Ocean Grove | 0.19% | 0.022%(+0.170)#12 | 0.030%(+0.162)#13 |
| 15. | Watsessing | 0.17% | 0.022%(+0.147)#13 | 0.030%(+0.138)#14 |
| 16. | Demarest Borough | 0.16% | 0.022%(+0.141)#14 | 0.030%(+0.132)#15 |
| 17. | Towaco | 0.16% | 0.022%(+0.140)#15 | 0.030%(+0.132)#16 |
| 18. | East Franklin | 0.15% | 0.022%(+0.129)#16 | 0.030%(+0.120)#17 |
| 19. | Lake Hiawatha | 0.15% | 0.022%(+0.127)#17 | 0.030%(+0.119)#18 |
| 20. | Clifton | 0.15% | 0.022%(+0.126)#22 | 0.030%(+0.117)#1,399 |
| 21. | Hasbrouck Heights Borough | 0.14% | 0.022%(+0.119)#23 | 0.030%(+0.111)#1,400 |
| 22. | Alpine Borough | 0.14% | 0.022%(+0.116)#24 | 0.030%(+0.108)#1,401 |
| 23. | Union | 0.13% | 0.022%(+0.113)#25 | 0.030%(+0.104)#1,402 |
| 24. | Tenafly Borough | 0.13% | 0.022%(+0.109)#26 | 0.030%(+0.101)#1,403 |
| 25. | Fort Lee Borough | 0.13% | 0.022%(+0.106)#27 | 0.030%(+0.098)#1,404 |
| 26. | North Plainfield Borough | 0.13% | 0.022%(+0.106)#28 | 0.030%(+0.098)#1,405 |
| 27. | Bound Brook Borough | 0.13% | 0.022%(+0.104)#29 | 0.030%(+0.096)#1,406 |
| 28. | Sicklerville | 0.11% | 0.022%(+0.087)#30 | 0.030%(+0.079)#1,407 |
| 29. | Woodland Park Borough | 0.090% | 0.022%(+0.069)#31 | 0.030%(+0.060)#1,408 |
| 30. | South River Borough | 0.087% | 0.022%(+0.065)#32 | 0.030%(+0.057)#1,409 |
| 31. | Linwood | 0.086% | 0.022%(+0.065)#33 | 0.030%(+0.056)#1,410 |
| 32. | Bridgewater Center | 0.082% | 0.022%(+0.060)#34 | 0.030%(+0.052)#1,411 |
| 33. | Bayonne | 0.075% | 0.022%(+0.054)#35 | 0.030%(+0.045)#1,412 |
| 34. | Glen Rock Borough | 0.074% | 0.022%(+0.053)#36 | 0.030%(+0.044)#1,413 |
| 35. | Hoboken | 0.073% | 0.022%(+0.052)#37 | 0.030%(+0.043)#1,414 |
| 36. | Hackensack | 0.070% | 0.022%(+0.048)#38 | 0.030%(+0.040)#1,415 |
| 37. | Short Hills | 0.069% | 0.022%(+0.048)#39 | 0.030%(+0.039)#1,416 |
| 38. | Mcguire Afb | 0.061% | 0.022%(+0.040)#40 | 0.030%(+0.031)#1,417 |
| 39. | Westfield | 0.052% | 0.022%(+0.030)#41 | 0.030%(+0.022)#1,418 |
| 40. | Union City | 0.049% | 0.022%(+0.027)#42 | 0.030%(+0.019)#1,419 |
| 41. | Parsippany | 0.046% | 0.022%(+0.024)#43 | 0.030%(+0.016)#1,420 |
| 42. | Summit | 0.031% | 0.022%(+0.009)#44 | 0.030%(+0.001)#1,421 |
| 43. | Martinsville | 0.024% | 0.022%(+0.003)#45 | 0.030%(-0.006)#1,422 |
| 44. | Ridgewood | 0.023% | 0.022%(+0.001)#46 | 0.030%(-0.007)#1,423 |
| 45. | Paterson | 0.022% | 0.022%(+0.001)#47 | 0.030%(-0.008)#1,424 |
| 46. | Jersey City | 0.019% | 0.022%(-0.003)#48 | 0.030%(-0.011)#1,425 |
| 47. | Princeton | 0.013% | 0.022%(-0.009)#49 | 0.030%(-0.017)#1,426 |
| 48. | Springdale | 0.013% | 0.022%(-0.009)#50 | 0.030%(-0.017)#1,427 |
| 49. | Raritan Borough | 0.012% | 0.022%(-0.010)#51 | 0.030%(-0.018)#1,428 |
| 50. | Trenton | 0.011% | 0.022%(-0.011)#52 | 0.030%(-0.019)#1,429 |
| 51. | Upper Montclair | 0.0080% | 0.022%(-0.014)#53 | 0.030%(-0.022)#1,430 |
| 52. | Haddonfield Borough | 0.0080% | 0.022%(-0.014)#54 | 0.030%(-0.022)#1,431 |
| 53. | Somerville Borough | 0.0080% | 0.022%(-0.014)#55 | 0.030%(-0.022)#1,432 |
| 54. | Newark | 0.0078% | 0.022%(-0.014)#56 | 0.030%(-0.022)#1,433 |
| 55. | Plainfield | 0.0037% | 0.022%(-0.018)#57 | 0.030%(-0.026)#1,434 |
| 56. | Elizabeth | 0.0029% | 0.022%(-0.019)#58 | 0.030%(-0.027)#1,435 |
| 57. | New Brunswick | 0.0018% | 0.022%(-0.020)#59 | 0.030%(-0.028)#1,436 |
Common Questions
What are the Top 10 Cities with the Highest Percentage of Immigrants from Indonesia in New Jersey?
Top 10 Cities with the Highest Percentage of Immigrants from Indonesia in New Jersey are:
#1
1.21%
#2
0.89%
#3
0.51%
#4
0.32%
#5
0.23%
#6
0.19%
#7
0.15%
#8
0.15%
#9
0.086%
#10
0.075%
What city has the Highest Percentage of Immigrants from Indonesia in New Jersey?
Marksboro has the Highest Percentage of Immigrants from Indonesia in New Jersey with 1.21%.
What is the Percentage of Immigrants from Indonesia in the State of New Jersey?
Percentage of Immigrants from Indonesia in New Jersey is 0.022%.
What is the Percentage of Immigrants from Indonesia in the United States?
Percentage of Immigrants from Indonesia in the United States is 0.030%.