Cities with the Fewest Births per 1,000 Women Over the Age of 35 in New Jersey
RELATED REPORTS & OPTIONS
Lowest Birth Rate | Women 35+
New Jersey
Compare Cities
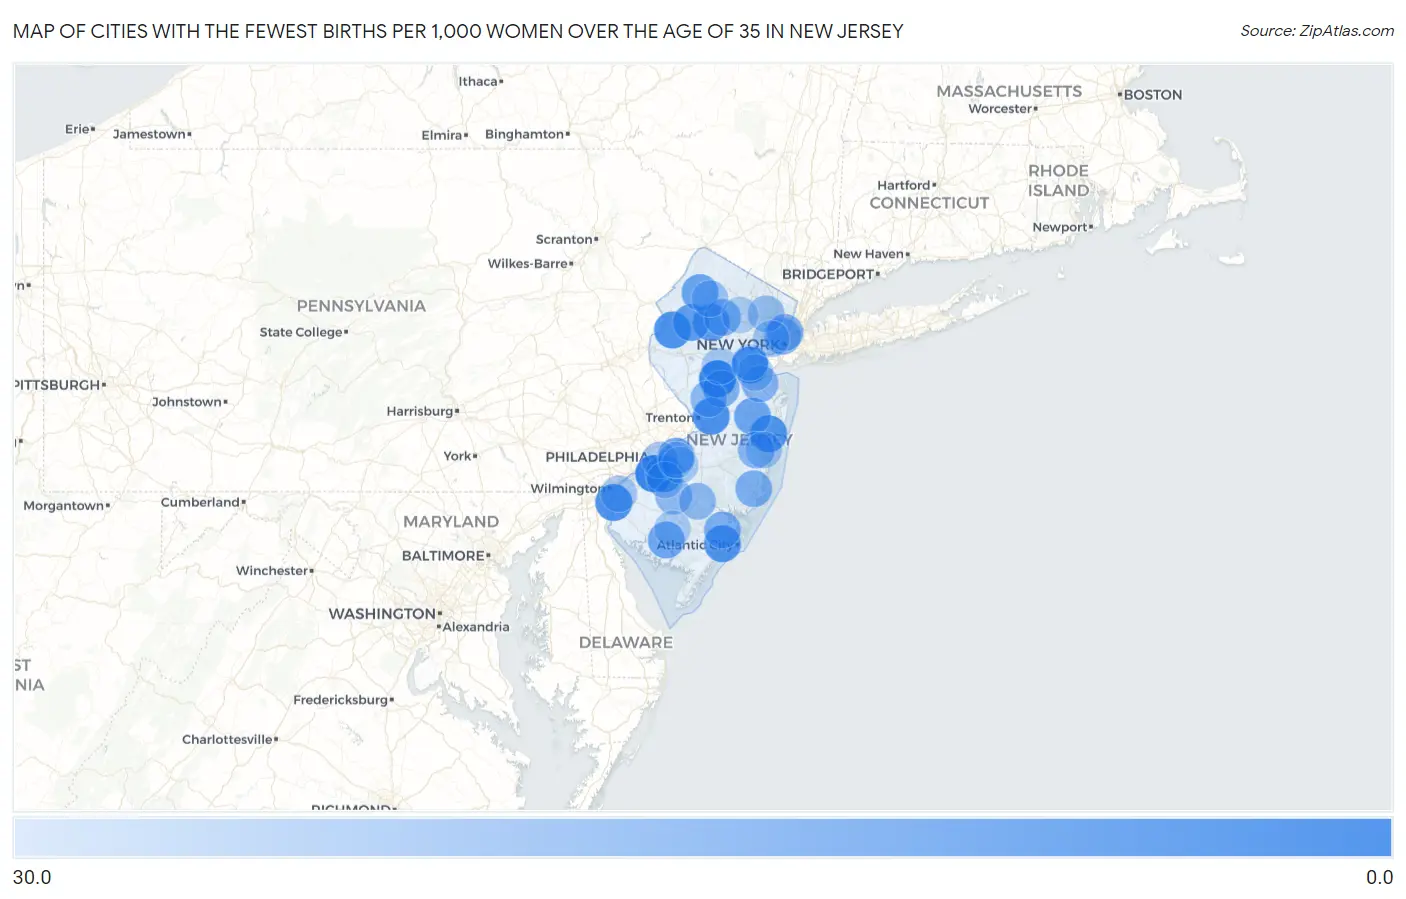
Map of Cities with the Fewest Births per 1,000 Women Over the Age of 35 in New Jersey
30.0
0.0
Cities with the Fewest Births per 1,000 Women Over the Age of 35 in New Jersey
| City | Births / 1,000 Women | vs State | vs National | |
| 1. | Blackwells Mills | 3.0 | 41.0(-38.0)#1 | 32.0(-29.0)#59 |
| 2. | Woodbury | 3.0 | 41.0(-38.0)#2 | 32.0(-29.0)#60 |
| 3. | Freehold Borough | 4.0 | 41.0(-37.0)#3 | 32.0(-28.0)#101 |
| 4. | Oaklyn Borough | 5.0 | 41.0(-36.0)#4 | 32.0(-27.0)#165 |
| 5. | Manville Borough | 6.0 | 41.0(-35.0)#5 | 32.0(-26.0)#216 |
| 6. | Pennsville | 7.0 | 41.0(-34.0)#6 | 32.0(-25.0)#278 |
| 7. | Hamilton Square | 7.0 | 41.0(-34.0)#7 | 32.0(-25.0)#280 |
| 8. | Ringwood Borough | 7.0 | 41.0(-34.0)#8 | 32.0(-25.0)#285 |
| 9. | Oxford | 7.0 | 41.0(-34.0)#9 | 32.0(-25.0)#330 |
| 10. | Iselin | 8.0 | 41.0(-33.0)#10 | 32.0(-24.0)#359 |
| 11. | Ramtown | 8.0 | 41.0(-33.0)#11 | 32.0(-24.0)#400 |
| 12. | Northfield | 9.0 | 41.0(-32.0)#12 | 32.0(-23.0)#485 |
| 13. | Old Tappan Borough | 9.0 | 41.0(-32.0)#13 | 32.0(-23.0)#495 |
| 14. | Vauxhall | 9.0 | 41.0(-32.0)#14 | 32.0(-23.0)#500 |
| 15. | Haworth Borough | 9.0 | 41.0(-32.0)#15 | 32.0(-23.0)#507 |
| 16. | North Plainfield Borough | 10.0 | 41.0(-31.0)#16 | 32.0(-22.0)#544 |
| 17. | Succasunna | 10.0 | 41.0(-31.0)#17 | 32.0(-22.0)#595 |
| 18. | Keansburg Borough | 10.0 | 41.0(-31.0)#18 | 32.0(-22.0)#596 |
| 19. | Raritan Borough | 10.0 | 41.0(-31.0)#19 | 32.0(-22.0)#606 |
| 20. | Glendora | 10.0 | 41.0(-31.0)#20 | 32.0(-22.0)#620 |
| 21. | Gibbsboro Borough | 10.0 | 41.0(-31.0)#21 | 32.0(-22.0)#636 |
| 22. | Ridgefield Borough | 11.0 | 41.0(-30.0)#22 | 32.0(-21.0)#703 |
| 23. | Hackettstown | 11.0 | 41.0(-30.0)#23 | 32.0(-21.0)#715 |
| 24. | Cresskill Borough | 11.0 | 41.0(-30.0)#24 | 32.0(-21.0)#722 |
| 25. | Park Ridge Borough | 11.0 | 41.0(-30.0)#25 | 32.0(-21.0)#723 |
| 26. | Totowa Borough | 12.0 | 41.0(-29.0)#26 | 32.0(-20.0)#852 |
| 27. | Victory Gardens Borough | 12.0 | 41.0(-29.0)#27 | 32.0(-20.0)#898 |
| 28. | West Freehold | 13.0 | 41.0(-28.0)#28 | 32.0(-19.0)#964 |
| 29. | Newton | 13.0 | 41.0(-28.0)#29 | 32.0(-19.0)#992 |
| 30. | Prospect Park Borough | 13.0 | 41.0(-28.0)#30 | 32.0(-19.0)#999 |
| 31. | Mountain Lakes Borough | 13.0 | 41.0(-28.0)#31 | 32.0(-19.0)#1,006 |
| 32. | Millville | 14.0 | 41.0(-27.0)#32 | 32.0(-18.0)#1,066 |
| 33. | Hopatcong Borough | 14.0 | 41.0(-27.0)#33 | 32.0(-18.0)#1,092 |
| 34. | Moorestown Lenola | 14.0 | 41.0(-27.0)#34 | 32.0(-18.0)#1,093 |
| 35. | Whippany | 14.0 | 41.0(-27.0)#35 | 32.0(-18.0)#1,111 |
| 36. | Allendale Borough | 14.0 | 41.0(-27.0)#36 | 32.0(-18.0)#1,125 |
| 37. | Pennington Borough | 14.0 | 41.0(-27.0)#37 | 32.0(-18.0)#1,149 |
| 38. | Bay Head Borough | 14.0 | 41.0(-27.0)#38 | 32.0(-18.0)#1,172 |
| 39. | Califon Borough | 14.0 | 41.0(-27.0)#39 | 32.0(-18.0)#1,174 |
| 40. | Rumson Borough | 15.0 | 41.0(-26.0)#40 | 32.0(-17.0)#1,246 |
| 41. | Manasquan Borough | 15.0 | 41.0(-26.0)#41 | 32.0(-17.0)#1,255 |
| 42. | Hawthorne Borough | 16.0 | 41.0(-25.0)#42 | 32.0(-16.0)#1,343 |
| 43. | Ocean Acres | 16.0 | 41.0(-25.0)#43 | 32.0(-16.0)#1,346 |
| 44. | Pompton Lakes Borough | 16.0 | 41.0(-25.0)#44 | 32.0(-16.0)#1,364 |
| 45. | Pomona | 16.0 | 41.0(-25.0)#45 | 32.0(-16.0)#1,375 |
| 46. | Palmyra Borough | 16.0 | 41.0(-25.0)#46 | 32.0(-16.0)#1,388 |
| 47. | Emerson Borough | 16.0 | 41.0(-25.0)#47 | 32.0(-16.0)#1,390 |
| 48. | Union City | 17.0 | 41.0(-24.0)#48 | 32.0(-15.0)#1,467 |
| 49. | West New York | 17.0 | 41.0(-24.0)#49 | 32.0(-15.0)#1,474 |
| 50. | Dover | 17.0 | 41.0(-24.0)#50 | 32.0(-15.0)#1,509 |
| 51. | Roselle Park Borough | 17.0 | 41.0(-24.0)#51 | 32.0(-15.0)#1,516 |
| 52. | Kendall Park | 17.0 | 41.0(-24.0)#52 | 32.0(-15.0)#1,526 |
| 53. | Mckee | 17.0 | 41.0(-24.0)#53 | 32.0(-15.0)#1,535 |
| 54. | Westwood Borough | 18.0 | 41.0(-23.0)#54 | 32.0(-14.0)#1,696 |
| 55. | Little Ferry Borough | 18.0 | 41.0(-23.0)#55 | 32.0(-14.0)#1,697 |
| 56. | Pine Lake Park | 18.0 | 41.0(-23.0)#56 | 32.0(-14.0)#1,703 |
| 57. | Chatham Borough | 18.0 | 41.0(-23.0)#57 | 32.0(-14.0)#1,707 |
| 58. | Basking Ridge | 18.0 | 41.0(-23.0)#58 | 32.0(-14.0)#1,718 |
| 59. | Cliffwood Beach | 18.0 | 41.0(-23.0)#59 | 32.0(-14.0)#1,748 |
| 60. | Princeton | 19.0 | 41.0(-22.0)#60 | 32.0(-13.0)#1,834 |
| 61. | East Rutherford Borough | 19.0 | 41.0(-22.0)#61 | 32.0(-13.0)#1,877 |
| 62. | Matawan Borough | 19.0 | 41.0(-22.0)#62 | 32.0(-13.0)#1,880 |
| 63. | Moonachie Borough | 19.0 | 41.0(-22.0)#63 | 32.0(-13.0)#1,915 |
| 64. | Laurel Springs Borough | 19.0 | 41.0(-22.0)#64 | 32.0(-13.0)#1,938 |
| 65. | Brooklawn Borough | 19.0 | 41.0(-22.0)#65 | 32.0(-13.0)#1,941 |
| 66. | Williamstown | 20.0 | 41.0(-21.0)#66 | 32.0(-12.0)#2,026 |
| 67. | Hammonton | 20.0 | 41.0(-21.0)#67 | 32.0(-12.0)#2,027 |
| 68. | River Edge Borough | 20.0 | 41.0(-21.0)#68 | 32.0(-12.0)#2,036 |
| 69. | Dunellen Borough | 20.0 | 41.0(-21.0)#69 | 32.0(-12.0)#2,058 |
| 70. | Newfield Borough | 20.0 | 41.0(-21.0)#70 | 32.0(-12.0)#2,109 |
| 71. | Paterson | 21.0 | 41.0(-20.0)#71 | 32.0(-11.0)#2,137 |
| 72. | Somerville Borough | 21.0 | 41.0(-20.0)#72 | 32.0(-11.0)#2,207 |
| 73. | Sussex Borough | 21.0 | 41.0(-20.0)#73 | 32.0(-11.0)#2,273 |
| 74. | Camden | 22.0 | 41.0(-19.0)#74 | 32.0(-10.00)#2,321 |
| 75. | Tenafly Borough | 22.0 | 41.0(-19.0)#75 | 32.0(-10.00)#2,369 |
| 76. | Lake Mohawk | 22.0 | 41.0(-19.0)#76 | 32.0(-10.00)#2,390 |
| 77. | Oradell Borough | 22.0 | 41.0(-19.0)#77 | 32.0(-10.00)#2,395 |
| 78. | Swedesboro Borough | 22.0 | 41.0(-19.0)#78 | 32.0(-10.00)#2,430 |
| 79. | Kearny | 23.0 | 41.0(-18.0)#79 | 32.0(-9.00)#2,509 |
| 80. | Carteret Borough | 23.0 | 41.0(-18.0)#80 | 32.0(-9.00)#2,526 |
| 81. | Westmont | 23.0 | 41.0(-18.0)#81 | 32.0(-9.00)#2,551 |
| 82. | Beachwood Borough | 23.0 | 41.0(-18.0)#82 | 32.0(-9.00)#2,562 |
| 83. | Carneys Point | 23.0 | 41.0(-18.0)#83 | 32.0(-9.00)#2,578 |
| 84. | Deal Borough | 23.0 | 41.0(-18.0)#84 | 32.0(-9.00)#2,663 |
| 85. | Toms River | 24.0 | 41.0(-17.0)#85 | 32.0(-8.00)#2,686 |
| 86. | Perth Amboy | 24.0 | 41.0(-17.0)#86 | 32.0(-8.00)#2,693 |
| 87. | Roselle Borough | 24.0 | 41.0(-17.0)#87 | 32.0(-8.00)#2,721 |
| 88. | Point Pleasant Borough | 24.0 | 41.0(-17.0)#88 | 32.0(-8.00)#2,732 |
| 89. | Marlton | 24.0 | 41.0(-17.0)#89 | 32.0(-8.00)#2,764 |
| 90. | Finderne | 24.0 | 41.0(-17.0)#90 | 32.0(-8.00)#2,782 |
| 91. | Vineland | 25.0 | 41.0(-16.0)#91 | 32.0(-7.00)#2,876 |
| 92. | Blackwood | 25.0 | 41.0(-16.0)#92 | 32.0(-7.00)#2,964 |
| 93. | Colonia | 26.0 | 41.0(-15.0)#93 | 32.0(-6.00)#3,076 |
| 94. | Boonton | 26.0 | 41.0(-15.0)#94 | 32.0(-6.00)#3,105 |
| 95. | Ramblewood | 26.0 | 41.0(-15.0)#95 | 32.0(-6.00)#3,114 |
| 96. | Neptune City Borough | 26.0 | 41.0(-15.0)#96 | 32.0(-6.00)#3,124 |
| 97. | Wenonah Borough | 26.0 | 41.0(-15.0)#97 | 32.0(-6.00)#3,156 |
| 98. | Lindenwold Borough | 27.0 | 41.0(-14.0)#98 | 32.0(-5.00)#3,250 |
| 99. | Madison Borough | 27.0 | 41.0(-14.0)#99 | 32.0(-5.00)#3,261 |
| 100. | Spotswood Borough | 27.0 | 41.0(-14.0)#100 | 32.0(-5.00)#3,293 |
Common Questions
What are the Top 10 Cities with the Fewest Births per 1,000 Women Over the Age of 35 in New Jersey?
Top 10 Cities with the Fewest Births per 1,000 Women Over the Age of 35 in New Jersey are:
#1
3.0
#2
3.0
#3
7.0
#4
7.0
#5
7.0
#6
8.0
#7
8.0
#8
9.0
#9
10.0
#10
10.0
What city has the Fewest Births per 1,000 Women Over the Age of 35 in New Jersey?
Blackwells Mills has the Fewest Births per 1,000 Women Over the Age of 35 in New Jersey with 3.0.
What is the Number of Births per 1,000 Women Over the Age of 35 in the State of New Jersey?
Number of Births per 1,000 Women Over the Age of 35 in New Jersey is 41.0.
What is the Number of Births per 1,000 Women Over the Age of 35 in the United States?
Number of Births per 1,000 Women Over the Age of 35 in the United States is 32.0.