Cities with the Highest Percentage of Guamanian / Chamorro Population in New Jersey
RELATED REPORTS & OPTIONS
Guamanian / Chamorro
New Jersey
Compare Cities
Map of Cities with the Highest Percentage of Guamanian / Chamorro Population in New Jersey
0.00%
1.50%
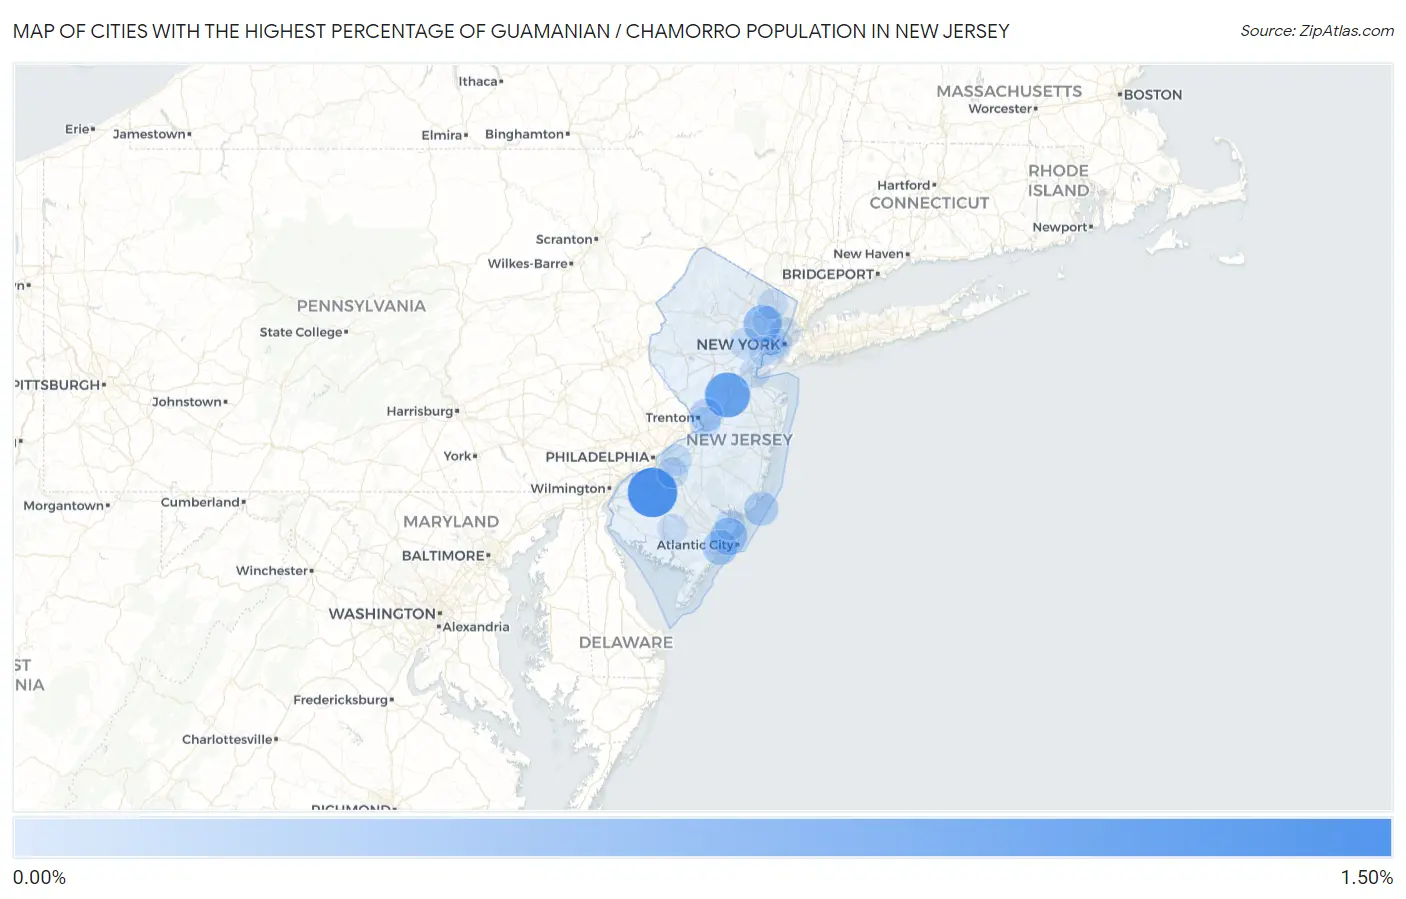
Cities with the Highest Percentage of Guamanian / Chamorro Population in New Jersey
| City | Guamanian / Chamorro | vs State | vs National | |
| 1. | Richwood | 1.31% | 0.014%(+1.30)#1 | 0.047%(+1.27)#137 |
| 2. | Dayton | 1.00% | 0.014%(+0.991)#2 | 0.047%(+0.958)#187 |
| 3. | Upper Montclair | 0.51% | 0.014%(+0.500)#3 | 0.047%(+0.468)#376 |
| 4. | Little Silver Borough | 0.48% | 0.014%(+0.461)#4 | 0.047%(+0.429)#403 |
| 5. | Absecon | 0.45% | 0.014%(+0.437)#5 | 0.047%(+0.405)#421 |
| 6. | Hopewell Borough | 0.38% | 0.014%(+0.369)#6 | 0.047%(+0.337)#475 |
| 7. | Linwood | 0.32% | 0.014%(+0.302)#7 | 0.047%(+0.270)#544 |
| 8. | Wenonah Borough | 0.32% | 0.014%(+0.302)#8 | 0.047%(+0.270)#546 |
| 9. | North Beach Haven | 0.27% | 0.014%(+0.253)#9 | 0.047%(+0.220)#629 |
| 10. | Mercerville | 0.21% | 0.014%(+0.195)#10 | 0.047%(+0.162)#737 |
| 11. | Rumson Borough | 0.18% | 0.014%(+0.164)#11 | 0.047%(+0.132)#823 |
| 12. | Roselle Borough | 0.15% | 0.014%(+0.133)#12 | 0.047%(+0.100)#906 |
| 13. | South River Borough | 0.12% | 0.014%(+0.104)#13 | 0.047%(+0.072)#1,000 |
| 14. | Wallington Borough | 0.10% | 0.014%(+0.087)#14 | 0.047%(+0.055)#1,073 |
| 15. | Ramblewood | 0.079% | 0.014%(+0.065)#15 | 0.047%(+0.033)#1,177 |
| 16. | Summit | 0.075% | 0.014%(+0.061)#16 | 0.047%(+0.029)#1,198 |
| 17. | White Horse | 0.072% | 0.014%(+0.058)#17 | 0.047%(+0.026)#1,212 |
| 18. | Smithville | 0.055% | 0.014%(+0.041)#18 | 0.047%(+0.008)#1,319 |
| 19. | Echelon | 0.052% | 0.014%(+0.038)#19 | 0.047%(+0.005)#1,338 |
| 20. | New Providence Borough | 0.051% | 0.014%(+0.037)#20 | 0.047%(+0.005)#1,341 |
| 21. | South Plainfield Borough | 0.049% | 0.014%(+0.035)#21 | 0.047%(+0.003)#1,356 |
| 22. | Edgewater Borough | 0.049% | 0.014%(+0.035)#22 | 0.047%(+0.002)#1,359 |
| 23. | Ridgewood | 0.046% | 0.014%(+0.032)#23 | 0.047%(-0.000)#1,384 |
| 24. | West New York | 0.044% | 0.014%(+0.030)#24 | 0.047%(-0.003)#1,408 |
| 25. | Lodi Borough | 0.039% | 0.014%(+0.024)#25 | 0.047%(-0.008)#1,454 |
| 26. | Perth Amboy | 0.038% | 0.014%(+0.024)#26 | 0.047%(-0.009)#1,460 |
| 27. | Fort Lee Borough | 0.025% | 0.014%(+0.011)#27 | 0.047%(-0.021)#1,579 |
| 28. | Clifton | 0.023% | 0.014%(+0.009)#28 | 0.047%(-0.023)#1,592 |
| 29. | Vineland | 0.023% | 0.014%(+0.009)#29 | 0.047%(-0.024)#1,600 |
| 30. | Bayonne | 0.023% | 0.014%(+0.009)#30 | 0.047%(-0.024)#1,602 |
| 31. | Jersey City | 0.013% | 0.014%(-0.001)#31 | 0.047%(-0.033)#1,699 |
| 32. | Elizabeth | 0.0074% | 0.014%(-0.007)#32 | 0.047%(-0.039)#1,782 |
1
2Common Questions
What are the Top 10 Cities with the Highest Percentage of Guamanian / Chamorro Population in New Jersey?
Top 10 Cities with the Highest Percentage of Guamanian / Chamorro Population in New Jersey are:
#1
1.31%
#2
1.00%
#3
0.51%
#4
0.45%
#5
0.32%
#6
0.27%
#7
0.21%
#8
0.079%
#9
0.075%
#10
0.072%
What city has the Highest Percentage of Guamanian / Chamorro Population in New Jersey?
Richwood has the Highest Percentage of Guamanian / Chamorro Population in New Jersey with 1.31%.
What is the Percentage of Guamanian / Chamorro Population in the State of New Jersey?
Percentage of Guamanian / Chamorro Population in New Jersey is 0.014%.
What is the Percentage of Guamanian / Chamorro Population in the United States?
Percentage of Guamanian / Chamorro Population in the United States is 0.047%.