Cities with the Highest Percentage of Portuguese Population in New Jersey
RELATED REPORTS & OPTIONS
Portuguese
New Jersey
Compare Cities
Map of Cities with the Highest Percentage of Portuguese Population in New Jersey
0.00%
15.00%
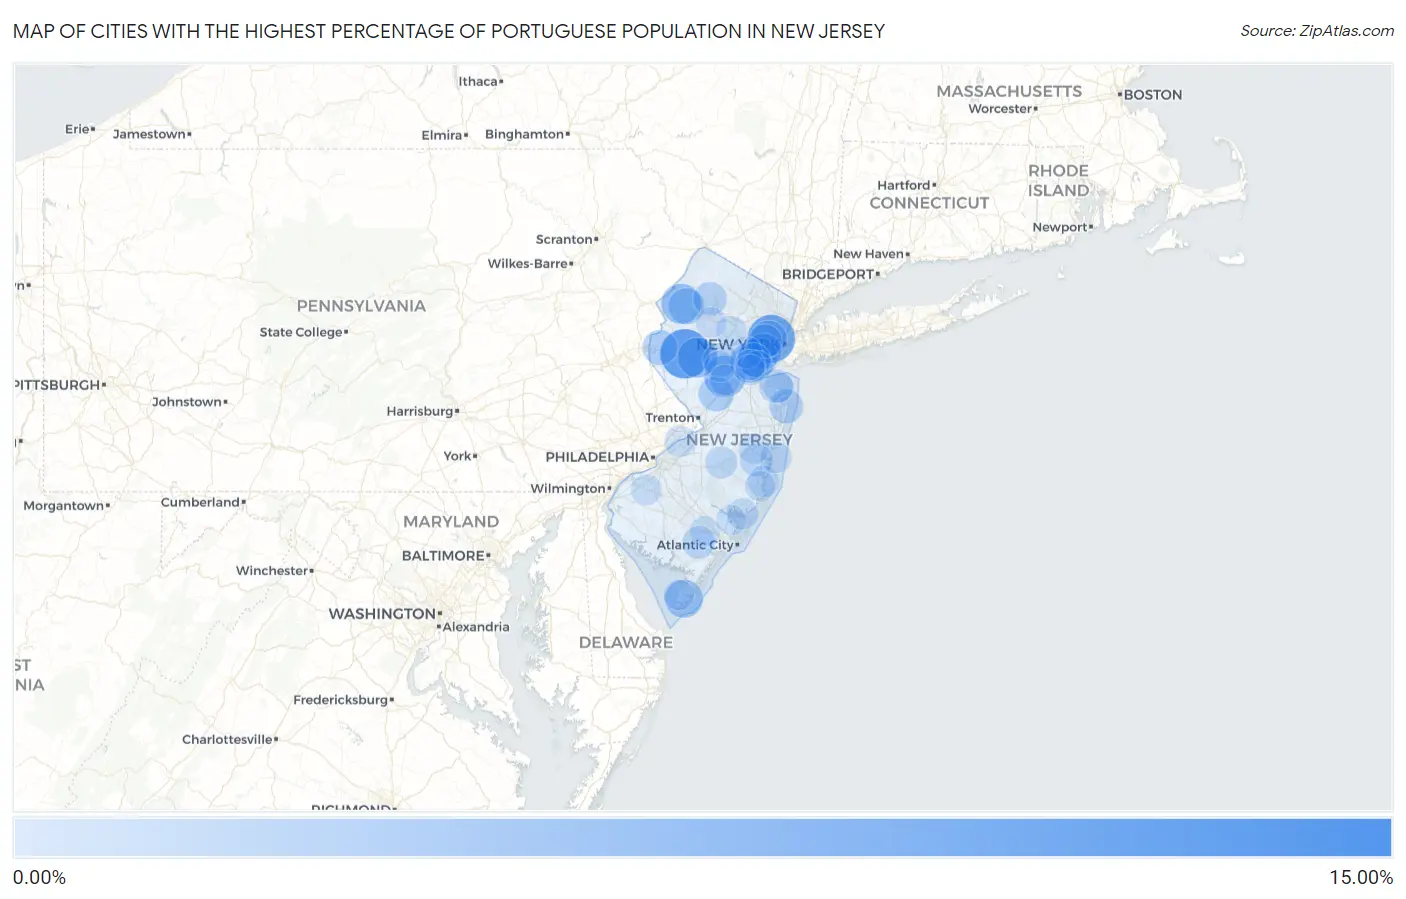
Cities with the Highest Percentage of Portuguese Population in New Jersey
| City | Portuguese | vs State | vs National | |
| 1. | Springfield | 12.11% | 0.83% (+11.3)#1 | 0.41% (+11.7)#77 |
| 2. | South Dennis | 10.33% | 0.83% (+9.50)#2 | 0.41% (+9.92)#102 |
| 3. | Annandale | 9.98% | 0.83% (+9.15)#3 | 0.41% (+9.58)#107 |
| 4. | South River Borough | 9.88% | 0.83% (+9.05)#4 | 0.41% (+9.47)#113 |
| 5. | Kearny | 9.16% | 0.83% (+8.33)#5 | 0.41% (+8.76)#125 |
| 6. | Kenilworth Borough | 8.78% | 0.83% (+7.95)#6 | 0.41% (+8.38)#135 |
| 7. | North Arlington Borough | 6.53% | 0.83% (+5.70)#7 | 0.41% (+6.12)#207 |
| 8. | Middlebush | 6.26% | 0.83% (+5.42)#8 | 0.41% (+5.85)#223 |
| 9. | Fortescue | 5.75% | 0.83% (+4.92)#9 | 0.41% (+5.34)#258 |
| 10. | Mountainside Borough | 5.61% | 0.83% (+4.78)#10 | 0.41% (+5.20)#272 |
| 11. | Colonia | 5.53% | 0.83% (+4.70)#11 | 0.41% (+5.12)#279 |
| 12. | White House Station | 5.52% | 0.83% (+4.69)#12 | 0.41% (+5.11)#280 |
| 13. | Marksboro | 5.45% | 0.83% (+4.62)#13 | 0.41% (+5.05)#282 |
| 14. | Linden | 5.43% | 0.83% (+4.59)#14 | 0.41% (+5.02)#284 |
| 15. | Erma | 4.72% | 0.83% (+3.89)#15 | 0.41% (+4.31)#333 |
| 16. | Johnsonburg | 3.83% | 0.83% (+3.00)#16 | 0.41% (+3.42)#432 |
| 17. | Harrison | 3.81% | 0.83% (+2.98)#17 | 0.41% (+3.40)#435 |
| 18. | Elizabeth | 3.59% | 0.83% (+2.76)#18 | 0.41% (+3.18)#457 |
| 19. | Towaco | 3.49% | 0.83% (+2.66)#19 | 0.41% (+3.09)#467 |
| 20. | Jamesburg Borough | 3.49% | 0.83% (+2.66)#20 | 0.41% (+3.08)#468 |
| 21. | Lodi Borough | 3.43% | 0.83% (+2.60)#21 | 0.41% (+3.02)#477 |
| 22. | Kingston | 3.41% | 0.83% (+2.58)#22 | 0.41% (+3.01)#482 |
| 23. | Watchung Borough | 3.35% | 0.83% (+2.52)#23 | 0.41% (+2.94)#490 |
| 24. | Brookside | 3.30% | 0.83% (+2.47)#24 | 0.41% (+2.89)#506 |
| 25. | Stewartsville | 3.25% | 0.83% (+2.42)#25 | 0.41% (+2.84)#511 |
| 26. | Milford Borough | 3.05% | 0.83% (+2.22)#26 | 0.41% (+2.65)#554 |
| 27. | Long Branch | 2.92% | 0.83% (+2.09)#27 | 0.41% (+2.51)#588 |
| 28. | Eatontown Borough | 2.83% | 0.83% (+1.99)#28 | 0.41% (+2.42)#613 |
| 29. | Martinsville | 2.81% | 0.83% (+1.97)#29 | 0.41% (+2.40)#620 |
| 30. | Newark | 2.76% | 0.83% (+1.93)#30 | 0.41% (+2.35)#631 |
| 31. | Lake Mohawk | 2.74% | 0.83% (+1.91)#31 | 0.41% (+2.33)#638 |
| 32. | Belford | 2.74% | 0.83% (+1.91)#32 | 0.41% (+2.33)#640 |
| 33. | Keasbey | 2.73% | 0.83% (+1.90)#33 | 0.41% (+2.32)#642 |
| 34. | Rahway | 2.70% | 0.83% (+1.87)#34 | 0.41% (+2.30)#648 |
| 35. | East Newark Borough | 2.65% | 0.83% (+1.82)#35 | 0.41% (+2.24)#666 |
| 36. | Haworth Borough | 2.39% | 0.83% (+1.56)#36 | 0.41% (+1.99)#736 |
| 37. | Garwood Borough | 2.33% | 0.83% (+1.50)#37 | 0.41% (+1.93)#758 |
| 38. | Sayreville Borough | 2.27% | 0.83% (+1.44)#38 | 0.41% (+1.86)#783 |
| 39. | Holiday Heights | 2.24% | 0.83% (+1.41)#39 | 0.41% (+1.84)#788 |
| 40. | Roselle Park Borough | 2.21% | 0.83% (+1.38)#40 | 0.41% (+1.80)#802 |
| 41. | Estell Manor | 2.20% | 0.83% (+1.37)#41 | 0.41% (+1.79)#812 |
| 42. | Basking Ridge | 2.10% | 0.83% (+1.27)#42 | 0.41% (+1.69)#863 |
| 43. | Cranford | 2.08% | 0.83% (+1.25)#43 | 0.41% (+1.68)#874 |
| 44. | Chesilhurst Borough | 2.02% | 0.83% (+1.19)#44 | 0.41% (+1.61)#896 |
| 45. | High Bridge Borough | 2.02% | 0.83% (+1.19)#45 | 0.41% (+1.61)#897 |
| 46. | Palermo | 2.00% | 0.83% (+1.17)#46 | 0.41% (+1.59)#908 |
| 47. | Presidential Lakes Estates | 1.95% | 0.83% (+1.12)#47 | 0.41% (+1.54)#926 |
| 48. | Carteret Borough | 1.91% | 0.83% (+1.08)#48 | 0.41% (+1.50)#946 |
| 49. | Silver Lake Cdp Essex County | 1.88% | 0.83% (+1.05)#49 | 0.41% (+1.48)#968 |
| 50. | Landing | 1.87% | 0.83% (+1.04)#50 | 0.41% (+1.47)#974 |
| 51. | Ringwood Borough | 1.85% | 0.83% (+1.02)#51 | 0.41% (+1.44)#991 |
| 52. | Bloomingdale Borough | 1.84% | 0.83% (+1.01)#52 | 0.41% (+1.43)#998 |
| 53. | Mickleton | 1.80% | 0.83% (+0.971)#53 | 0.41% (+1.39)#1,021 |
| 54. | Flanders | 1.80% | 0.83% (+0.970)#54 | 0.41% (+1.39)#1,024 |
| 55. | Westfield | 1.80% | 0.83% (+0.966)#55 | 0.41% (+1.39)#1,026 |
| 56. | Ampere North | 1.76% | 0.83% (+0.931)#56 | 0.41% (+1.35)#1,044 |
| 57. | Mystic Island | 1.74% | 0.83% (+0.911)#57 | 0.41% (+1.33)#1,060 |
| 58. | Beverly | 1.72% | 0.83% (+0.888)#58 | 0.41% (+1.31)#1,077 |
| 59. | Finderne | 1.68% | 0.83% (+0.853)#59 | 0.41% (+1.28)#1,098 |
| 60. | Avon By The Sea Borough | 1.67% | 0.83% (+0.843)#60 | 0.41% (+1.27)#1,104 |
| 61. | Waretown | 1.64% | 0.83% (+0.809)#61 | 0.41% (+1.23)#1,127 |
| 62. | Lebanon Borough | 1.61% | 0.83% (+0.779)#62 | 0.41% (+1.20)#1,152 |
| 63. | Dover Beaches South | 1.56% | 0.83% (+0.730)#63 | 0.41% (+1.15)#1,192 |
| 64. | Mullica Hill | 1.53% | 0.83% (+0.696)#64 | 0.41% (+1.12)#1,218 |
| 65. | Neshanic Station | 1.52% | 0.83% (+0.693)#65 | 0.41% (+1.12)#1,220 |
| 66. | Raritan Borough | 1.52% | 0.83% (+0.687)#66 | 0.41% (+1.11)#1,225 |
| 67. | Ho Ho Kus Borough | 1.51% | 0.83% (+0.681)#67 | 0.41% (+1.10)#1,230 |
| 68. | Florham Park Borough | 1.47% | 0.83% (+0.639)#68 | 0.41% (+1.06)#1,265 |
| 69. | Pine Brook | 1.46% | 0.83% (+0.633)#69 | 0.41% (+1.06)#1,268 |
| 70. | Morristown | 1.43% | 0.83% (+0.595)#70 | 0.41% (+1.02)#1,291 |
| 71. | Madison Borough | 1.42% | 0.83% (+0.586)#71 | 0.41% (+1.01)#1,299 |
| 72. | Pine Beach Borough | 1.42% | 0.83% (+0.585)#72 | 0.41% (+1.01)#1,301 |
| 73. | Six Mile Run | 1.41% | 0.83% (+0.584)#73 | 0.41% (+1.01)#1,305 |
| 74. | Port Reading | 1.41% | 0.83% (+0.580)#74 | 0.41% (+1.00)#1,309 |
| 75. | Englishtown Borough | 1.41% | 0.83% (+0.578)#75 | 0.41% (+1.00)#1,314 |
| 76. | Seaside Park Borough | 1.39% | 0.83% (+0.559)#76 | 0.41% (+0.982)#1,331 |
| 77. | Newfield Borough | 1.37% | 0.83% (+0.535)#77 | 0.41% (+0.958)#1,362 |
| 78. | Leisure Village West | 1.36% | 0.83% (+0.531)#78 | 0.41% (+0.954)#1,367 |
| 79. | Fords | 1.34% | 0.83% (+0.512)#79 | 0.41% (+0.934)#1,385 |
| 80. | Gillette | 1.33% | 0.83% (+0.501)#80 | 0.41% (+0.924)#1,401 |
| 81. | Haledon Borough | 1.32% | 0.83% (+0.488)#81 | 0.41% (+0.911)#1,419 |
| 82. | Succasunna | 1.31% | 0.83% (+0.481)#82 | 0.41% (+0.904)#1,426 |
| 83. | Stanhope Borough | 1.30% | 0.83% (+0.471)#83 | 0.41% (+0.894)#1,431 |
| 84. | Villas | 1.27% | 0.83% (+0.439)#84 | 0.41% (+0.861)#1,457 |
| 85. | Alpha Borough | 1.26% | 0.83% (+0.429)#85 | 0.41% (+0.851)#1,469 |
| 86. | Iselin | 1.24% | 0.83% (+0.406)#86 | 0.41% (+0.829)#1,497 |
| 87. | Westwood Borough | 1.24% | 0.83% (+0.406)#87 | 0.41% (+0.828)#1,499 |
| 88. | Oakland Borough | 1.23% | 0.83% (+0.402)#88 | 0.41% (+0.825)#1,501 |
| 89. | The College Of New Jersey | 1.23% | 0.83% (+0.402)#89 | 0.41% (+0.825)#1,502 |
| 90. | Millington | 1.22% | 0.83% (+0.394)#90 | 0.41% (+0.816)#1,520 |
| 91. | Barnegat | 1.22% | 0.83% (+0.387)#91 | 0.41% (+0.810)#1,527 |
| 92. | Mays Landing | 1.21% | 0.83% (+0.382)#92 | 0.41% (+0.805)#1,529 |
| 93. | Ramapo College Of New Jersey | 1.20% | 0.83% (+0.373)#93 | 0.41% (+0.796)#1,538 |
| 94. | William Paterson University Of New Jersey | 1.20% | 0.83% (+0.366)#94 | 0.41% (+0.788)#1,546 |
| 95. | Somerdale Borough | 1.19% | 0.83% (+0.364)#95 | 0.41% (+0.787)#1,551 |
| 96. | Lake Hopatcong | 1.18% | 0.83% (+0.352)#96 | 0.41% (+0.775)#1,565 |
| 97. | Tinton Falls Borough | 1.15% | 0.83% (+0.321)#97 | 0.41% (+0.744)#1,604 |
| 98. | Bound Brook Borough | 1.13% | 0.83% (+0.295)#98 | 0.41% (+0.717)#1,637 |
| 99. | Port Republic | 1.12% | 0.83% (+0.292)#99 | 0.41% (+0.714)#1,642 |
| 100. | Leonardo | 1.11% | 0.83% (+0.282)#100 | 0.41% (+0.705)#1,656 |
Common Questions
What are the Top 10 Cities with the Highest Percentage of Portuguese Population in New Jersey?
Top 10 Cities with the Highest Percentage of Portuguese Population in New Jersey are:
#1
9.98%
#2
9.16%
#3
6.26%
#4
5.53%
#5
5.52%
#6
5.45%
#7
5.43%
#8
4.72%
#9
3.83%
#10
3.81%
What city has the Highest Percentage of Portuguese Population in New Jersey?
Annandale has the Highest Percentage of Portuguese Population in New Jersey with 9.98%.
What is the Percentage of Portuguese Population in the State of New Jersey?
Percentage of Portuguese Population in New Jersey is 0.83%.
What is the Percentage of Portuguese Population in the United States?
Percentage of Portuguese Population in the United States is 0.41%.