Cities with the Largest Sri Lankan Community in New Jersey
RELATED REPORTS & OPTIONS
Sri Lankan
New Jersey
Compare Cities
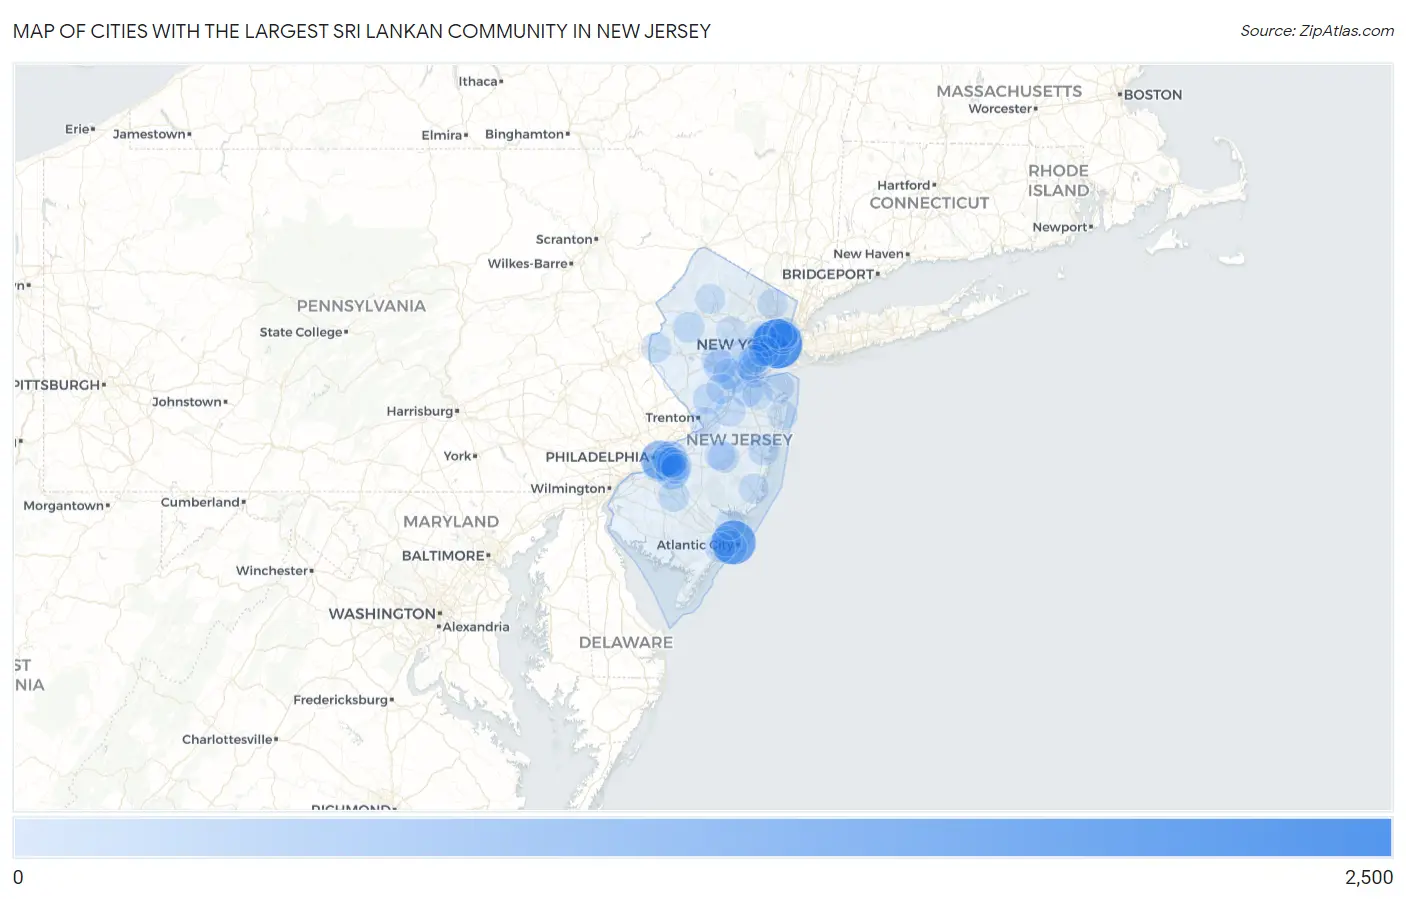
Map of Cities with the Largest Sri Lankan Community in New Jersey
0
2,500
Cities with the Largest Sri Lankan Community in New Jersey
| City | Sri Lankan | vs State | vs National | |
| 1. | Jersey City | 2,123 | 27,431(7.74%)#1 | 2,246,463(0.09%)#129 |
| 2. | Atlantic City | 1,497 | 27,431(5.46%)#2 | 2,246,463(0.07%)#211 |
| 3. | Camden | 931 | 27,431(3.39%)#3 | 2,246,463(0.04%)#331 |
| 4. | Cherry Hill Mall | 599 | 27,431(2.18%)#4 | 2,246,463(0.03%)#505 |
| 5. | Eatontown Borough | 447 | 27,431(1.63%)#5 | 2,246,463(0.02%)#671 |
| 6. | Ventnor City | 426 | 27,431(1.55%)#6 | 2,246,463(0.02%)#693 |
| 7. | Echelon | 408 | 27,431(1.49%)#7 | 2,246,463(0.02%)#721 |
| 8. | Finderne | 302 | 27,431(1.10%)#8 | 2,246,463(0.01%)#898 |
| 9. | Bayonne | 290 | 27,431(1.06%)#9 | 2,246,463(0.01%)#939 |
| 10. | South Plainfield Borough | 236 | 27,431(0.86%)#10 | 2,246,463(0.01%)#1,087 |
| 11. | Sicklerville | 227 | 27,431(0.83%)#11 | 2,246,463(0.01%)#1,114 |
| 12. | Magnolia Borough | 214 | 27,431(0.78%)#12 | 2,246,463(0.01%)#1,168 |
| 13. | Fair Lawn Borough | 195 | 27,431(0.71%)#13 | 2,246,463(0.01%)#1,249 |
| 14. | Dunellen Borough | 182 | 27,431(0.66%)#14 | 2,246,463(0.01%)#1,333 |
| 15. | Ashland | 181 | 27,431(0.66%)#15 | 2,246,463(0.01%)#1,342 |
| 16. | Gloucester City | 180 | 27,431(0.66%)#16 | 2,246,463(0.01%)#1,346 |
| 17. | Newark | 174 | 27,431(0.63%)#17 | 2,246,463(0.01%)#1,374 |
| 18. | Wharton Borough | 173 | 27,431(0.63%)#18 | 2,246,463(0.01%)#1,382 |
| 19. | Princeton | 171 | 27,431(0.62%)#19 | 2,246,463(0.01%)#1,389 |
| 20. | Beattystown | 160 | 27,431(0.58%)#20 | 2,246,463(0.01%)#1,446 |
| 21. | Middlesex Borough | 156 | 27,431(0.57%)#21 | 2,246,463(0.01%)#1,464 |
| 22. | Williamstown | 154 | 27,431(0.56%)#22 | 2,246,463(0.01%)#1,474 |
| 23. | Westfield | 153 | 27,431(0.56%)#23 | 2,246,463(0.01%)#1,478 |
| 24. | Hoboken | 150 | 27,431(0.55%)#24 | 2,246,463(0.01%)#1,494 |
| 25. | New Milford Borough | 149 | 27,431(0.54%)#25 | 2,246,463(0.01%)#1,505 |
| 26. | New Brunswick | 145 | 27,431(0.53%)#26 | 2,246,463(0.01%)#1,528 |
| 27. | Toms River | 144 | 27,431(0.52%)#27 | 2,246,463(0.01%)#1,539 |
| 28. | Lake Hiawatha | 141 | 27,431(0.51%)#28 | 2,246,463(0.01%)#1,562 |
| 29. | Golden Triangle | 141 | 27,431(0.51%)#29 | 2,246,463(0.01%)#1,563 |
| 30. | Woodlynne Borough | 136 | 27,431(0.50%)#30 | 2,246,463(0.01%)#1,601 |
| 31. | Old Bridge | 134 | 27,431(0.49%)#31 | 2,246,463(0.01%)#1,615 |
| 32. | Somerset | 134 | 27,431(0.49%)#32 | 2,246,463(0.01%)#1,617 |
| 33. | Manville Borough | 133 | 27,431(0.48%)#33 | 2,246,463(0.01%)#1,625 |
| 34. | Ellisburg | 130 | 27,431(0.47%)#34 | 2,246,463(0.01%)#1,652 |
| 35. | Twin Rivers | 121 | 27,431(0.44%)#35 | 2,246,463(0.01%)#1,738 |
| 36. | Country Lake Estates | 119 | 27,431(0.43%)#36 | 2,246,463(0.01%)#1,758 |
| 37. | Greentree | 116 | 27,431(0.42%)#37 | 2,246,463(0.01%)#1,777 |
| 38. | Hasbrouck Heights Borough | 115 | 27,431(0.42%)#38 | 2,246,463(0.01%)#1,788 |
| 39. | Ocean View | 107 | 27,431(0.39%)#39 | 2,246,463(0.00%)#1,864 |
| 40. | Perth Amboy | 105 | 27,431(0.38%)#40 | 2,246,463(0.00%)#1,876 |
| 41. | Tenafly Borough | 105 | 27,431(0.38%)#41 | 2,246,463(0.00%)#1,880 |
| 42. | Palmyra Borough | 105 | 27,431(0.38%)#42 | 2,246,463(0.00%)#1,881 |
| 43. | Mckee | 103 | 27,431(0.38%)#43 | 2,246,463(0.00%)#1,894 |
| 44. | Fort Lee Borough | 102 | 27,431(0.37%)#44 | 2,246,463(0.00%)#1,899 |
| 45. | Madison Borough | 101 | 27,431(0.37%)#45 | 2,246,463(0.00%)#1,912 |
| 46. | Ridgewood | 100 | 27,431(0.36%)#46 | 2,246,463(0.00%)#1,926 |
| 47. | Leonardo | 100 | 27,431(0.36%)#47 | 2,246,463(0.00%)#1,933 |
| 48. | Glassboro Borough | 98 | 27,431(0.36%)#48 | 2,246,463(0.00%)#1,955 |
| 49. | Rutherford Borough | 95 | 27,431(0.35%)#49 | 2,246,463(0.00%)#1,993 |
| 50. | Iselin | 95 | 27,431(0.35%)#50 | 2,246,463(0.00%)#1,994 |
| 51. | Englewood Cliffs Borough | 94 | 27,431(0.34%)#51 | 2,246,463(0.00%)#2,006 |
| 52. | White Horse | 93 | 27,431(0.34%)#52 | 2,246,463(0.00%)#2,019 |
| 53. | Browns Mills | 92 | 27,431(0.34%)#53 | 2,246,463(0.00%)#2,029 |
| 54. | Woodbridge | 90 | 27,431(0.33%)#54 | 2,246,463(0.00%)#2,053 |
| 55. | Roseland Borough | 89 | 27,431(0.32%)#55 | 2,246,463(0.00%)#2,065 |
| 56. | Parsippany | 87 | 27,431(0.32%)#56 | 2,246,463(0.00%)#2,089 |
| 57. | Edgewater Borough | 87 | 27,431(0.32%)#57 | 2,246,463(0.00%)#2,093 |
| 58. | East Orange | 86 | 27,431(0.31%)#58 | 2,246,463(0.00%)#2,099 |
| 59. | Pleasantville | 85 | 27,431(0.31%)#59 | 2,246,463(0.00%)#2,109 |
| 60. | Park Ridge Borough | 85 | 27,431(0.31%)#60 | 2,246,463(0.00%)#2,114 |
| 61. | Morris Plains Borough | 85 | 27,431(0.31%)#61 | 2,246,463(0.00%)#2,116 |
| 62. | Wood Ridge Borough | 83 | 27,431(0.30%)#62 | 2,246,463(0.00%)#2,146 |
| 63. | Kingston Estates | 82 | 27,431(0.30%)#63 | 2,246,463(0.00%)#2,163 |
| 64. | West New York | 81 | 27,431(0.30%)#64 | 2,246,463(0.00%)#2,165 |
| 65. | Chatham Borough | 77 | 27,431(0.28%)#65 | 2,246,463(0.00%)#2,236 |
| 66. | Springdale | 75 | 27,431(0.27%)#66 | 2,246,463(0.00%)#2,267 |
| 67. | Sayreville Borough | 73 | 27,431(0.27%)#67 | 2,246,463(0.00%)#2,303 |
| 68. | Raritan Borough | 73 | 27,431(0.27%)#68 | 2,246,463(0.00%)#2,316 |
| 69. | Morganville | 72 | 27,431(0.26%)#69 | 2,246,463(0.00%)#2,335 |
| 70. | Bergenfield Borough | 71 | 27,431(0.26%)#70 | 2,246,463(0.00%)#2,347 |
| 71. | Greenwich | 71 | 27,431(0.26%)#71 | 2,246,463(0.00%)#2,361 |
| 72. | Ocean Acres | 70 | 27,431(0.26%)#72 | 2,246,463(0.00%)#2,371 |
| 73. | Paramus Borough | 69 | 27,431(0.25%)#73 | 2,246,463(0.00%)#2,384 |
| 74. | Union | 69 | 27,431(0.25%)#74 | 2,246,463(0.00%)#2,396 |
| 75. | Ringwood Borough | 65 | 27,431(0.24%)#75 | 2,246,463(0.00%)#2,449 |
| 76. | Kendall Park | 62 | 27,431(0.23%)#76 | 2,246,463(0.00%)#2,495 |
| 77. | Glen Ridge Borough | 62 | 27,431(0.23%)#77 | 2,246,463(0.00%)#2,502 |
| 78. | Moonachie Borough | 60 | 27,431(0.22%)#78 | 2,246,463(0.00%)#2,543 |
| 79. | The Hills | 59 | 27,431(0.22%)#79 | 2,246,463(0.00%)#2,564 |
| 80. | Woodstown Borough | 59 | 27,431(0.22%)#80 | 2,246,463(0.00%)#2,572 |
| 81. | Hillsborough | 58 | 27,431(0.21%)#81 | 2,246,463(0.00%)#2,585 |
| 82. | Linden | 57 | 27,431(0.21%)#82 | 2,246,463(0.00%)#2,607 |
| 83. | Smithville | 57 | 27,431(0.21%)#83 | 2,246,463(0.00%)#2,618 |
| 84. | South Bound Brook Borough | 57 | 27,431(0.21%)#84 | 2,246,463(0.00%)#2,623 |
| 85. | Wanamassa | 57 | 27,431(0.21%)#85 | 2,246,463(0.00%)#2,625 |
| 86. | Rahway | 56 | 27,431(0.20%)#86 | 2,246,463(0.00%)#2,631 |
| 87. | Neshanic Station | 56 | 27,431(0.20%)#87 | 2,246,463(0.00%)#2,641 |
| 88. | Westville Borough | 55 | 27,431(0.20%)#88 | 2,246,463(0.00%)#2,663 |
| 89. | Little Ferry Borough | 54 | 27,431(0.20%)#89 | 2,246,463(0.00%)#2,673 |
| 90. | Union City | 53 | 27,431(0.19%)#90 | 2,246,463(0.00%)#2,685 |
| 91. | Secaucus | 53 | 27,431(0.19%)#91 | 2,246,463(0.00%)#2,689 |
| 92. | Linwood | 51 | 27,431(0.19%)#92 | 2,246,463(0.00%)#2,747 |
| 93. | Rainbow Lakes | 50 | 27,431(0.18%)#93 | 2,246,463(0.00%)#2,773 |
| 94. | Elizabeth | 47 | 27,431(0.17%)#94 | 2,246,463(0.00%)#2,815 |
| 95. | Morristown | 45 | 27,431(0.16%)#95 | 2,246,463(0.00%)#2,872 |
| 96. | Rutgers University-Busch Campus | 45 | 27,431(0.16%)#96 | 2,246,463(0.00%)#2,880 |
| 97. | Green Knoll | 45 | 27,431(0.16%)#97 | 2,246,463(0.00%)#2,881 |
| 98. | Rockaway Borough | 45 | 27,431(0.16%)#98 | 2,246,463(0.00%)#2,882 |
| 99. | Lake Mohawk | 44 | 27,431(0.16%)#99 | 2,246,463(0.00%)#2,906 |
| 100. | Basking Ridge | 42 | 27,431(0.15%)#100 | 2,246,463(0.00%)#2,959 |
Common Questions
What are the Top 10 Cities with the Largest Sri Lankan Community in New Jersey?
Top 10 Cities with the Largest Sri Lankan Community in New Jersey are:
#1
2,123
#2
1,497
#3
931
#4
599
#5
426
#6
408
#7
302
#8
290
#9
181
#10
180
What city has the Largest Sri Lankan Community in New Jersey?
Jersey City has the Largest Sri Lankan Community in New Jersey with 2,123.
What is the Total Sri Lankan Population in the State of New Jersey?
Total Sri Lankan Population in New Jersey is 27,431.
What is the Total Sri Lankan Population in the United States?
Total Sri Lankan Population in the United States is 2,246,463.