Cities with the Highest Percentage of Population with a Degree in Psychology in New Jersey
RELATED REPORTS & OPTIONS
Psychology
New Jersey
Compare Cities
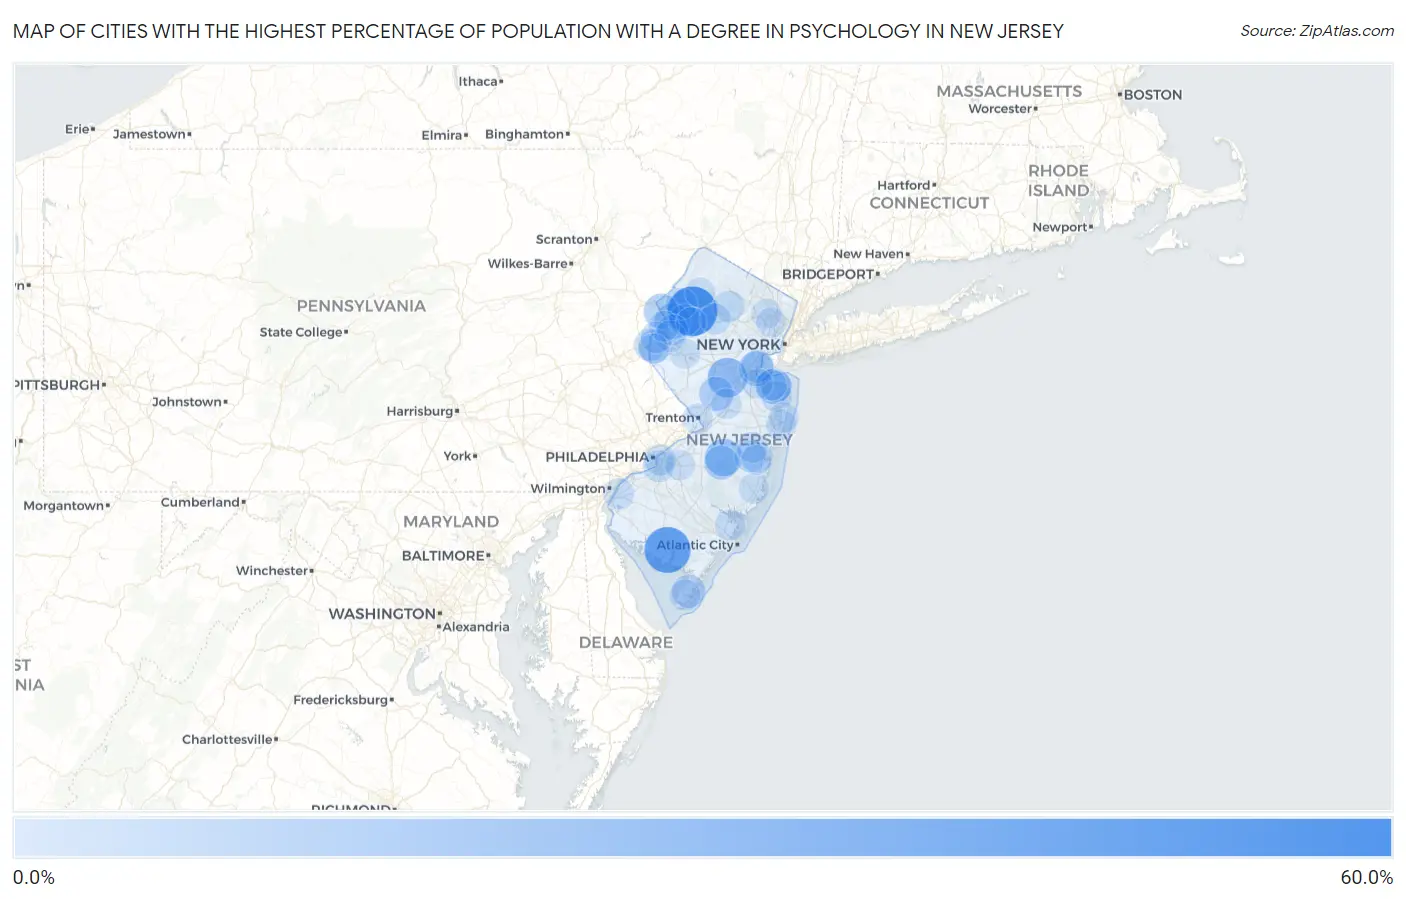
Map of Cities with the Highest Percentage of Population with a Degree in Psychology in New Jersey
0.0%
60.0%
Cities with the Highest Percentage of Population with a Degree in Psychology in New Jersey
| City | % Graduates | vs State | vs National | |
| 1. | Allamuchy | 55.9% | 5.5%(+50.4)#1 | 5.1%(+50.8)#132 |
| 2. | Laurel Lake | 47.1% | 5.5%(+41.6)#2 | 5.1%(+42.1)#226 |
| 3. | William Paterson University Of New Jersey | 46.4% | 5.5%(+40.9)#3 | 5.1%(+41.4)#231 |
| 4. | Leeds Point | 43.9% | 5.5%(+38.4)#4 | 5.1%(+38.9)#258 |
| 5. | Leesburg | 36.2% | 5.5%(+30.7)#5 | 5.1%(+31.2)#368 |
| 6. | Windsor | 35.4% | 5.5%(+29.9)#6 | 5.1%(+30.3)#379 |
| 7. | Victory Gardens Borough | 31.7% | 5.5%(+26.2)#7 | 5.1%(+26.7)#459 |
| 8. | Clyde | 31.2% | 5.5%(+25.7)#8 | 5.1%(+26.2)#469 |
| 9. | Dorchester | 26.8% | 5.5%(+21.3)#9 | 5.1%(+21.8)#606 |
| 10. | Cream Ridge | 26.8% | 5.5%(+21.3)#10 | 5.1%(+21.7)#607 |
| 11. | Vincentown | 26.8% | 5.5%(+21.3)#11 | 5.1%(+21.7)#608 |
| 12. | Fortescue | 26.3% | 5.5%(+20.8)#12 | 5.1%(+21.3)#631 |
| 13. | Country Lake Estates | 26.2% | 5.5%(+20.7)#13 | 5.1%(+21.2)#634 |
| 14. | Grenloch | 23.4% | 5.5%(+17.9)#14 | 5.1%(+18.4)#790 |
| 15. | Mountain Lake | 22.2% | 5.5%(+16.7)#15 | 5.1%(+17.2)#855 |
| 16. | Port Monmouth | 21.2% | 5.5%(+15.7)#16 | 5.1%(+16.1)#944 |
| 17. | Columbia | 20.3% | 5.5%(+14.8)#17 | 5.1%(+15.2)#1,013 |
| 18. | Rutgers University-Busch Campus | 20.1% | 5.5%(+14.6)#18 | 5.1%(+15.0)#1,024 |
| 19. | Sewaren | 20.0% | 5.5%(+14.5)#19 | 5.1%(+14.9)#1,071 |
| 20. | Pluckemin | 19.3% | 5.5%(+13.8)#20 | 5.1%(+14.2)#1,123 |
| 21. | Kingston | 18.6% | 5.5%(+13.1)#21 | 5.1%(+13.6)#1,192 |
| 22. | Richland | 18.6% | 5.5%(+13.1)#22 | 5.1%(+13.6)#1,194 |
| 23. | Presidential Lakes Estates | 18.4% | 5.5%(+12.9)#23 | 5.1%(+13.4)#1,211 |
| 24. | Encore At Monroe | 18.3% | 5.5%(+12.8)#24 | 5.1%(+13.2)#1,223 |
| 25. | Montclair State University | 17.9% | 5.5%(+12.4)#25 | 5.1%(+12.9)#1,267 |
| 26. | Glen Gardner Borough | 17.8% | 5.5%(+12.3)#26 | 5.1%(+12.7)#1,288 |
| 27. | East Vineland | 17.5% | 5.5%(+11.9)#27 | 5.1%(+12.4)#1,326 |
| 28. | West Park | 16.9% | 5.5%(+11.4)#28 | 5.1%(+11.9)#1,377 |
| 29. | Lopatcong Overlook | 16.7% | 5.5%(+11.2)#29 | 5.1%(+11.6)#1,405 |
| 30. | Burleigh | 16.4% | 5.5%(+10.9)#30 | 5.1%(+11.4)#1,469 |
| 31. | Silver Lake | 16.1% | 5.5%(+10.5)#31 | 5.1%(+11.0)#1,518 |
| 32. | Bloomsbury Borough | 16.0% | 5.5%(+10.4)#32 | 5.1%(+10.9)#1,529 |
| 33. | Andover Borough | 15.3% | 5.5%(+9.80)#33 | 5.1%(+10.3)#1,652 |
| 34. | Wrightstown Borough | 14.8% | 5.5%(+9.30)#34 | 5.1%(+9.76)#1,719 |
| 35. | Port Reading | 14.7% | 5.5%(+9.18)#35 | 5.1%(+9.64)#1,740 |
| 36. | Lake Como Borough | 13.4% | 5.5%(+7.93)#36 | 5.1%(+8.40)#2,018 |
| 37. | Delaware Park | 13.2% | 5.5%(+7.73)#37 | 5.1%(+8.19)#2,084 |
| 38. | Pine Hill Borough | 12.8% | 5.5%(+7.30)#38 | 5.1%(+7.77)#2,179 |
| 39. | Vienna | 12.6% | 5.5%(+7.07)#39 | 5.1%(+7.54)#2,238 |
| 40. | East Newark Borough | 12.6% | 5.5%(+7.06)#40 | 5.1%(+7.52)#2,240 |
| 41. | Marksboro | 12.5% | 5.5%(+6.99)#41 | 5.1%(+7.45)#2,287 |
| 42. | Clementon Borough | 12.5% | 5.5%(+6.95)#42 | 5.1%(+7.41)#2,300 |
| 43. | Gloucester City | 12.4% | 5.5%(+6.90)#43 | 5.1%(+7.37)#2,312 |
| 44. | Lake Telemark | 12.4% | 5.5%(+6.85)#44 | 5.1%(+7.31)#2,325 |
| 45. | Pine Ridge At Crestwood | 12.3% | 5.5%(+6.78)#45 | 5.1%(+7.25)#2,342 |
| 46. | Harmony | 12.2% | 5.5%(+6.73)#46 | 5.1%(+7.19)#2,361 |
| 47. | Brass Castle | 12.0% | 5.5%(+6.52)#47 | 5.1%(+6.98)#2,435 |
| 48. | Great Notch | 12.0% | 5.5%(+6.46)#48 | 5.1%(+6.92)#2,465 |
| 49. | Camden | 12.0% | 5.5%(+6.46)#49 | 5.1%(+6.92)#2,466 |
| 50. | Fairview | 11.8% | 5.5%(+6.27)#50 | 5.1%(+6.73)#2,535 |
| 51. | Belford | 11.7% | 5.5%(+6.23)#51 | 5.1%(+6.69)#2,561 |
| 52. | North Middletown | 11.7% | 5.5%(+6.20)#52 | 5.1%(+6.66)#2,568 |
| 53. | New Vernon | 11.7% | 5.5%(+6.14)#53 | 5.1%(+6.61)#2,585 |
| 54. | Moonachie Borough | 11.6% | 5.5%(+6.05)#54 | 5.1%(+6.52)#2,614 |
| 55. | Oxford | 11.6% | 5.5%(+6.05)#55 | 5.1%(+6.51)#2,616 |
| 56. | Bargaintown | 11.6% | 5.5%(+6.04)#56 | 5.1%(+6.50)#2,620 |
| 57. | Kenvil | 11.6% | 5.5%(+6.04)#57 | 5.1%(+6.50)#2,621 |
| 58. | Lindenwold Borough | 11.5% | 5.5%(+5.97)#58 | 5.1%(+6.43)#2,652 |
| 59. | Holiday City South | 11.4% | 5.5%(+5.88)#59 | 5.1%(+6.34)#2,686 |
| 60. | Stratford Borough | 11.4% | 5.5%(+5.86)#60 | 5.1%(+6.32)#2,696 |
| 61. | Highland Park Borough | 11.3% | 5.5%(+5.78)#61 | 5.1%(+6.24)#2,725 |
| 62. | Carneys Point | 11.0% | 5.5%(+5.46)#62 | 5.1%(+5.93)#2,859 |
| 63. | Ampere North | 10.8% | 5.5%(+5.26)#63 | 5.1%(+5.73)#2,943 |
| 64. | Rio Grande | 10.6% | 5.5%(+5.12)#64 | 5.1%(+5.58)#3,005 |
| 65. | Titusville | 10.6% | 5.5%(+5.05)#65 | 5.1%(+5.51)#3,036 |
| 66. | Netcong Borough | 10.5% | 5.5%(+5.02)#66 | 5.1%(+5.49)#3,050 |
| 67. | Hopelawn | 10.5% | 5.5%(+4.96)#67 | 5.1%(+5.43)#3,097 |
| 68. | Leisure Knoll | 10.5% | 5.5%(+4.94)#68 | 5.1%(+5.40)#3,110 |
| 69. | West Belmar | 10.4% | 5.5%(+4.89)#69 | 5.1%(+5.35)#3,134 |
| 70. | Marshallville | 10.4% | 5.5%(+4.88)#70 | 5.1%(+5.34)#3,141 |
| 71. | Smithville | 10.3% | 5.5%(+4.78)#71 | 5.1%(+5.25)#3,197 |
| 72. | North Plainfield Borough | 10.2% | 5.5%(+4.72)#72 | 5.1%(+5.18)#3,232 |
| 73. | Emerson Borough | 10.2% | 5.5%(+4.67)#73 | 5.1%(+5.13)#3,262 |
| 74. | Belvidere | 10.1% | 5.5%(+4.63)#74 | 5.1%(+5.09)#3,283 |
| 75. | Island Heights Borough | 10.1% | 5.5%(+4.56)#75 | 5.1%(+5.03)#3,311 |
| 76. | Pitman Borough | 10.1% | 5.5%(+4.56)#76 | 5.1%(+5.02)#3,318 |
| 77. | Alpha Borough | 10.0% | 5.5%(+4.51)#77 | 5.1%(+4.97)#3,341 |
| 78. | Woodstown Borough | 10.0% | 5.5%(+4.44)#78 | 5.1%(+4.91)#3,415 |
| 79. | Trenton | 10.0% | 5.5%(+4.44)#79 | 5.1%(+4.90)#3,418 |
| 80. | Cranbury | 9.9% | 5.5%(+4.38)#80 | 5.1%(+4.84)#3,437 |
| 81. | Layton | 9.8% | 5.5%(+4.24)#81 | 5.1%(+4.70)#3,515 |
| 82. | Laurence Harbor | 9.7% | 5.5%(+4.23)#82 | 5.1%(+4.69)#3,523 |
| 83. | Ocean Acres | 9.6% | 5.5%(+4.10)#83 | 5.1%(+4.57)#3,579 |
| 84. | Flemington Borough | 9.6% | 5.5%(+4.08)#84 | 5.1%(+4.55)#3,593 |
| 85. | Stone Harbor Borough | 9.6% | 5.5%(+4.08)#85 | 5.1%(+4.54)#3,597 |
| 86. | Hackettstown | 9.5% | 5.5%(+4.02)#86 | 5.1%(+4.48)#3,628 |
| 87. | Marlton | 9.4% | 5.5%(+3.93)#87 | 5.1%(+4.40)#3,692 |
| 88. | Hi Nella Borough | 9.4% | 5.5%(+3.84)#88 | 5.1%(+4.30)#3,753 |
| 89. | Paterson | 9.3% | 5.5%(+3.82)#89 | 5.1%(+4.28)#3,773 |
| 90. | Little Silver Borough | 9.3% | 5.5%(+3.82)#90 | 5.1%(+4.28)#3,775 |
| 91. | Pleasantdale | 9.3% | 5.5%(+3.81)#91 | 5.1%(+4.27)#3,777 |
| 92. | Palermo | 9.3% | 5.5%(+3.79)#92 | 5.1%(+4.26)#3,786 |
| 93. | Upper Pohatcong | 9.2% | 5.5%(+3.73)#93 | 5.1%(+4.19)#3,836 |
| 94. | Annandale | 9.2% | 5.5%(+3.67)#94 | 5.1%(+4.13)#3,870 |
| 95. | Passaic | 9.2% | 5.5%(+3.67)#95 | 5.1%(+4.13)#3,871 |
| 96. | Lakehurst Borough | 9.2% | 5.5%(+3.67)#96 | 5.1%(+4.13)#3,874 |
| 97. | Holiday Heights | 9.2% | 5.5%(+3.64)#97 | 5.1%(+4.11)#3,889 |
| 98. | Newton | 9.2% | 5.5%(+3.64)#98 | 5.1%(+4.10)#3,891 |
| 99. | Asbury Park | 9.2% | 5.5%(+3.64)#99 | 5.1%(+4.10)#3,895 |
| 100. | Montvale Borough | 9.1% | 5.5%(+3.60)#100 | 5.1%(+4.06)#3,910 |
Common Questions
What are the Top 10 Cities with the Highest Percentage of Population with a Degree in Psychology in New Jersey?
Top 10 Cities with the Highest Percentage of Population with a Degree in Psychology in New Jersey are:
#1
55.9%
#2
47.1%
#3
31.2%
#4
26.2%
#5
22.2%
#6
21.2%
#7
20.3%
#8
20.0%
#9
18.6%
#10
18.4%
What city has the Highest Percentage of Population with a Degree in Psychology in New Jersey?
Allamuchy has the Highest Percentage of Population with a Degree in Psychology in New Jersey with 55.9%.
What is the Percentage of Population with a Degree in Psychology in the State of New Jersey?
Percentage of Population with a Degree in Psychology in New Jersey is 5.5%.
What is the Percentage of Population with a Degree in Psychology in the United States?
Percentage of Population with a Degree in Psychology in the United States is 5.1%.