Cities with the Highest Percentage of Immigrants from Canada in New Jersey
RELATED REPORTS & OPTIONS
Canada
New Jersey
Compare Cities
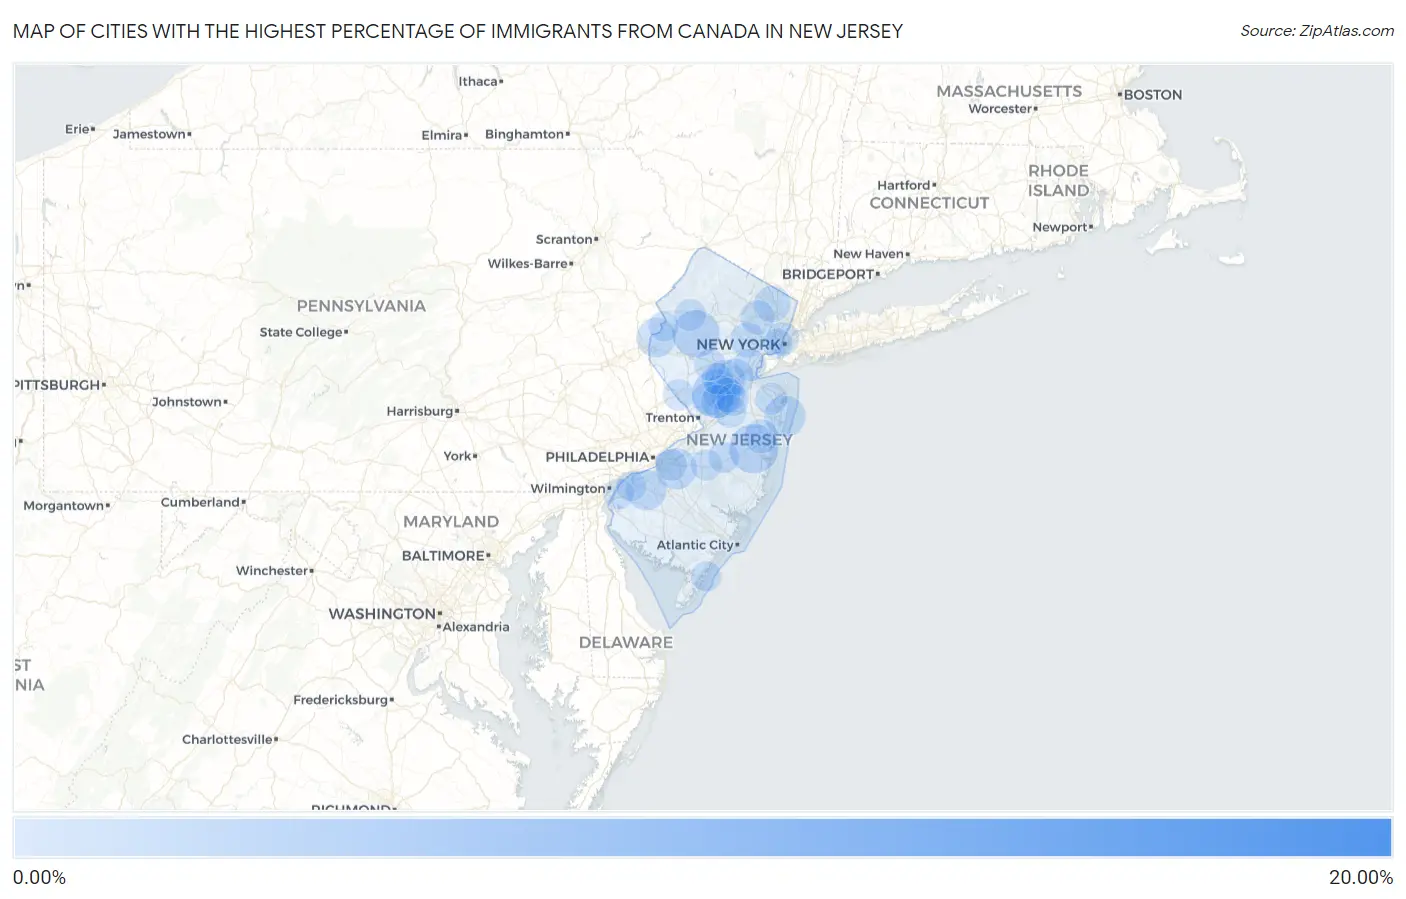
Map of Cities with the Highest Percentage of Immigrants from Canada in New Jersey
0.00%
20.00%
Cities with the Highest Percentage of Immigrants from Canada in New Jersey
| City | Canada | vs State | vs National | |
| 1. | Rutgers University-Livingston Campus | 15.21% | 0.20%(+15.0)#-1 | 0.25%(+15.0)#0 |
| 2. | Rutgers University-Busch Campus | 9.44% | 0.20%(+9.24)#0 | 0.25%(+9.19)#1 |
| 3. | Cream Ridge | 6.81% | 0.20%(+6.61)#1 | 0.25%(+6.56)#2 |
| 4. | Oceanville | 2.30% | 0.20%(+2.10)#2 | 0.25%(+2.05)#3 |
| 5. | Rainbow Lakes | 2.11% | 0.20%(+1.91)#3 | 0.25%(+1.86)#4 |
| 6. | Leisure Village West | 2.07% | 0.20%(+1.87)#4 | 0.25%(+1.82)#5 |
| 7. | Pitman Borough | 2.07% | 0.20%(+1.87)#208 | 0.25%(+1.82)#2,225 |
| 8. | Kingston | 2.02% | 0.20%(+1.82)#209 | 0.25%(+1.77)#2,226 |
| 9. | Long Valley | 1.91% | 0.20%(+1.71)#210 | 0.25%(+1.66)#2,227 |
| 10. | South Seaville | 1.90% | 0.20%(+1.70)#211 | 0.25%(+1.65)#2,228 |
| 11. | Allentown Borough | 1.82% | 0.20%(+1.62)#212 | 0.25%(+1.57)#2,229 |
| 12. | Clearbrook | 1.65% | 0.20%(+1.45)#213 | 0.25%(+1.40)#2,230 |
| 13. | Beach Haven Borough | 1.60% | 0.20%(+1.40)#214 | 0.25%(+1.35)#2,231 |
| 14. | Neshanic | 1.51% | 0.20%(+1.31)#215 | 0.25%(+1.26)#2,232 |
| 15. | Chester Borough | 1.49% | 0.20%(+1.29)#216 | 0.25%(+1.24)#2,233 |
| 16. | Stone Harbor Borough | 1.47% | 0.20%(+1.27)#217 | 0.25%(+1.22)#2,234 |
| 17. | Ledgewood | 1.43% | 0.20%(+1.23)#218 | 0.25%(+1.18)#2,235 |
| 18. | Peapack And Gladstone Borough | 1.41% | 0.20%(+1.21)#237 | 0.25%(+1.16)#3,111 |
| 19. | Springdale | 1.36% | 0.20%(+1.17)#238 | 0.25%(+1.12)#3,112 |
| 20. | Loch Arbour | 1.36% | 0.20%(+1.17)#239 | 0.25%(+1.12)#3,113 |
| 21. | Mullica Hill | 1.28% | 0.20%(+1.08)#240 | 0.25%(+1.03)#3,114 |
| 22. | Six Mile Run | 1.24% | 0.20%(+1.05)#241 | 0.25%(+0.996)#3,115 |
| 23. | Harmony | 1.22% | 0.20%(+1.02)#242 | 0.25%(+0.968)#3,116 |
| 24. | West Cape May Borough | 1.19% | 0.20%(+0.989)#243 | 0.25%(+0.938)#3,117 |
| 25. | Watchung Borough | 1.15% | 0.20%(+0.955)#244 | 0.25%(+0.905)#3,118 |
| 26. | Rocky Hill Borough | 1.13% | 0.20%(+0.935)#245 | 0.25%(+0.885)#3,119 |
| 27. | Montclair State University | 1.11% | 0.20%(+0.910)#246 | 0.25%(+0.860)#3,120 |
| 28. | Fair Haven Borough | 1.09% | 0.20%(+0.895)#247 | 0.25%(+0.845)#3,121 |
| 29. | Mendham Borough | 1.09% | 0.20%(+0.889)#248 | 0.25%(+0.839)#3,122 |
| 30. | Mount Tabor | 1.08% | 0.20%(+0.877)#249 | 0.25%(+0.827)#3,123 |
| 31. | New Brunswick | 1.05% | 0.20%(+0.848)#250 | 0.25%(+0.798)#3,220 |
| 32. | Highland Park Borough | 1.03% | 0.20%(+0.829)#251 | 0.25%(+0.779)#3,221 |
| 33. | Bloomingdale Borough | 1.02% | 0.20%(+0.824)#252 | 0.25%(+0.774)#3,222 |
| 34. | Stockton University | 0.99% | 0.20%(+0.790)#253 | 0.25%(+0.740)#3,223 |
| 35. | Califon Borough | 0.96% | 0.20%(+0.760)#254 | 0.25%(+0.710)#3,224 |
| 36. | Robbinsville Center | 0.96% | 0.20%(+0.760)#255 | 0.25%(+0.710)#3,225 |
| 37. | Ridgewood | 0.94% | 0.20%(+0.739)#256 | 0.25%(+0.689)#3,226 |
| 38. | Millington | 0.92% | 0.20%(+0.720)#257 | 0.25%(+0.670)#3,227 |
| 39. | Ramapo College Of New Jersey | 0.89% | 0.20%(+0.694)#258 | 0.25%(+0.643)#3,228 |
| 40. | Green | 0.89% | 0.20%(+0.688)#259 | 0.25%(+0.637)#3,229 |
| 41. | Highlands Borough | 0.82% | 0.20%(+0.620)#260 | 0.25%(+0.570)#3,230 |
| 42. | Rockaway Borough | 0.79% | 0.20%(+0.591)#261 | 0.25%(+0.541)#3,231 |
| 43. | Short Hills | 0.78% | 0.20%(+0.584)#262 | 0.25%(+0.534)#3,232 |
| 44. | Singac | 0.78% | 0.20%(+0.578)#263 | 0.25%(+0.528)#3,233 |
| 45. | Heathcote | 0.77% | 0.20%(+0.570)#264 | 0.25%(+0.520)#3,234 |
| 46. | Dayton | 0.75% | 0.20%(+0.555)#265 | 0.25%(+0.505)#3,235 |
| 47. | Chatham Borough | 0.75% | 0.20%(+0.552)#266 | 0.25%(+0.502)#3,236 |
| 48. | Lakewood | 0.73% | 0.20%(+0.528)#267 | 0.25%(+0.478)#3,237 |
| 49. | Penns Grove Borough | 0.72% | 0.20%(+0.525)#268 | 0.25%(+0.475)#3,238 |
| 50. | Raritan Borough | 0.72% | 0.20%(+0.525)#269 | 0.25%(+0.475)#3,239 |
| 51. | Glen Ridge Borough | 0.72% | 0.20%(+0.520)#270 | 0.25%(+0.470)#3,240 |
| 52. | Pompton Plains | 0.69% | 0.20%(+0.497)#271 | 0.25%(+0.446)#3,241 |
| 53. | Princeton | 0.69% | 0.20%(+0.495)#272 | 0.25%(+0.445)#3,242 |
| 54. | Hoboken | 0.68% | 0.20%(+0.478)#273 | 0.25%(+0.427)#3,243 |
| 55. | Plainsboro Center | 0.65% | 0.20%(+0.453)#274 | 0.25%(+0.403)#3,244 |
| 56. | Bogota Borough | 0.64% | 0.20%(+0.440)#275 | 0.25%(+0.389)#3,245 |
| 57. | Hewitt | 0.63% | 0.20%(+0.432)#276 | 0.25%(+0.382)#3,246 |
| 58. | Hopelawn | 0.62% | 0.20%(+0.421)#277 | 0.25%(+0.370)#3,247 |
| 59. | Twin Rivers | 0.61% | 0.20%(+0.416)#278 | 0.25%(+0.366)#3,248 |
| 60. | Iselin | 0.59% | 0.20%(+0.391)#279 | 0.25%(+0.341)#3,249 |
| 61. | Westville Borough | 0.58% | 0.20%(+0.387)#280 | 0.25%(+0.336)#3,250 |
| 62. | Pennington Borough | 0.58% | 0.20%(+0.377)#281 | 0.25%(+0.327)#3,251 |
| 63. | Haddonfield Borough | 0.57% | 0.20%(+0.372)#282 | 0.25%(+0.322)#3,252 |
| 64. | William Paterson University Of New Jersey | 0.56% | 0.20%(+0.365)#283 | 0.25%(+0.315)#3,253 |
| 65. | Red Bank Borough | 0.56% | 0.20%(+0.361)#284 | 0.25%(+0.311)#3,254 |
| 66. | Lincroft | 0.54% | 0.20%(+0.347)#285 | 0.25%(+0.296)#3,255 |
| 67. | Rossmoor | 0.54% | 0.20%(+0.343)#286 | 0.25%(+0.293)#3,256 |
| 68. | Stratford Borough | 0.53% | 0.20%(+0.333)#287 | 0.25%(+0.283)#3,257 |
| 69. | The Hills | 0.53% | 0.20%(+0.332)#288 | 0.25%(+0.282)#3,258 |
| 70. | Caldwell Borough | 0.53% | 0.20%(+0.330)#289 | 0.25%(+0.280)#3,259 |
| 71. | Milltown Borough | 0.53% | 0.20%(+0.329)#290 | 0.25%(+0.279)#3,260 |
| 72. | Waldwick Borough | 0.53% | 0.20%(+0.328)#291 | 0.25%(+0.278)#3,261 |
| 73. | Panther Valley | 0.53% | 0.20%(+0.328)#292 | 0.25%(+0.278)#3,262 |
| 74. | Barclay | 0.51% | 0.20%(+0.313)#293 | 0.25%(+0.262)#3,263 |
| 75. | Blackwells Mills | 0.51% | 0.20%(+0.310)#294 | 0.25%(+0.259)#3,264 |
| 76. | Hamburg Borough | 0.49% | 0.20%(+0.291)#295 | 0.25%(+0.240)#3,265 |
| 77. | Bradley Gardens | 0.49% | 0.20%(+0.290)#296 | 0.25%(+0.240)#3,266 |
| 78. | Lambertville | 0.48% | 0.20%(+0.287)#297 | 0.25%(+0.236)#3,267 |
| 79. | Englishtown Borough | 0.47% | 0.20%(+0.272)#298 | 0.25%(+0.222)#3,268 |
| 80. | Leisuretowne | 0.47% | 0.20%(+0.269)#299 | 0.25%(+0.219)#3,269 |
| 81. | Mountain Lakes Borough | 0.47% | 0.20%(+0.269)#300 | 0.25%(+0.219)#3,270 |
| 82. | Eatontown Borough | 0.47% | 0.20%(+0.268)#301 | 0.25%(+0.218)#3,271 |
| 83. | Manasquan Borough | 0.46% | 0.20%(+0.258)#302 | 0.25%(+0.208)#3,272 |
| 84. | Country Lake Estates | 0.45% | 0.20%(+0.257)#303 | 0.25%(+0.206)#3,273 |
| 85. | Pleasantdale | 0.45% | 0.20%(+0.249)#304 | 0.25%(+0.199)#3,274 |
| 86. | Hopewell Borough | 0.44% | 0.20%(+0.240)#305 | 0.25%(+0.190)#3,275 |
| 87. | Carneys Point | 0.43% | 0.20%(+0.232)#306 | 0.25%(+0.182)#3,276 |
| 88. | Oakland Borough | 0.42% | 0.20%(+0.226)#307 | 0.25%(+0.176)#3,277 |
| 89. | Stockton Borough | 0.42% | 0.20%(+0.223)#308 | 0.25%(+0.173)#3,278 |
| 90. | Washington Borough | 0.41% | 0.20%(+0.216)#309 | 0.25%(+0.166)#3,279 |
| 91. | Parsippany | 0.41% | 0.20%(+0.210)#310 | 0.25%(+0.160)#3,280 |
| 92. | Florham Park Borough | 0.40% | 0.20%(+0.201)#311 | 0.25%(+0.151)#3,281 |
| 93. | Liberty Corner | 0.40% | 0.20%(+0.200)#312 | 0.25%(+0.150)#3,282 |
| 94. | Jersey City | 0.40% | 0.20%(+0.198)#313 | 0.25%(+0.148)#3,283 |
| 95. | Belvidere | 0.39% | 0.20%(+0.197)#314 | 0.25%(+0.147)#3,284 |
| 96. | Sea Isle City | 0.39% | 0.20%(+0.193)#315 | 0.25%(+0.143)#3,285 |
| 97. | Roosevelt Borough | 0.39% | 0.20%(+0.188)#316 | 0.25%(+0.138)#3,286 |
| 98. | Brielle Borough | 0.38% | 0.20%(+0.185)#317 | 0.25%(+0.135)#3,287 |
| 99. | Beckett | 0.38% | 0.20%(+0.184)#318 | 0.25%(+0.134)#3,288 |
| 100. | Macopin | 0.38% | 0.20%(+0.183)#319 | 0.25%(+0.133)#3,289 |
Common Questions
What are the Top 10 Cities with the Highest Percentage of Immigrants from Canada in New Jersey?
Top 10 Cities with the Highest Percentage of Immigrants from Canada in New Jersey are:
#1
2.07%
#2
2.02%
#3
1.91%
#4
1.36%
#5
1.36%
#6
1.28%
#7
1.24%
#8
1.22%
#9
1.05%
#10
0.94%
What city has the Highest Percentage of Immigrants from Canada in New Jersey?
Leisure Village West has the Highest Percentage of Immigrants from Canada in New Jersey with 2.07%.
What is the Percentage of Immigrants from Canada in the State of New Jersey?
Percentage of Immigrants from Canada in New Jersey is 0.20%.
What is the Percentage of Immigrants from Canada in the United States?
Percentage of Immigrants from Canada in the United States is 0.25%.