West Belmar, NJ Map & Demographics
West Belmar Map
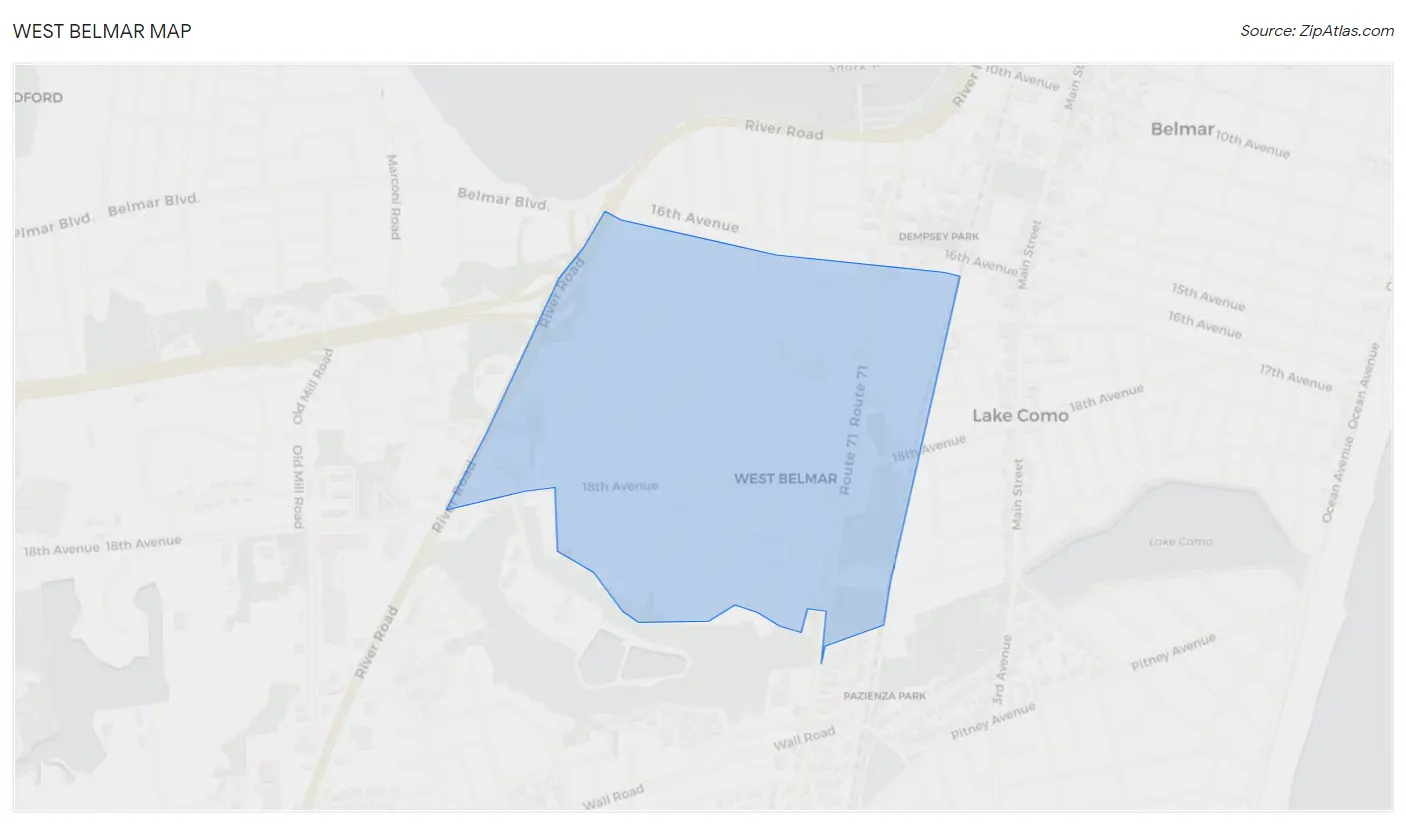
West Belmar Overview
$57,860
PER CAPITA INCOME
$130,125
AVG FAMILY INCOME
$108,667
AVG HOUSEHOLD INCOME
12.2%
WAGE / INCOME GAP [ % ]
87.8¢/ $1
WAGE / INCOME GAP [ $ ]
0.29
INEQUALITY / GINI INDEX
2,279
TOTAL POPULATION
1,058
MALE POPULATION
1,221
FEMALE POPULATION
86.65
MALES / 100 FEMALES
115.41
FEMALES / 100 MALES
50.0
MEDIAN AGE
2.7
AVG FAMILY SIZE
2.3
AVG HOUSEHOLD SIZE
1,315
LABOR FORCE [ PEOPLE ]
66.5%
PERCENT IN LABOR FORCE
3.9%
UNEMPLOYMENT RATE
Income in West Belmar
Income Overview in West Belmar
Per Capita Income in West Belmar is $57,860, while median incomes of families and households are $130,125 and $108,667 respectively.
| Characteristic | Number | Measure |
| Per Capita Income | 2,279 | $57,860 |
| Median Family Income | 735 | $130,125 |
| Mean Family Income | 735 | $141,708 |
| Median Household Income | 998 | $108,667 |
| Mean Household Income | 998 | $131,140 |
| Income Deficit | 735 | $0 |
| Wage / Income Gap (%) | 2,279 | 12.22% |
| Wage / Income Gap ($) | 2,279 | 87.78¢ per $1 |
| Gini / Inequality Index | 2,279 | 0.29 |
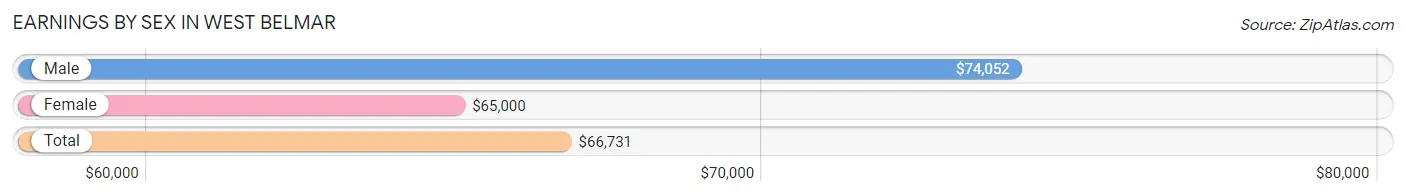
Earnings by Sex in West Belmar
Average Earnings in West Belmar are $66,731, $74,052 for men and $65,000 for women, a difference of 12.2%.
| Sex | Number | Average Earnings |
| Male | 644 (49.2%) | $74,052 |
| Female | 666 (50.8%) | $65,000 |
| Total | 1,310 (100.0%) | $66,731 |
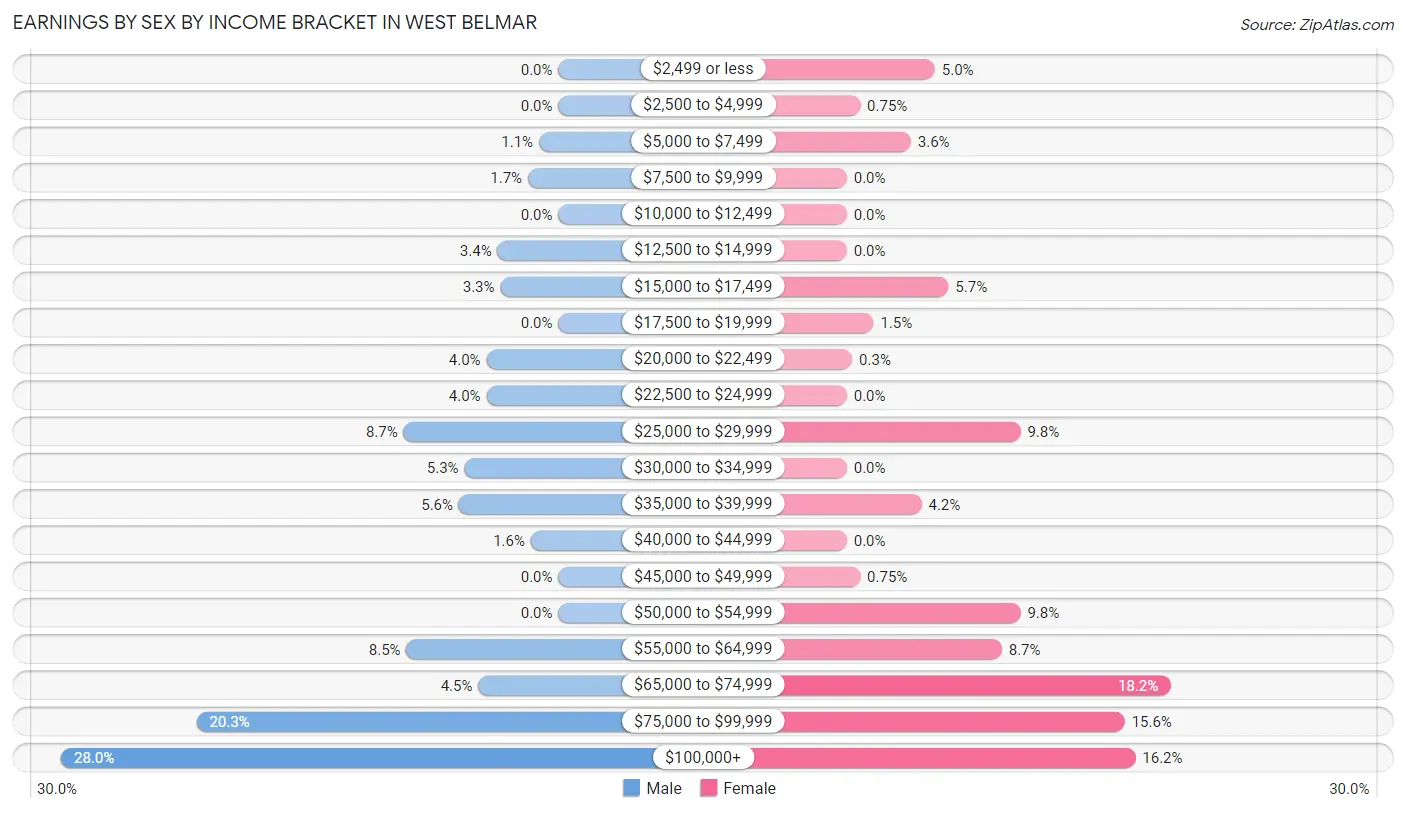
Earnings by Sex by Income Bracket in West Belmar
The most common earnings brackets in West Belmar are $100,000+ for men (180 | 28.0%) and $65,000 to $74,999 for women (121 | 18.2%).
| Income | Male | Female |
| $2,499 or less | 0 (0.0%) | 33 (5.0%) |
| $2,500 to $4,999 | 0 (0.0%) | 5 (0.7%) |
| $5,000 to $7,499 | 7 (1.1%) | 24 (3.6%) |
| $7,500 to $9,999 | 11 (1.7%) | 0 (0.0%) |
| $10,000 to $12,499 | 0 (0.0%) | 0 (0.0%) |
| $12,500 to $14,999 | 22 (3.4%) | 0 (0.0%) |
| $15,000 to $17,499 | 21 (3.3%) | 38 (5.7%) |
| $17,500 to $19,999 | 0 (0.0%) | 10 (1.5%) |
| $20,000 to $22,499 | 26 (4.0%) | 2 (0.3%) |
| $22,500 to $24,999 | 26 (4.0%) | 0 (0.0%) |
| $25,000 to $29,999 | 56 (8.7%) | 65 (9.8%) |
| $30,000 to $34,999 | 34 (5.3%) | 0 (0.0%) |
| $35,000 to $39,999 | 36 (5.6%) | 28 (4.2%) |
| $40,000 to $44,999 | 10 (1.5%) | 0 (0.0%) |
| $45,000 to $49,999 | 0 (0.0%) | 5 (0.7%) |
| $50,000 to $54,999 | 0 (0.0%) | 65 (9.8%) |
| $55,000 to $64,999 | 55 (8.5%) | 58 (8.7%) |
| $65,000 to $74,999 | 29 (4.5%) | 121 (18.2%) |
| $75,000 to $99,999 | 131 (20.3%) | 104 (15.6%) |
| $100,000+ | 180 (28.0%) | 108 (16.2%) |
| Total | 644 (100.0%) | 666 (100.0%) |
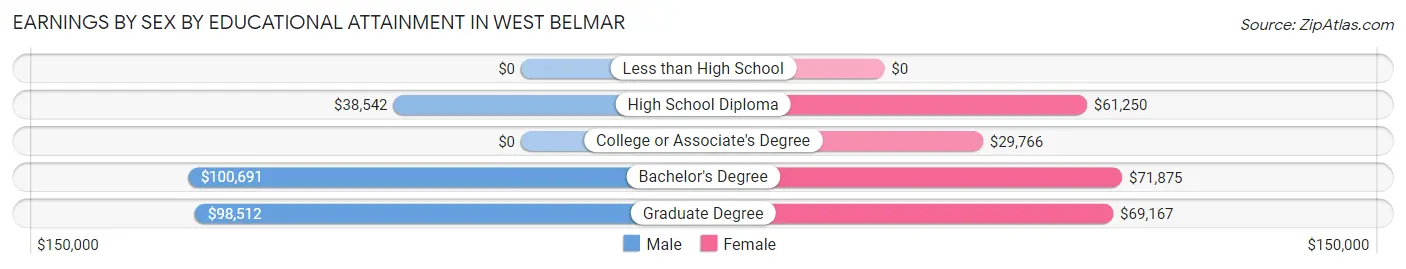
Earnings by Sex by Educational Attainment in West Belmar
Average earnings in West Belmar are $78,224 for men and $66,587 for women, a difference of 14.9%. Men with an educational attainment of bachelor's degree enjoy the highest average annual earnings of $100,691, while those with high school diploma education earn the least with $38,542. Women with an educational attainment of bachelor's degree earn the most with the average annual earnings of $71,875, while those with college or associate's degree education have the smallest earnings of $29,766.
| Educational Attainment | Male Income | Female Income |
| Less than High School | - | - |
| High School Diploma | $38,542 | $61,250 |
| College or Associate's Degree | - | - |
| Bachelor's Degree | $100,691 | $71,875 |
| Graduate Degree | $98,512 | $69,167 |
| Total | $78,224 | $66,587 |
Family Income in West Belmar
Family Income Brackets in West Belmar
According to the West Belmar family income data, there are 292 families falling into the $100,000 to $149,999 income range, which is the most common income bracket and makes up 39.7% of all families.
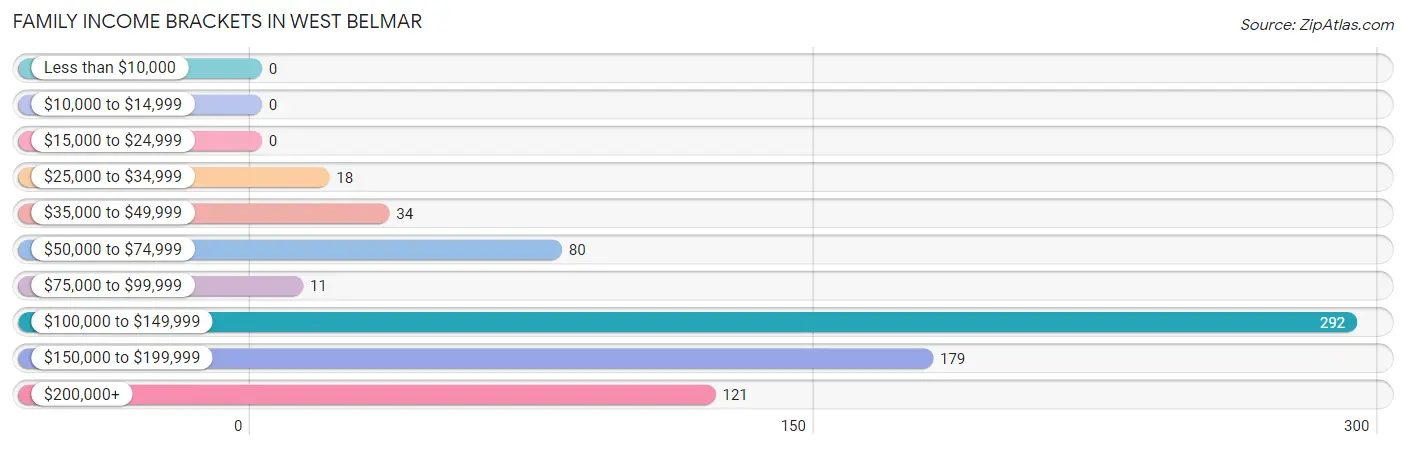
| Income Bracket | # Families | % Families |
| Less than $10,000 | 0 | 0.0% |
| $10,000 to $14,999 | 0 | 0.0% |
| $15,000 to $24,999 | 0 | 0.0% |
| $25,000 to $34,999 | 18 | 2.4% |
| $35,000 to $49,999 | 34 | 4.6% |
| $50,000 to $74,999 | 80 | 10.9% |
| $75,000 to $99,999 | 11 | 1.5% |
| $100,000 to $149,999 | 292 | 39.7% |
| $150,000 to $199,999 | 179 | 24.4% |
| $200,000+ | 121 | 16.5% |
Family Income by Famaliy Size in West Belmar
3-person families (31 | 4.2%) account for the highest median family income in West Belmar with $225,078 per family, while 3-person families (31 | 4.2%) have the highest median income of $75,026 per family member.
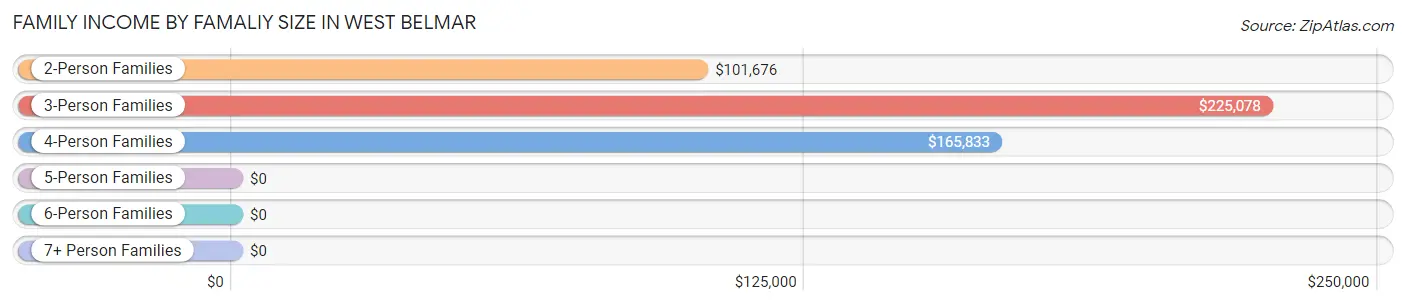
| Income Bracket | # Families | Median Income |
| 2-Person Families | 508 (69.1%) | $101,676 |
| 3-Person Families | 31 (4.2%) | $225,078 |
| 4-Person Families | 176 (23.9%) | $165,833 |
| 5-Person Families | 20 (2.7%) | $0 |
| 6-Person Families | 0 (0.0%) | $0 |
| 7+ Person Families | 0 (0.0%) | $0 |
| Total | 735 (100.0%) | $130,125 |
Family Income by Number of Earners in West Belmar
The median family income in West Belmar is $130,125, with families comprising 3+ earners (80) having the highest median family income of $250,001, while families with 1 earner (76) have the lowest median family income of $72,105, accounting for 10.9% and 10.3% of families, respectively.
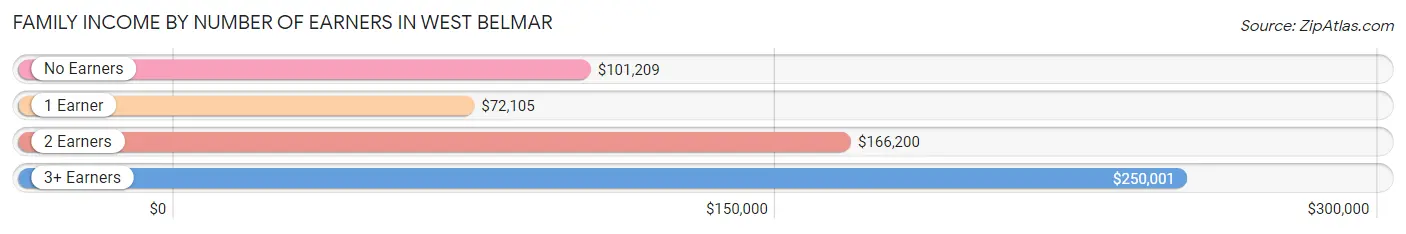
| Number of Earners | # Families | Median Income |
| No Earners | 233 (31.7%) | $101,209 |
| 1 Earner | 76 (10.3%) | $72,105 |
| 2 Earners | 346 (47.1%) | $166,200 |
| 3+ Earners | 80 (10.9%) | $250,001 |
| Total | 735 (100.0%) | $130,125 |
Household Income in West Belmar
Household Income Brackets in West Belmar
With 366 households falling in the category, the $100,000 to $149,999 income range is the most frequent in West Belmar, accounting for 36.7% of all households.
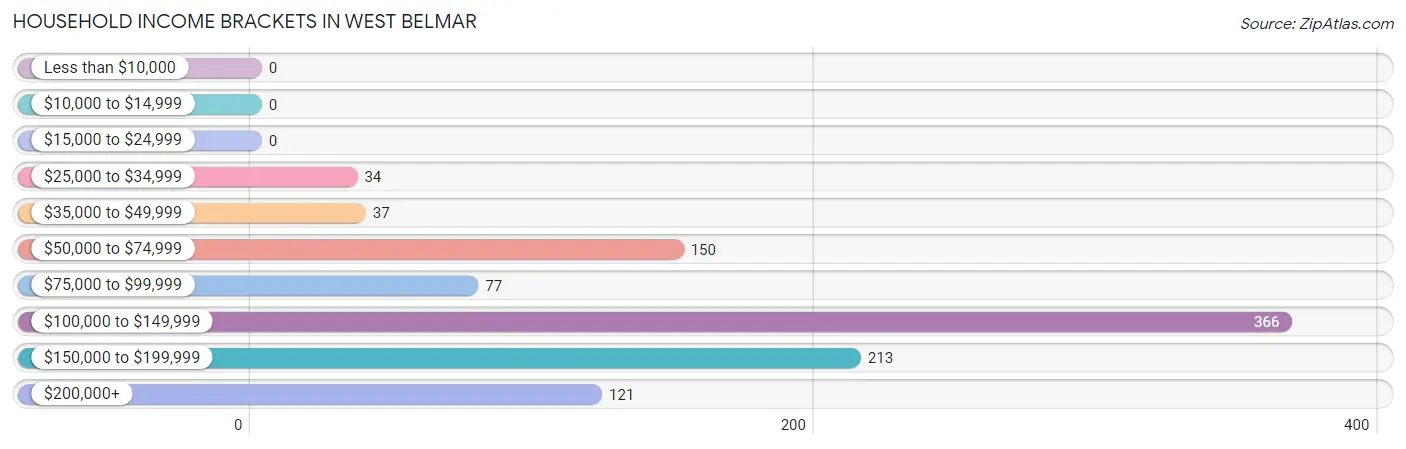
| Income Bracket | # Households | % Households |
| Less than $10,000 | 0 | 0.0% |
| $10,000 to $14,999 | 0 | 0.0% |
| $15,000 to $24,999 | 0 | 0.0% |
| $25,000 to $34,999 | 34 | 3.4% |
| $35,000 to $49,999 | 37 | 3.7% |
| $50,000 to $74,999 | 150 | 15.0% |
| $75,000 to $99,999 | 77 | 7.7% |
| $100,000 to $149,999 | 366 | 36.7% |
| $150,000 to $199,999 | 213 | 21.3% |
| $200,000+ | 121 | 12.1% |
Household Income by Householder Age in West Belmar
The median household income in West Belmar is $108,667, with the highest median household income of $160,114 found in the 25 to 44 years age bracket for the primary householder. A total of 309 households (31.0%) fall into this category.
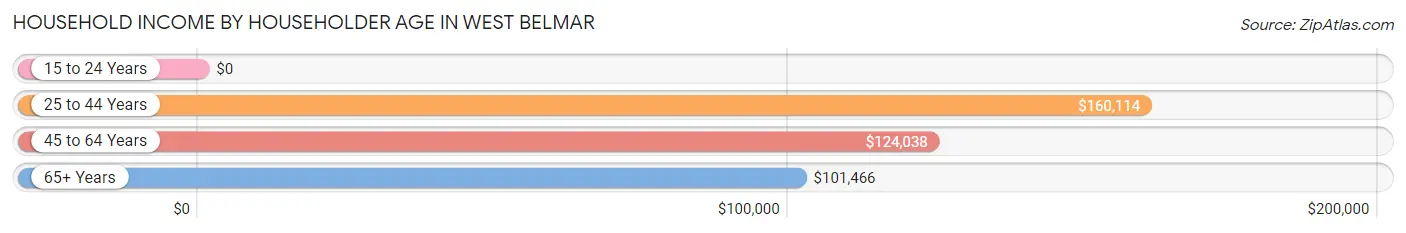
| Income Bracket | # Households | Median Income |
| 15 to 24 Years | 0 (0.0%) | $0 |
| 25 to 44 Years | 309 (31.0%) | $160,114 |
| 45 to 64 Years | 282 (28.3%) | $124,038 |
| 65+ Years | 407 (40.8%) | $101,466 |
| Total | 998 (100.0%) | $108,667 |
Poverty in West Belmar
Income Below Poverty by Sex and Age in West Belmar
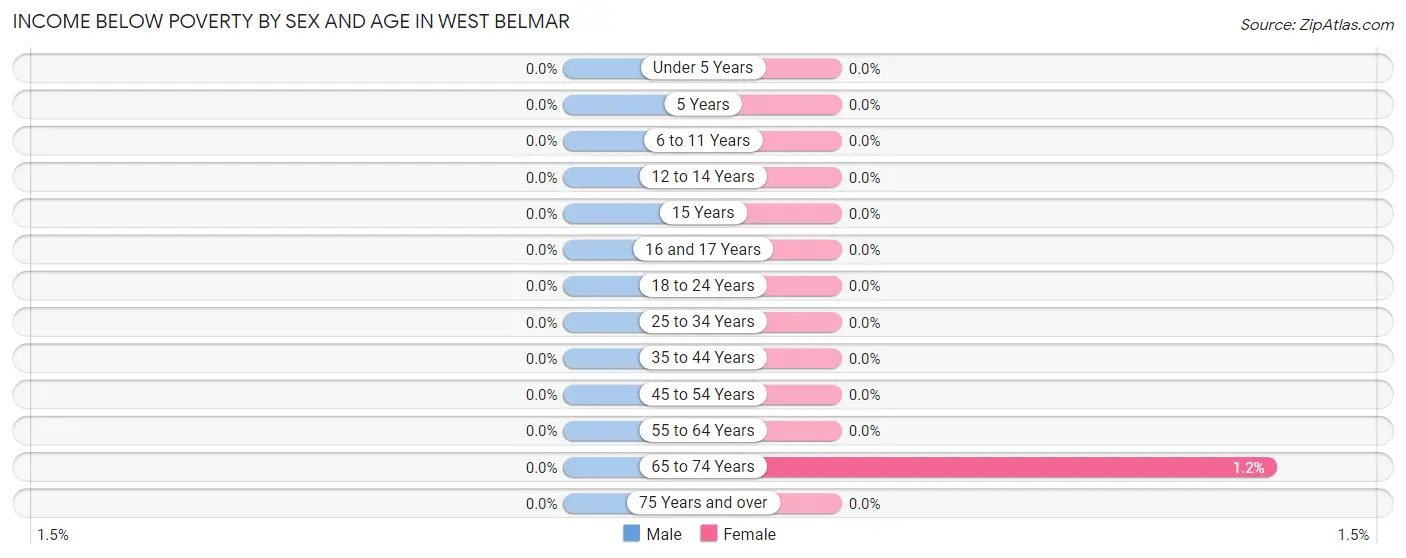
| Age Bracket | Male | Female |
| Under 5 Years | 0 (0.0%) | 0 (0.0%) |
| 5 Years | 0 (0.0%) | 0 (0.0%) |
| 6 to 11 Years | 0 (0.0%) | 0 (0.0%) |
| 12 to 14 Years | 0 (0.0%) | 0 (0.0%) |
| 15 Years | 0 (0.0%) | 0 (0.0%) |
| 16 and 17 Years | 0 (0.0%) | 0 (0.0%) |
| 18 to 24 Years | 0 (0.0%) | 0 (0.0%) |
| 25 to 34 Years | 0 (0.0%) | 0 (0.0%) |
| 35 to 44 Years | 0 (0.0%) | 0 (0.0%) |
| 45 to 54 Years | 0 (0.0%) | 0 (0.0%) |
| 55 to 64 Years | 0 (0.0%) | 0 (0.0%) |
| 65 to 74 Years | 0 (0.0%) | 4 (1.2%) |
| 75 Years and over | 0 (0.0%) | 0 (0.0%) |
| Total | 0 (0.0%) | 4 (0.3%) |
Income Above Poverty by Sex and Age in West Belmar
According to the poverty statistics in West Belmar, males aged under 5 years and females aged under 5 years are the age groups that are most secure financially, with 100.0% of males and 100.0% of females in these age groups living above the poverty line.
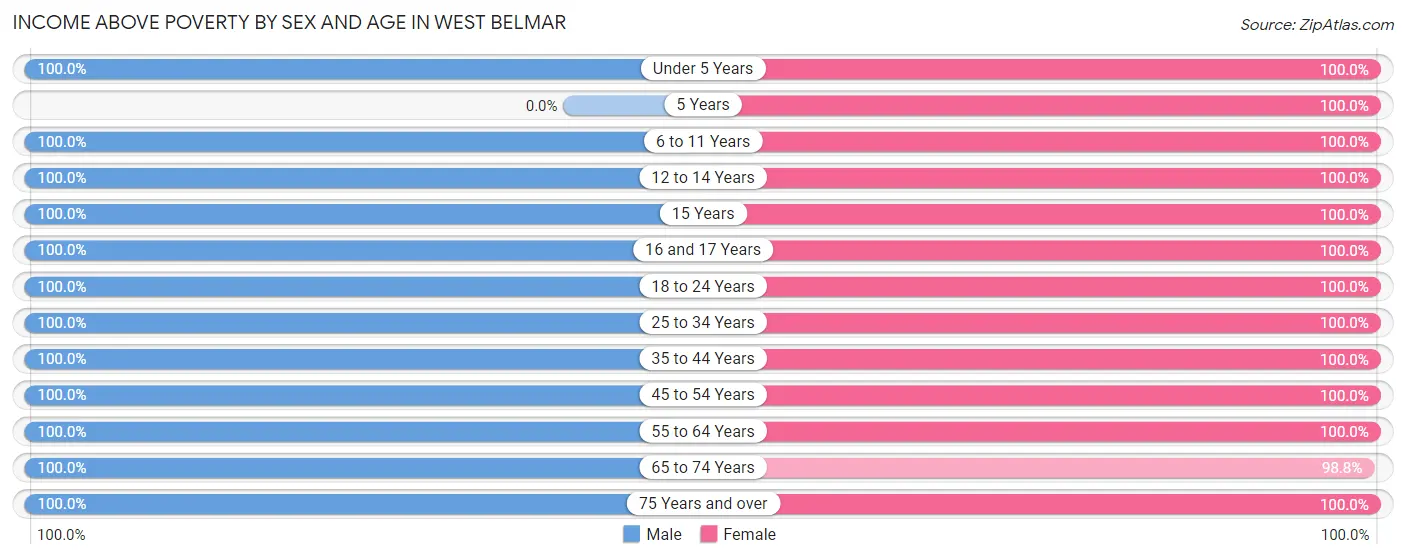
| Age Bracket | Male | Female |
| Under 5 Years | 41 (100.0%) | 63 (100.0%) |
| 5 Years | 0 (0.0%) | 15 (100.0%) |
| 6 to 11 Years | 32 (100.0%) | 60 (100.0%) |
| 12 to 14 Years | 20 (100.0%) | 13 (100.0%) |
| 15 Years | 22 (100.0%) | 36 (100.0%) |
| 16 and 17 Years | 12 (100.0%) | 20 (100.0%) |
| 18 to 24 Years | 45 (100.0%) | 70 (100.0%) |
| 25 to 34 Years | 169 (100.0%) | 123 (100.0%) |
| 35 to 44 Years | 151 (100.0%) | 161 (100.0%) |
| 45 to 54 Years | 86 (100.0%) | 147 (100.0%) |
| 55 to 64 Years | 128 (100.0%) | 157 (100.0%) |
| 65 to 74 Years | 333 (100.0%) | 327 (98.8%) |
| 75 Years and over | 19 (100.0%) | 25 (100.0%) |
| Total | 1,058 (100.0%) | 1,217 (99.7%) |
Income Below Poverty Among Married-Couple Families in West Belmar
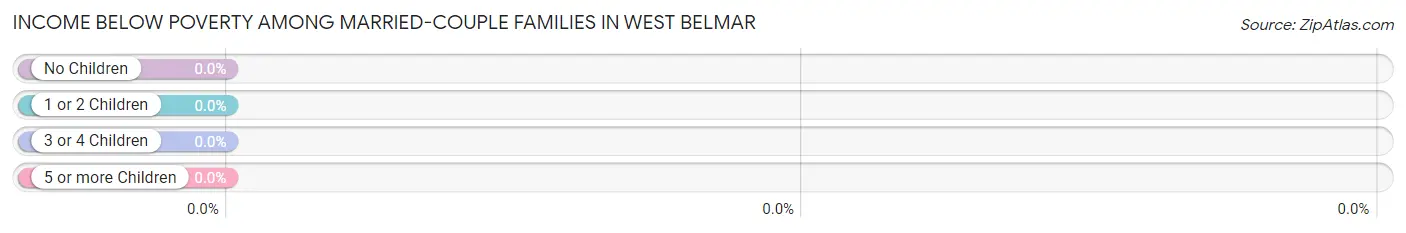
| Children | Above Poverty | Below Poverty |
| No Children | 519 (100.0%) | 0 (0.0%) |
| 1 or 2 Children | 131 (100.0%) | 0 (0.0%) |
| 3 or 4 Children | 20 (100.0%) | 0 (0.0%) |
| 5 or more Children | 0 (0.0%) | 0 (0.0%) |
| Total | 670 (100.0%) | 0 (0.0%) |
Income Below Poverty Among Single-Parent Households in West Belmar
| Children | Single Father | Single Mother |
| No Children | 0 (0.0%) | 0 (0.0%) |
| 1 or 2 Children | 0 (0.0%) | 0 (0.0%) |
| 3 or 4 Children | 0 (0.0%) | 0 (0.0%) |
| 5 or more Children | 0 (0.0%) | 0 (0.0%) |
| Total | 0 (0.0%) | 0 (0.0%) |
Income Below Poverty Among Married-Couple vs Single-Parent Households in West Belmar
| Children | Married-Couple Families | Single-Parent Households |
| No Children | 0 (0.0%) | 0 (0.0%) |
| 1 or 2 Children | 0 (0.0%) | 0 (0.0%) |
| 3 or 4 Children | 0 (0.0%) | 0 (0.0%) |
| 5 or more Children | 0 (0.0%) | 0 (0.0%) |
| Total | 0 (0.0%) | 0 (0.0%) |
Race in West Belmar
The most populous races in West Belmar are White / Caucasian (2,220 | 97.4%), Hispanic or Latino (86 | 3.8%), and Some other Race (45 | 2.0%).
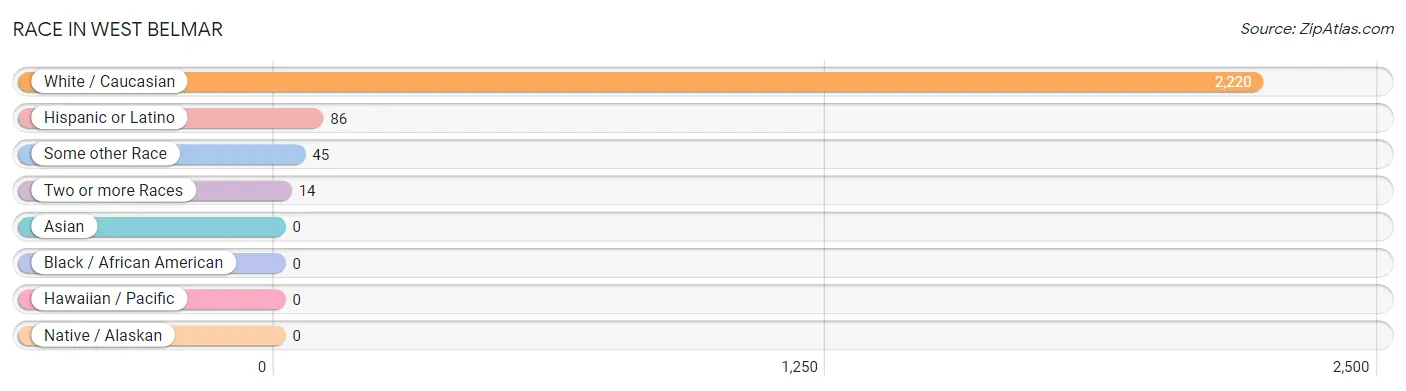
| Race | # Population | % Population |
| Asian | 0 | 0.0% |
| Black / African American | 0 | 0.0% |
| Hawaiian / Pacific | 0 | 0.0% |
| Hispanic or Latino | 86 | 3.8% |
| Native / Alaskan | 0 | 0.0% |
| White / Caucasian | 2,220 | 97.4% |
| Two or more Races | 14 | 0.6% |
| Some other Race | 45 | 2.0% |
| Total | 2,279 | 100.0% |
Ancestry in West Belmar
The most populous ancestries reported in West Belmar are English (651 | 28.6%), Irish (593 | 26.0%), Italian (529 | 23.2%), German (458 | 20.1%), and Greek (159 | 7.0%), together accounting for 104.9% of all West Belmar residents.
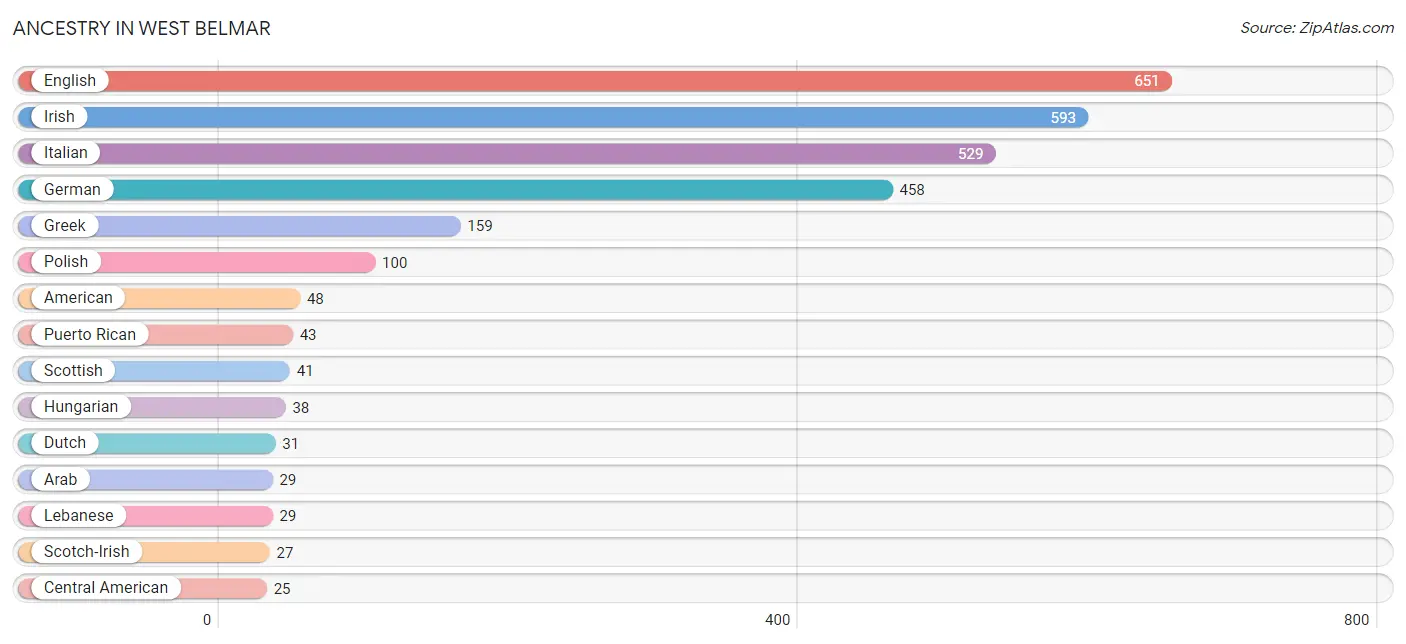
| Ancestry | # Population | % Population |
| American | 48 | 2.1% |
| Arab | 29 | 1.3% |
| Armenian | 6 | 0.3% |
| Central American | 25 | 1.1% |
| Chilean | 12 | 0.5% |
| Dutch | 31 | 1.4% |
| Eastern European | 21 | 0.9% |
| English | 651 | 28.6% |
| European | 10 | 0.4% |
| French | 22 | 1.0% |
| German | 458 | 20.1% |
| Greek | 159 | 7.0% |
| Honduran | 25 | 1.1% |
| Hungarian | 38 | 1.7% |
| Irish | 593 | 26.0% |
| Italian | 529 | 23.2% |
| Lebanese | 29 | 1.3% |
| Lithuanian | 17 | 0.7% |
| Mexican | 6 | 0.3% |
| Polish | 100 | 4.4% |
| Puerto Rican | 43 | 1.9% |
| Russian | 13 | 0.6% |
| Scotch-Irish | 27 | 1.2% |
| Scottish | 41 | 1.8% |
| Slovak | 10 | 0.4% |
| South American | 12 | 0.5% |
| Ukrainian | 20 | 0.9% |
| Welsh | 10 | 0.4% | View All 28 Rows |
Immigrants in West Belmar
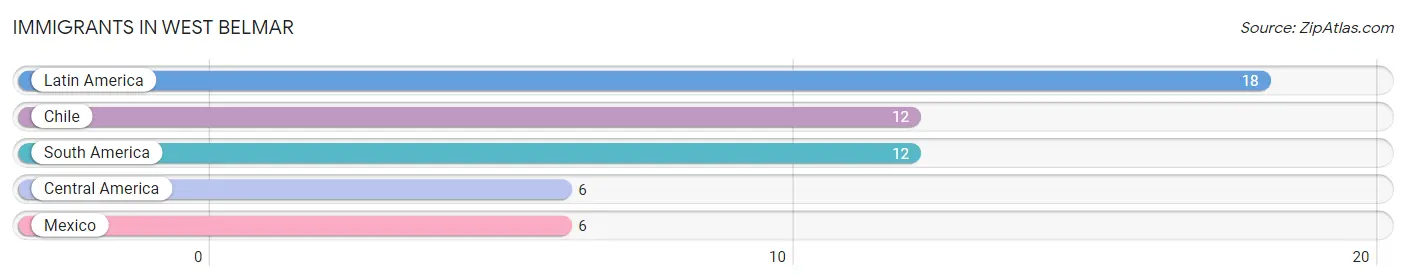
The most numerous immigrant groups reported in West Belmar came from Latin America (18 | 0.8%), Chile (12 | 0.5%), South America (12 | 0.5%), Central America (6 | 0.3%), and Mexico (6 | 0.3%), together accounting for 2.4% of all West Belmar residents.
| Immigration Origin | # Population | % Population |
| Central America | 6 | 0.3% |
| Chile | 12 | 0.5% |
| Latin America | 18 | 0.8% |
| Mexico | 6 | 0.3% |
| South America | 12 | 0.5% | View All 5 Rows |
Sex and Age in West Belmar
Sex and Age in West Belmar
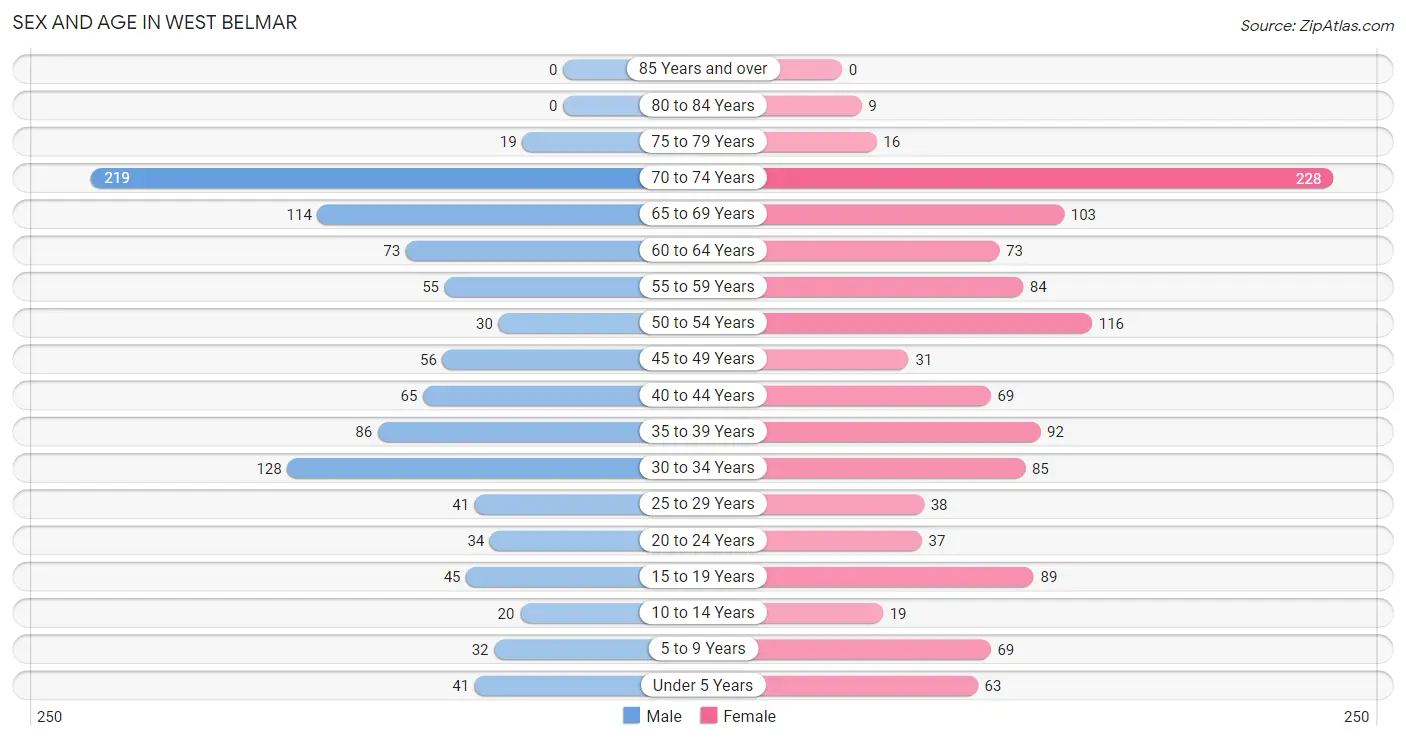
The most populous age groups in West Belmar are 70 to 74 Years (219 | 20.7%) for men and 70 to 74 Years (228 | 18.7%) for women.
| Age Bracket | Male | Female |
| Under 5 Years | 41 (3.9%) | 63 (5.2%) |
| 5 to 9 Years | 32 (3.0%) | 69 (5.7%) |
| 10 to 14 Years | 20 (1.9%) | 19 (1.6%) |
| 15 to 19 Years | 45 (4.3%) | 89 (7.3%) |
| 20 to 24 Years | 34 (3.2%) | 37 (3.0%) |
| 25 to 29 Years | 41 (3.9%) | 38 (3.1%) |
| 30 to 34 Years | 128 (12.1%) | 85 (7.0%) |
| 35 to 39 Years | 86 (8.1%) | 92 (7.5%) |
| 40 to 44 Years | 65 (6.1%) | 69 (5.7%) |
| 45 to 49 Years | 56 (5.3%) | 31 (2.5%) |
| 50 to 54 Years | 30 (2.8%) | 116 (9.5%) |
| 55 to 59 Years | 55 (5.2%) | 84 (6.9%) |
| 60 to 64 Years | 73 (6.9%) | 73 (6.0%) |
| 65 to 69 Years | 114 (10.8%) | 103 (8.4%) |
| 70 to 74 Years | 219 (20.7%) | 228 (18.7%) |
| 75 to 79 Years | 19 (1.8%) | 16 (1.3%) |
| 80 to 84 Years | 0 (0.0%) | 9 (0.7%) |
| 85 Years and over | 0 (0.0%) | 0 (0.0%) |
| Total | 1,058 (100.0%) | 1,221 (100.0%) |
Families and Households in West Belmar
Median Family Size in West Belmar
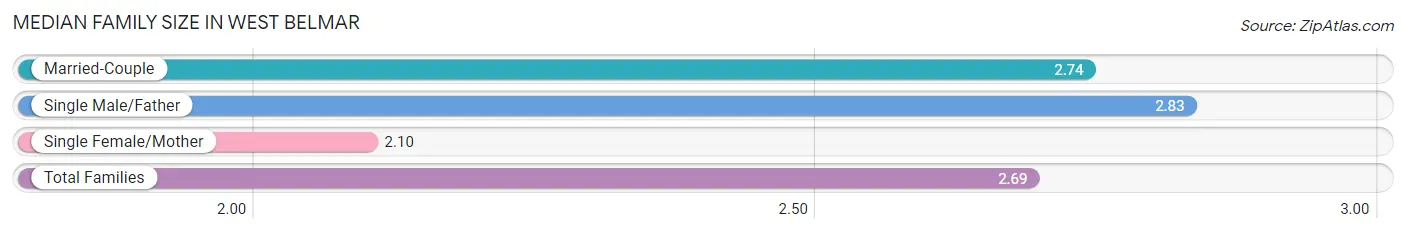
The median family size in West Belmar is 2.69 persons per family, with single male/father families (6 | 0.8%) accounting for the largest median family size of 2.83 persons per family. On the other hand, single female/mother families (59 | 8.0%) represent the smallest median family size with 2.10 persons per family.
| Family Type | # Families | Family Size |
| Married-Couple | 670 (91.2%) | 2.74 |
| Single Male/Father | 6 (0.8%) | 2.83 |
| Single Female/Mother | 59 (8.0%) | 2.10 |
| Total Families | 735 (100.0%) | 2.69 |
Median Household Size in West Belmar
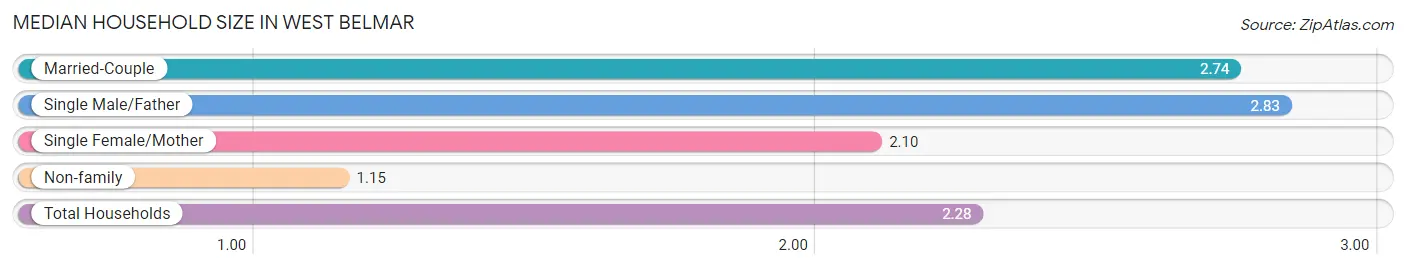
The median household size in West Belmar is 2.28 persons per household, with single male/father households (6 | 0.6%) accounting for the largest median household size of 2.83 persons per household. non-family households (263 | 26.4%) represent the smallest median household size with 1.15 persons per household.
| Household Type | # Households | Household Size |
| Married-Couple | 670 (67.1%) | 2.74 |
| Single Male/Father | 6 (0.6%) | 2.83 |
| Single Female/Mother | 59 (5.9%) | 2.10 |
| Non-family | 263 (26.4%) | 1.15 |
| Total Households | 998 (100.0%) | 2.28 |
Household Size by Marriage Status in West Belmar
Out of a total of 998 households in West Belmar, 735 (73.7%) are family households, while 263 (26.4%) are nonfamily households. The most numerous type of family households are 2-person households, comprising 508, and the most common type of nonfamily households are 1-person households, comprising 223.
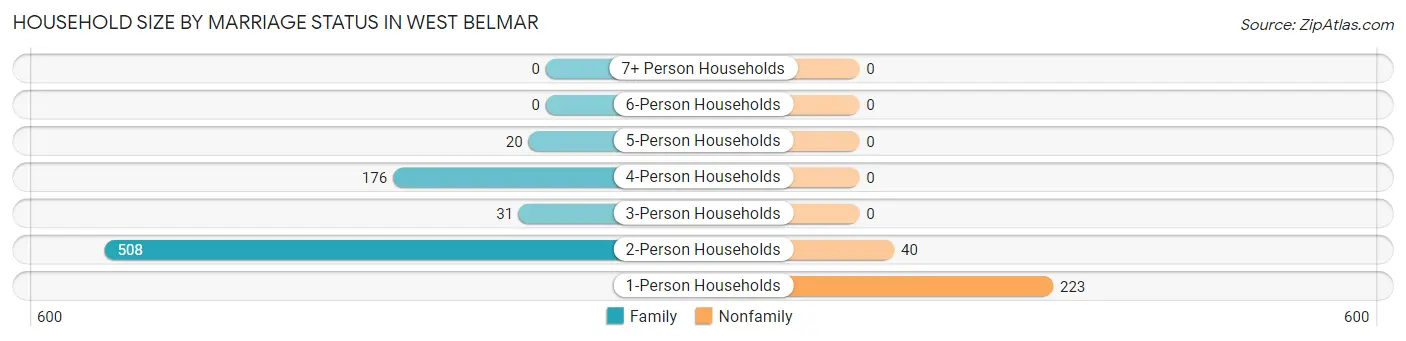
| Household Size | Family Households | Nonfamily Households |
| 1-Person Households | - | 223 (22.3%) |
| 2-Person Households | 508 (50.9%) | 40 (4.0%) |
| 3-Person Households | 31 (3.1%) | 0 (0.0%) |
| 4-Person Households | 176 (17.6%) | 0 (0.0%) |
| 5-Person Households | 20 (2.0%) | 0 (0.0%) |
| 6-Person Households | 0 (0.0%) | 0 (0.0%) |
| 7+ Person Households | 0 (0.0%) | 0 (0.0%) |
| Total | 735 (73.7%) | 263 (26.4%) |
Female Fertility in West Belmar
Fertility by Age in West Belmar
Average fertility rate in West Belmar is 56.0 births per 1,000 women. Women in the age bracket of 20 to 34 years have the highest fertility rate with 163.0 births per 1,000 women. Women in the age bracket of 20 to 34 years acount for 100.0% of all women with births.
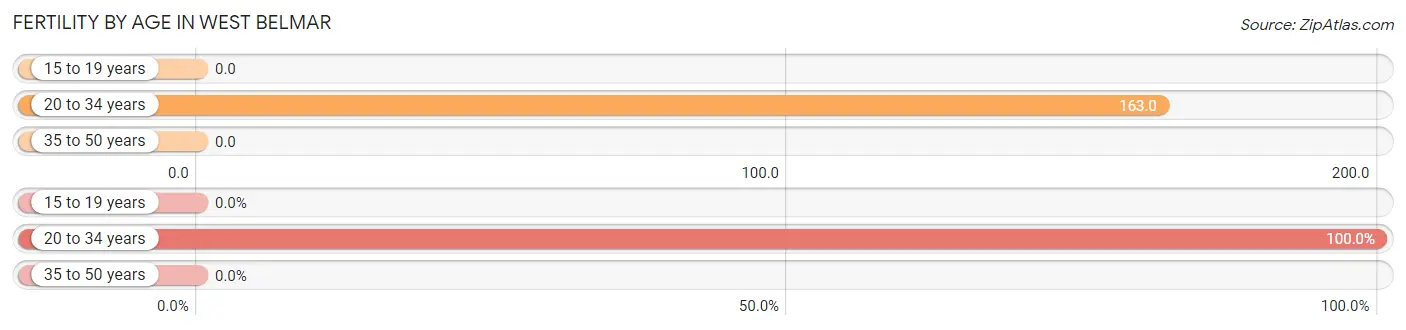
| Age Bracket | Women with Births | Births / 1,000 Women |
| 15 to 19 years | 0 (0.0%) | 0.0 |
| 20 to 34 years | 26 (100.0%) | 163.0 |
| 35 to 50 years | 0 (0.0%) | 0.0 |
| Total | 26 (100.0%) | 56.0 |
Fertility by Age by Marriage Status in West Belmar
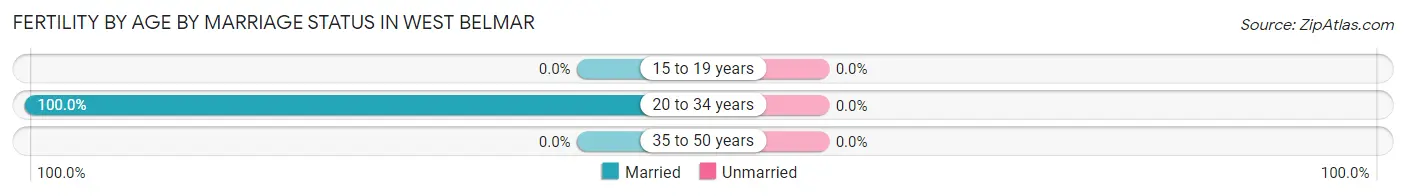
| Age Bracket | Married | Unmarried |
| 15 to 19 years | 0 (0.0%) | 0 (0.0%) |
| 20 to 34 years | 26 (100.0%) | 0 (0.0%) |
| 35 to 50 years | 0 (0.0%) | 0 (0.0%) |
| Total | 26 (100.0%) | 0 (0.0%) |
Fertility by Education in West Belmar
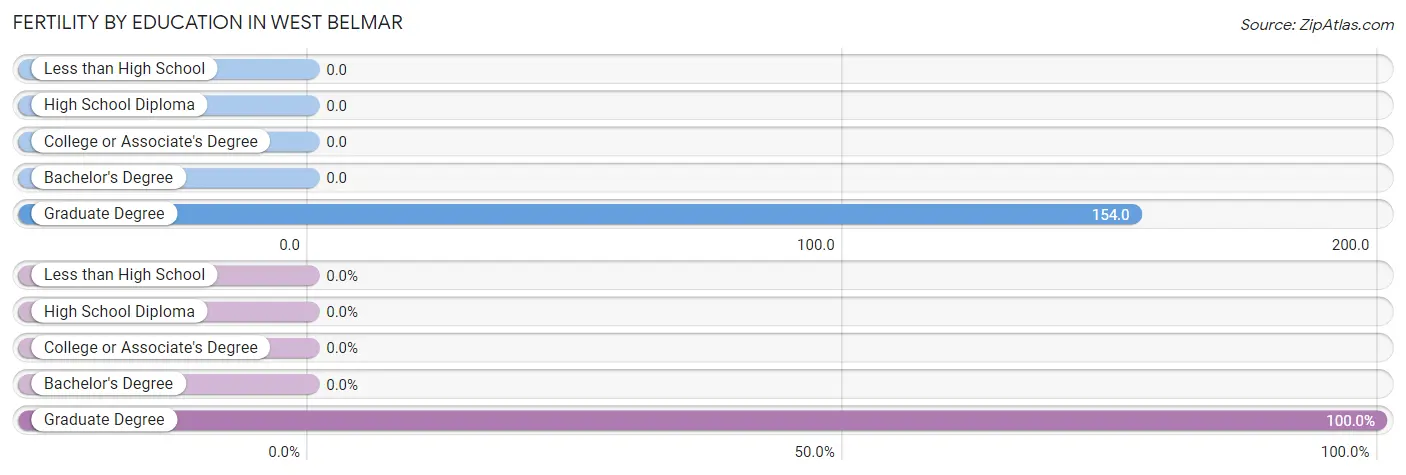
| Educational Attainment | Women with Births | Births / 1,000 Women |
| Less than High School | 0 (0.0%) | 0.0 |
| High School Diploma | 0 (0.0%) | 0.0 |
| College or Associate's Degree | 0 (0.0%) | 0.0 |
| Bachelor's Degree | 0 (0.0%) | 0.0 |
| Graduate Degree | 26 (100.0%) | 154.0 |
| Total | 26 (100.0%) | 56.0 |
Fertility by Education by Marriage Status in West Belmar
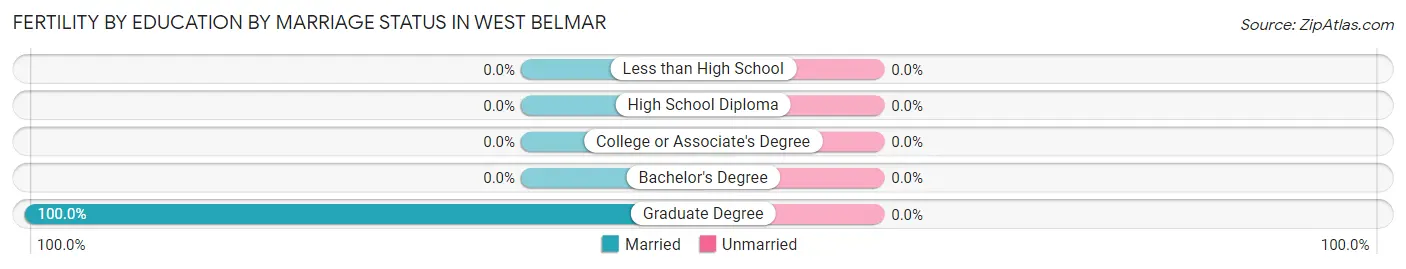
| Educational Attainment | Married | Unmarried |
| Less than High School | 0 (0.0%) | 0 (0.0%) |
| High School Diploma | 0 (0.0%) | 0 (0.0%) |
| College or Associate's Degree | 0 (0.0%) | 0 (0.0%) |
| Bachelor's Degree | 0 (0.0%) | 0 (0.0%) |
| Graduate Degree | 26 (100.0%) | 0 (0.0%) |
| Total | 26 (100.0%) | 0 (0.0%) |
Employment Characteristics in West Belmar
Employment by Class of Employer in West Belmar
Among the 1,230 employed individuals in West Belmar, private company employees (721 | 58.6%), local government employees (233 | 18.9%), and self-employed (incorporated) (95 | 7.7%) make up the most common classes of employment.
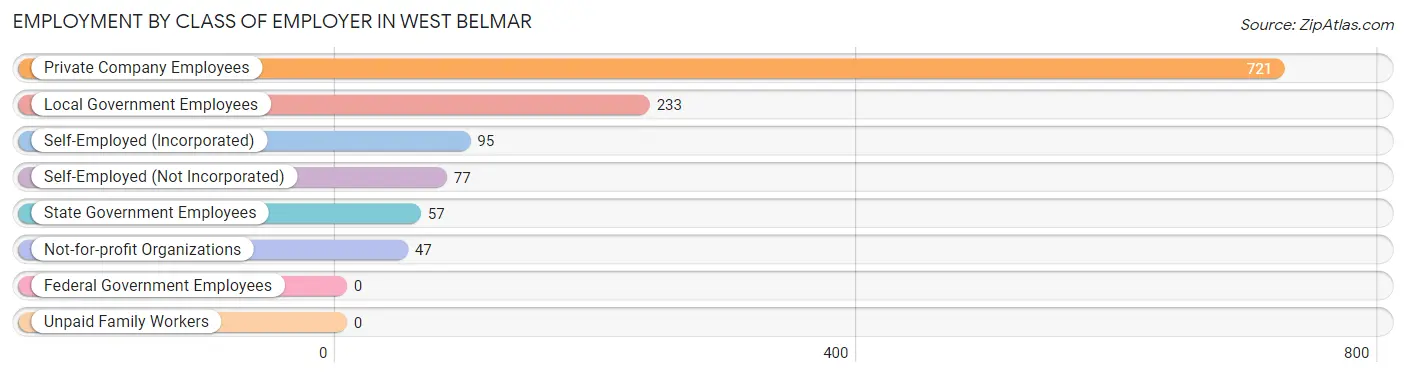
| Employer Class | # Employees | % Employees |
| Private Company Employees | 721 | 58.6% |
| Self-Employed (Incorporated) | 95 | 7.7% |
| Self-Employed (Not Incorporated) | 77 | 6.3% |
| Not-for-profit Organizations | 47 | 3.8% |
| Local Government Employees | 233 | 18.9% |
| State Government Employees | 57 | 4.6% |
| Federal Government Employees | 0 | 0.0% |
| Unpaid Family Workers | 0 | 0.0% |
| Total | 1,230 | 100.0% |
Employment Status by Age in West Belmar
According to the labor force statistics for West Belmar, out of the total population over 16 years of age (1,977), 66.5% or 1,315 individuals are in the labor force, with 3.9% or 51 of them unemployed. The age group with the highest labor force participation rate is 25 to 29 years, with 100.0% or 79 individuals in the labor force. Within the labor force, the 20 to 24 years age range has the highest percentage of unemployed individuals, with 100.0% or 37 of them being unemployed.
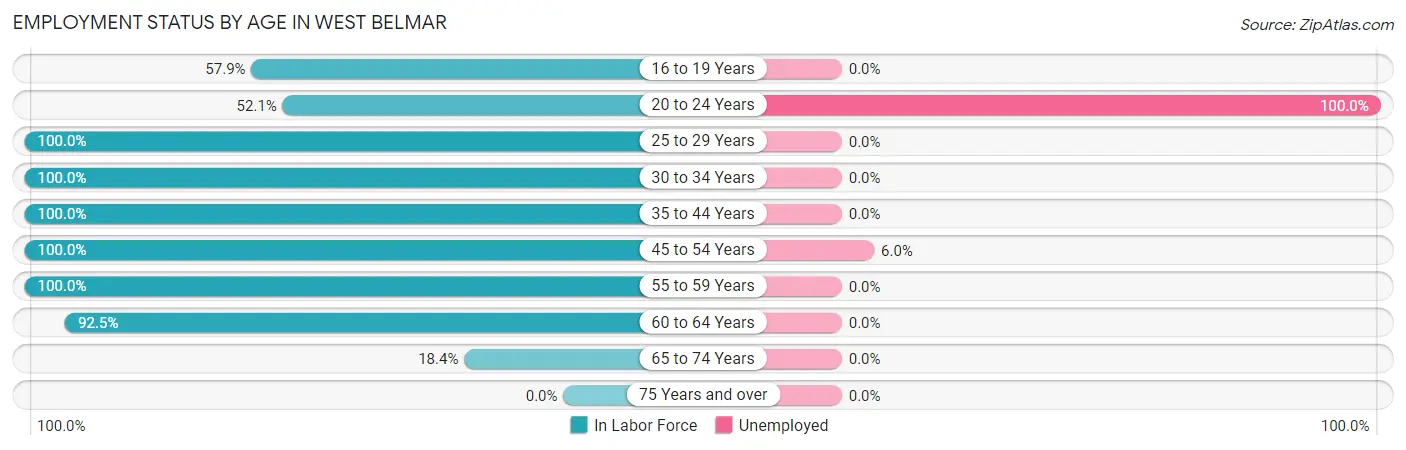
| Age Bracket | In Labor Force | Unemployed |
| 16 to 19 Years | 44 (57.9%) | 0 (0.0%) |
| 20 to 24 Years | 37 (52.1%) | 37 (100.0%) |
| 25 to 29 Years | 79 (100.0%) | 0 (0.0%) |
| 30 to 34 Years | 213 (100.0%) | 0 (0.0%) |
| 35 to 44 Years | 312 (100.0%) | 0 (0.0%) |
| 45 to 54 Years | 233 (100.0%) | 14 (6.0%) |
| 55 to 59 Years | 139 (100.0%) | 0 (0.0%) |
| 60 to 64 Years | 135 (92.5%) | 0 (0.0%) |
| 65 to 74 Years | 122 (18.4%) | 0 (0.0%) |
| 75 Years and over | 0 (0.0%) | 0 (0.0%) |
| Total | 1,315 (66.5%) | 51 (3.9%) |
Employment Status by Educational Attainment in West Belmar
According to labor force statistics for West Belmar, 99.0% of individuals (1,111) out of the total population between 25 and 64 years of age (1,122) are in the labor force, with 1.3% or 14 of them being unemployed. The group with the highest labor force participation rate are those with the educational attainment of high school diploma, with 100.0% or 142 individuals in the labor force. Within the labor force, individuals with high school diploma education have the highest percentage of unemployment, with 3.5% or 5 of them being unemployed.
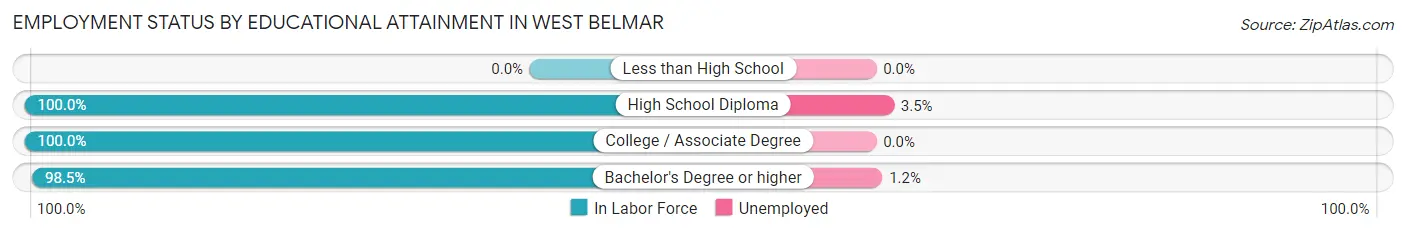
| Educational Attainment | In Labor Force | Unemployed |
| Less than High School | 0 (0.0%) | 0 (0.0%) |
| High School Diploma | 142 (100.0%) | 5 (3.5%) |
| College / Associate Degree | 239 (100.0%) | 0 (0.0%) |
| Bachelor's Degree or higher | 730 (98.5%) | 9 (1.2%) |
| Total | 1,111 (99.0%) | 15 (1.3%) |
Employment Occupations by Sex in West Belmar
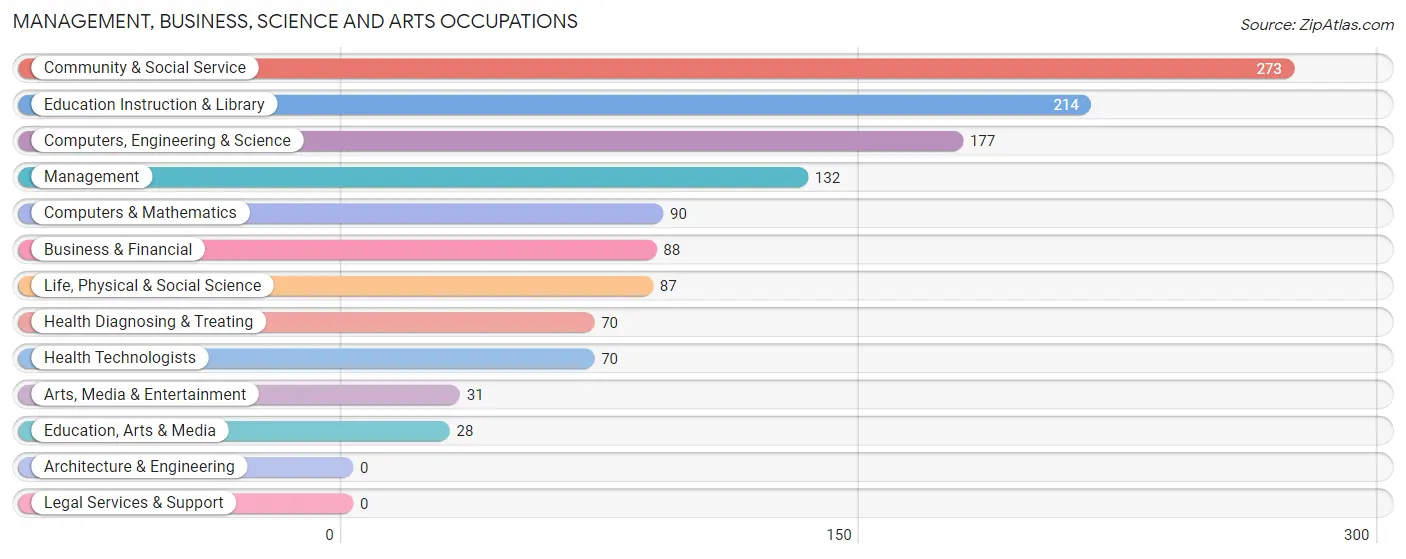
Management, Business, Science and Arts Occupations
The most common Management, Business, Science and Arts occupations in West Belmar are Community & Social Service (273 | 21.6%), Education Instruction & Library (214 | 16.9%), Computers, Engineering & Science (177 | 14.0%), Management (132 | 10.4%), and Computers & Mathematics (90 | 7.1%).
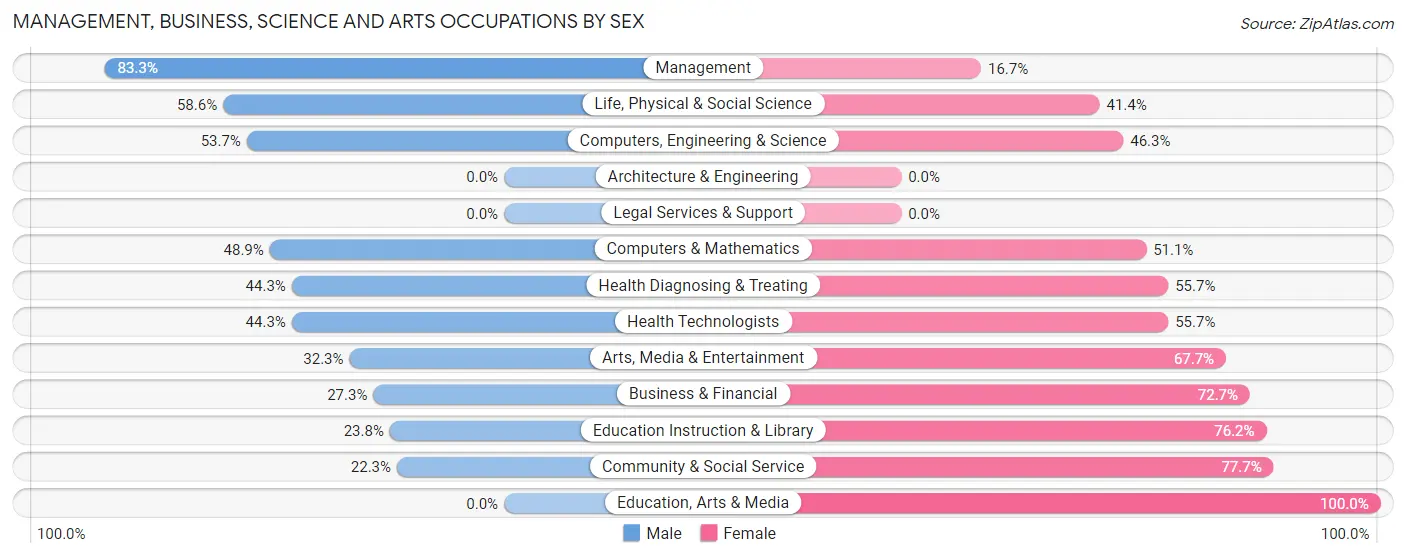
Management, Business, Science and Arts Occupations by Sex
Within the Management, Business, Science and Arts occupations in West Belmar, the most male-oriented occupations are Management (83.3%), Life, Physical & Social Science (58.6%), and Computers, Engineering & Science (53.7%), while the most female-oriented occupations are Education, Arts & Media (100.0%), Community & Social Service (77.7%), and Education Instruction & Library (76.2%).
| Occupation | Male | Female |
| Management | 110 (83.3%) | 22 (16.7%) |
| Business & Financial | 24 (27.3%) | 64 (72.7%) |
| Computers, Engineering & Science | 95 (53.7%) | 82 (46.3%) |
| Computers & Mathematics | 44 (48.9%) | 46 (51.1%) |
| Architecture & Engineering | 0 (0.0%) | 0 (0.0%) |
| Life, Physical & Social Science | 51 (58.6%) | 36 (41.4%) |
| Community & Social Service | 61 (22.3%) | 212 (77.7%) |
| Education, Arts & Media | 0 (0.0%) | 28 (100.0%) |
| Legal Services & Support | 0 (0.0%) | 0 (0.0%) |
| Education Instruction & Library | 51 (23.8%) | 163 (76.2%) |
| Arts, Media & Entertainment | 10 (32.3%) | 21 (67.7%) |
| Health Diagnosing & Treating | 31 (44.3%) | 39 (55.7%) |
| Health Technologists | 31 (44.3%) | 39 (55.7%) |
| Total (Category) | 321 (43.4%) | 419 (56.6%) |
| Total (Overall) | 612 (48.5%) | 651 (51.5%) |
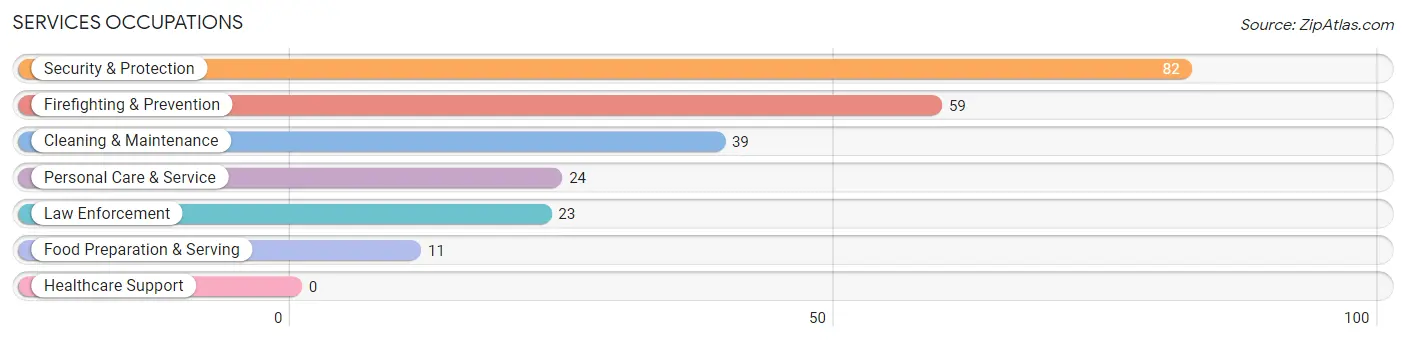
Services Occupations
The most common Services occupations in West Belmar are Security & Protection (82 | 6.5%), Firefighting & Prevention (59 | 4.7%), Cleaning & Maintenance (39 | 3.1%), Personal Care & Service (24 | 1.9%), and Law Enforcement (23 | 1.8%).
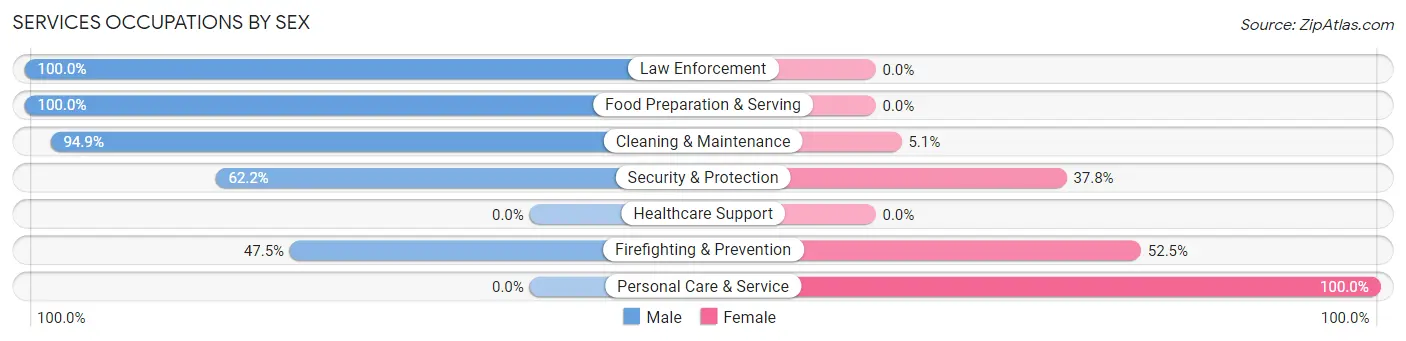
Services Occupations by Sex
Within the Services occupations in West Belmar, the most male-oriented occupations are Law Enforcement (100.0%), Food Preparation & Serving (100.0%), and Cleaning & Maintenance (94.9%), while the most female-oriented occupations are Personal Care & Service (100.0%), Firefighting & Prevention (52.5%), and Security & Protection (37.8%).
| Occupation | Male | Female |
| Healthcare Support | 0 (0.0%) | 0 (0.0%) |
| Security & Protection | 51 (62.2%) | 31 (37.8%) |
| Firefighting & Prevention | 28 (47.5%) | 31 (52.5%) |
| Law Enforcement | 23 (100.0%) | 0 (0.0%) |
| Food Preparation & Serving | 11 (100.0%) | 0 (0.0%) |
| Cleaning & Maintenance | 37 (94.9%) | 2 (5.1%) |
| Personal Care & Service | 0 (0.0%) | 24 (100.0%) |
| Total (Category) | 99 (63.5%) | 57 (36.5%) |
| Total (Overall) | 612 (48.5%) | 651 (51.5%) |
Sales and Office Occupations
The most common Sales and Office occupations in West Belmar are Sales & Related (102 | 8.1%), and Office & Administration (102 | 8.1%).
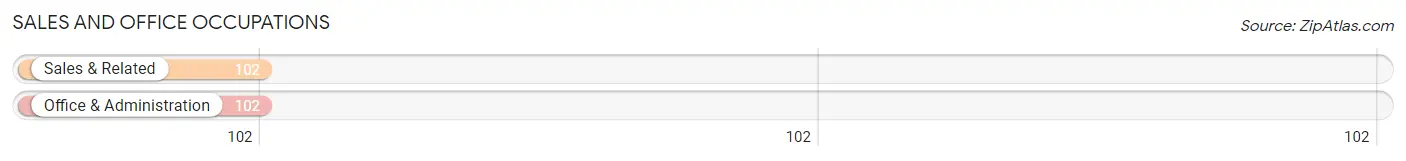
Sales and Office Occupations by Sex

| Occupation | Male | Female |
| Sales & Related | 41 (40.2%) | 61 (59.8%) |
| Office & Administration | 0 (0.0%) | 102 (100.0%) |
| Total (Category) | 41 (20.1%) | 163 (79.9%) |
| Total (Overall) | 612 (48.5%) | 651 (51.5%) |
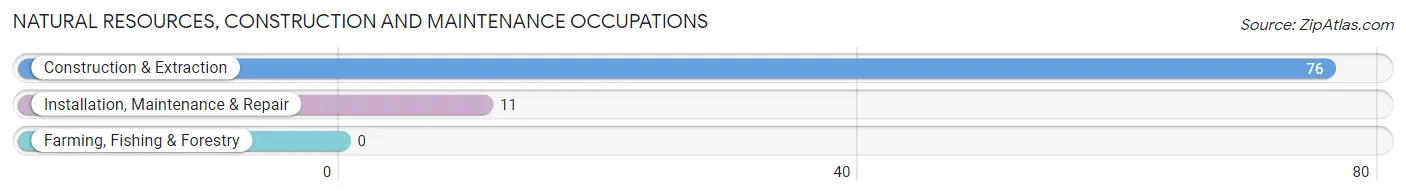
Natural Resources, Construction and Maintenance Occupations
The most common Natural Resources, Construction and Maintenance occupations in West Belmar are Construction & Extraction (76 | 6.0%), and Installation, Maintenance & Repair (11 | 0.9%).
Natural Resources, Construction and Maintenance Occupations by Sex
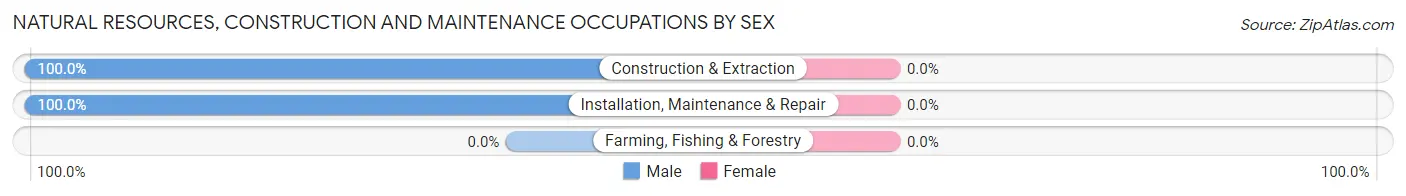
| Occupation | Male | Female |
| Farming, Fishing & Forestry | 0 (0.0%) | 0 (0.0%) |
| Construction & Extraction | 76 (100.0%) | 0 (0.0%) |
| Installation, Maintenance & Repair | 11 (100.0%) | 0 (0.0%) |
| Total (Category) | 87 (100.0%) | 0 (0.0%) |
| Total (Overall) | 612 (48.5%) | 651 (51.5%) |
Production, Transportation and Moving Occupations
The most common Production, Transportation and Moving occupations in West Belmar are Transportation (40 | 3.2%), Production (24 | 1.9%), and Material Moving (12 | 0.9%).
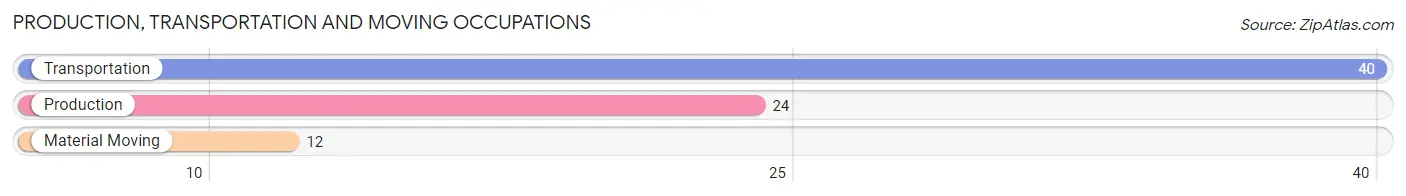
Production, Transportation and Moving Occupations by Sex
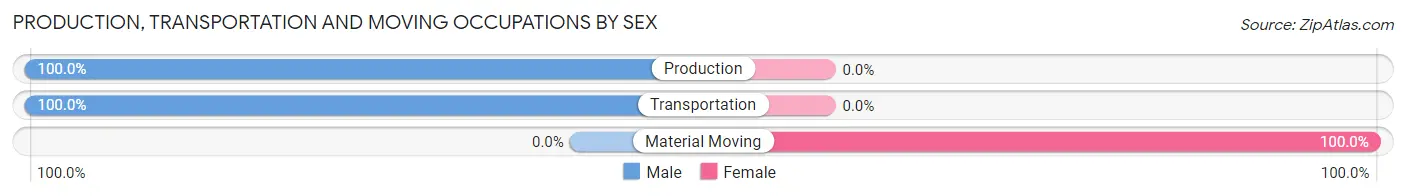
| Occupation | Male | Female |
| Production | 24 (100.0%) | 0 (0.0%) |
| Transportation | 40 (100.0%) | 0 (0.0%) |
| Material Moving | 0 (0.0%) | 12 (100.0%) |
| Total (Category) | 64 (84.2%) | 12 (15.8%) |
| Total (Overall) | 612 (48.5%) | 651 (51.5%) |
Employment Industries by Sex in West Belmar
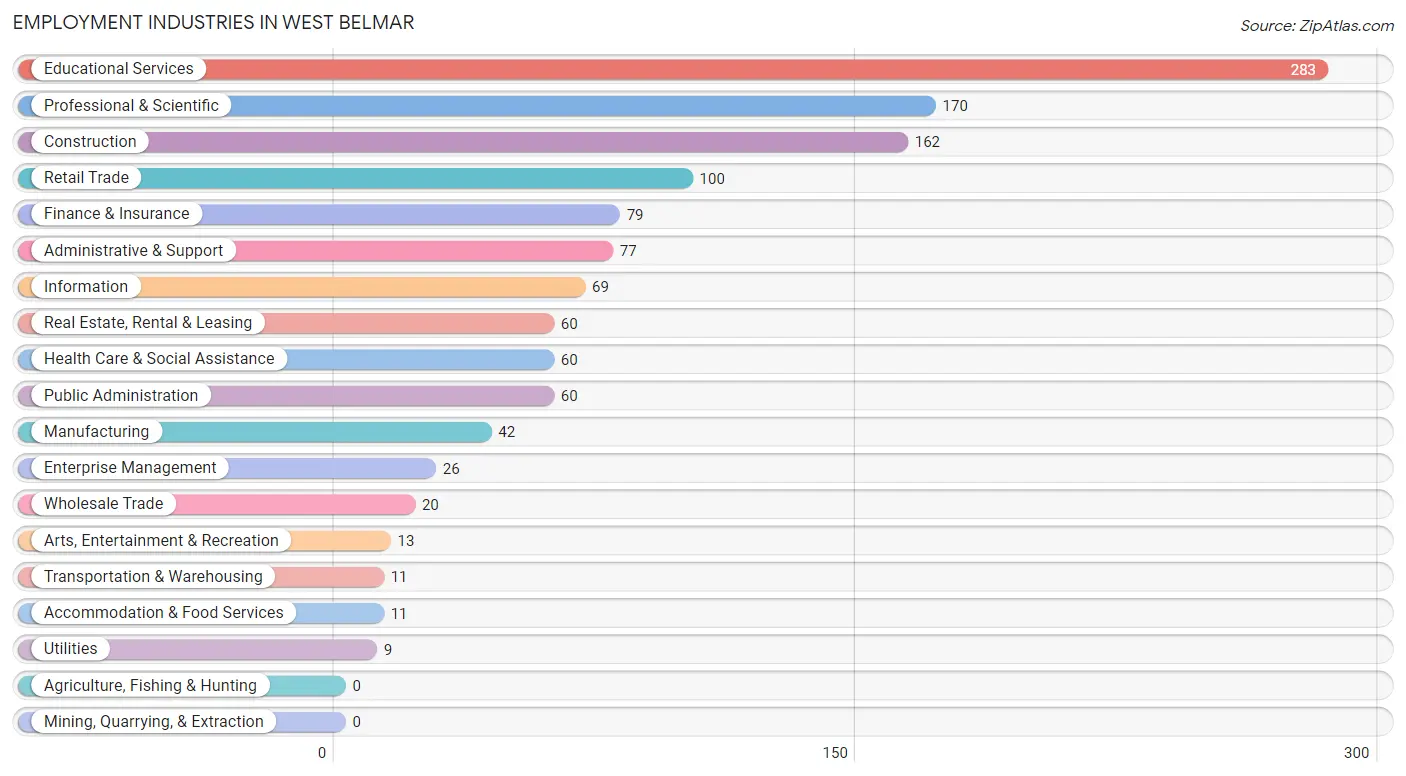
Employment Industries in West Belmar
The major employment industries in West Belmar include Educational Services (283 | 22.4%), Professional & Scientific (170 | 13.5%), Construction (162 | 12.8%), Retail Trade (100 | 7.9%), and Finance & Insurance (79 | 6.2%).
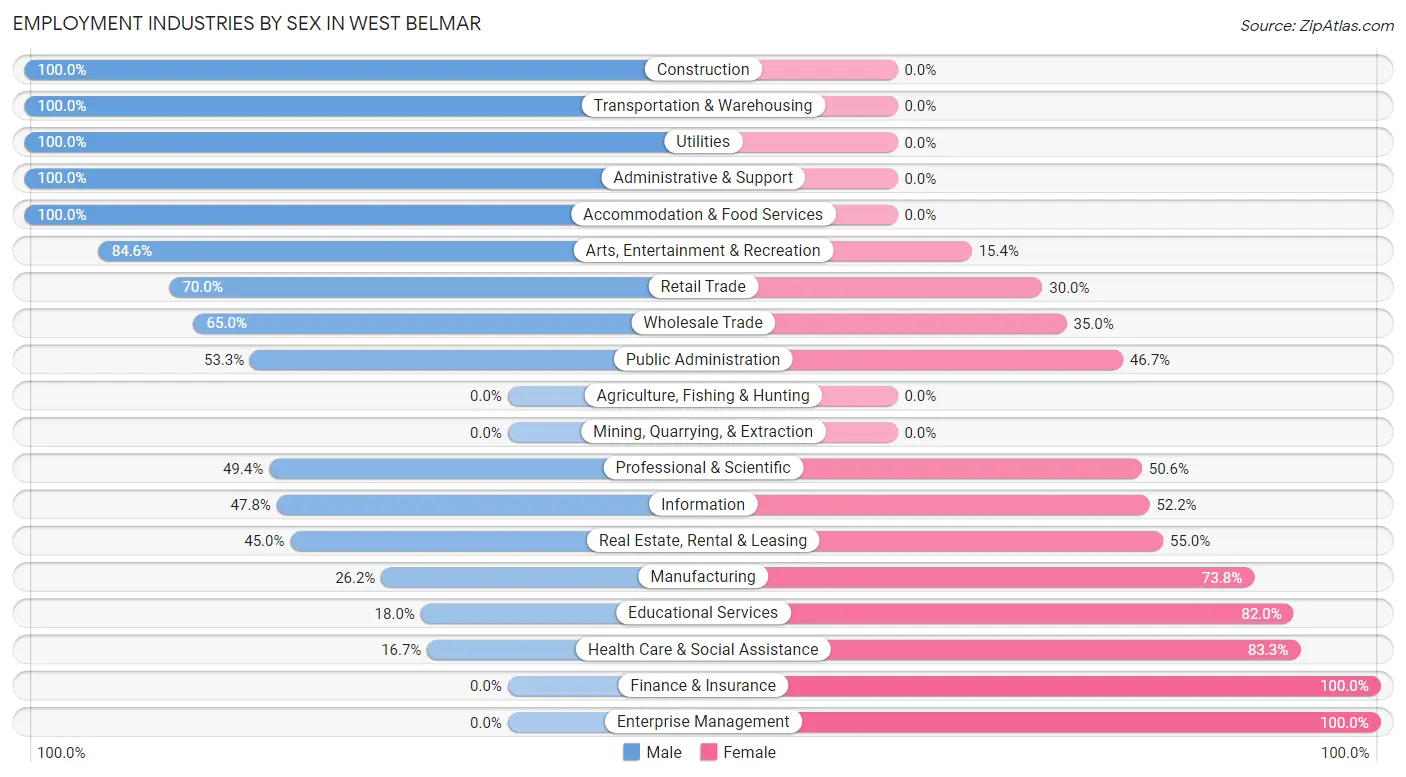
Employment Industries by Sex in West Belmar
The West Belmar industries that see more men than women are Construction (100.0%), Transportation & Warehousing (100.0%), and Utilities (100.0%), whereas the industries that tend to have a higher number of women are Finance & Insurance (100.0%), Enterprise Management (100.0%), and Health Care & Social Assistance (83.3%).
| Industry | Male | Female |
| Agriculture, Fishing & Hunting | 0 (0.0%) | 0 (0.0%) |
| Mining, Quarrying, & Extraction | 0 (0.0%) | 0 (0.0%) |
| Construction | 162 (100.0%) | 0 (0.0%) |
| Manufacturing | 11 (26.2%) | 31 (73.8%) |
| Wholesale Trade | 13 (65.0%) | 7 (35.0%) |
| Retail Trade | 70 (70.0%) | 30 (30.0%) |
| Transportation & Warehousing | 11 (100.0%) | 0 (0.0%) |
| Utilities | 9 (100.0%) | 0 (0.0%) |
| Information | 33 (47.8%) | 36 (52.2%) |
| Finance & Insurance | 0 (0.0%) | 79 (100.0%) |
| Real Estate, Rental & Leasing | 27 (45.0%) | 33 (55.0%) |
| Professional & Scientific | 84 (49.4%) | 86 (50.6%) |
| Enterprise Management | 0 (0.0%) | 26 (100.0%) |
| Administrative & Support | 77 (100.0%) | 0 (0.0%) |
| Educational Services | 51 (18.0%) | 232 (82.0%) |
| Health Care & Social Assistance | 10 (16.7%) | 50 (83.3%) |
| Arts, Entertainment & Recreation | 11 (84.6%) | 2 (15.4%) |
| Accommodation & Food Services | 11 (100.0%) | 0 (0.0%) |
| Public Administration | 32 (53.3%) | 28 (46.7%) |
| Total | 612 (48.5%) | 651 (51.5%) |
Education in West Belmar
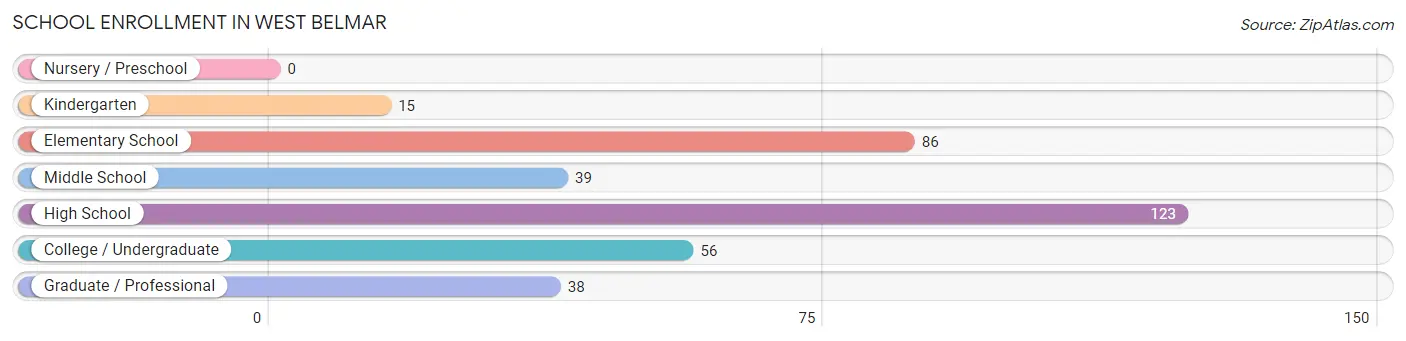
School Enrollment in West Belmar
The most common levels of schooling among the 357 students in West Belmar are high school (123 | 34.4%), elementary school (86 | 24.1%), and college / undergraduate (56 | 15.7%).
| School Level | # Students | % Students |
| Nursery / Preschool | 0 | 0.0% |
| Kindergarten | 15 | 4.2% |
| Elementary School | 86 | 24.1% |
| Middle School | 39 | 10.9% |
| High School | 123 | 34.4% |
| College / Undergraduate | 56 | 15.7% |
| Graduate / Professional | 38 | 10.6% |
| Total | 357 | 100.0% |
School Enrollment by Age by Funding Source in West Belmar
Out of a total of 357 students who are enrolled in schools in West Belmar, 66 (18.5%) attend a private institution, while the remaining 291 (81.5%) are enrolled in public schools. The age group of 20 to 24 year olds has the highest likelihood of being enrolled in private schools, with 12 (100.0% in the age bracket) enrolled. Conversely, the age group of 5 to 9 year old has the lowest likelihood of being enrolled in a private school, with 101 (100.0% in the age bracket) attending a public institution.
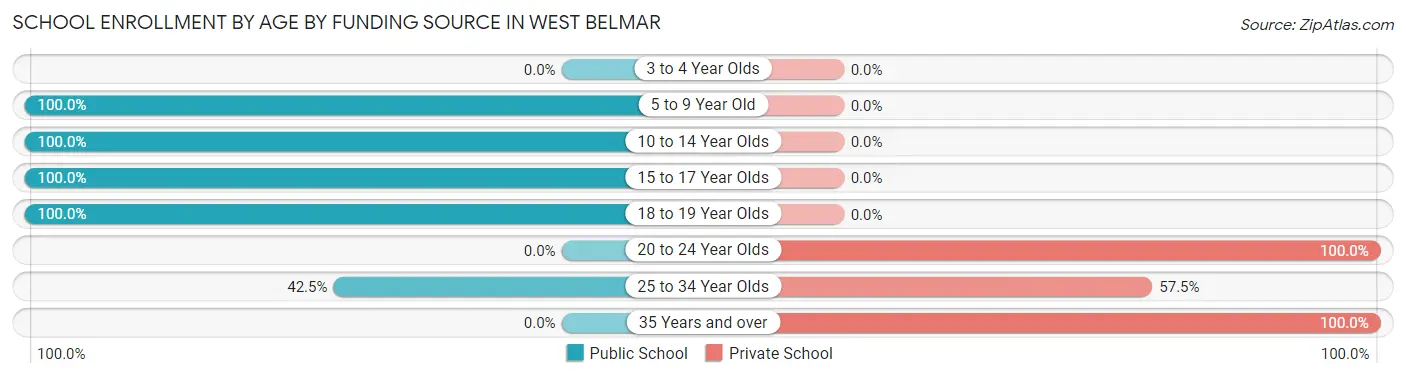
| Age Bracket | Public School | Private School |
| 3 to 4 Year Olds | 0 (0.0%) | 0 (0.0%) |
| 5 to 9 Year Old | 101 (100.0%) | 0 (0.0%) |
| 10 to 14 Year Olds | 39 (100.0%) | 0 (0.0%) |
| 15 to 17 Year Olds | 90 (100.0%) | 0 (0.0%) |
| 18 to 19 Year Olds | 44 (100.0%) | 0 (0.0%) |
| 20 to 24 Year Olds | 0 (0.0%) | 12 (100.0%) |
| 25 to 34 Year Olds | 17 (42.5%) | 23 (57.5%) |
| 35 Years and over | 0 (0.0%) | 31 (100.0%) |
| Total | 291 (81.5%) | 66 (18.5%) |
Educational Attainment by Field of Study in West Belmar
Education (144 | 15.1%), business (117 | 12.3%), psychology (99 | 10.4%), communications (94 | 9.9%), and visual & performing arts (83 | 8.7%) are the most common fields of study among 952 individuals in West Belmar who have obtained a bachelor's degree or higher.
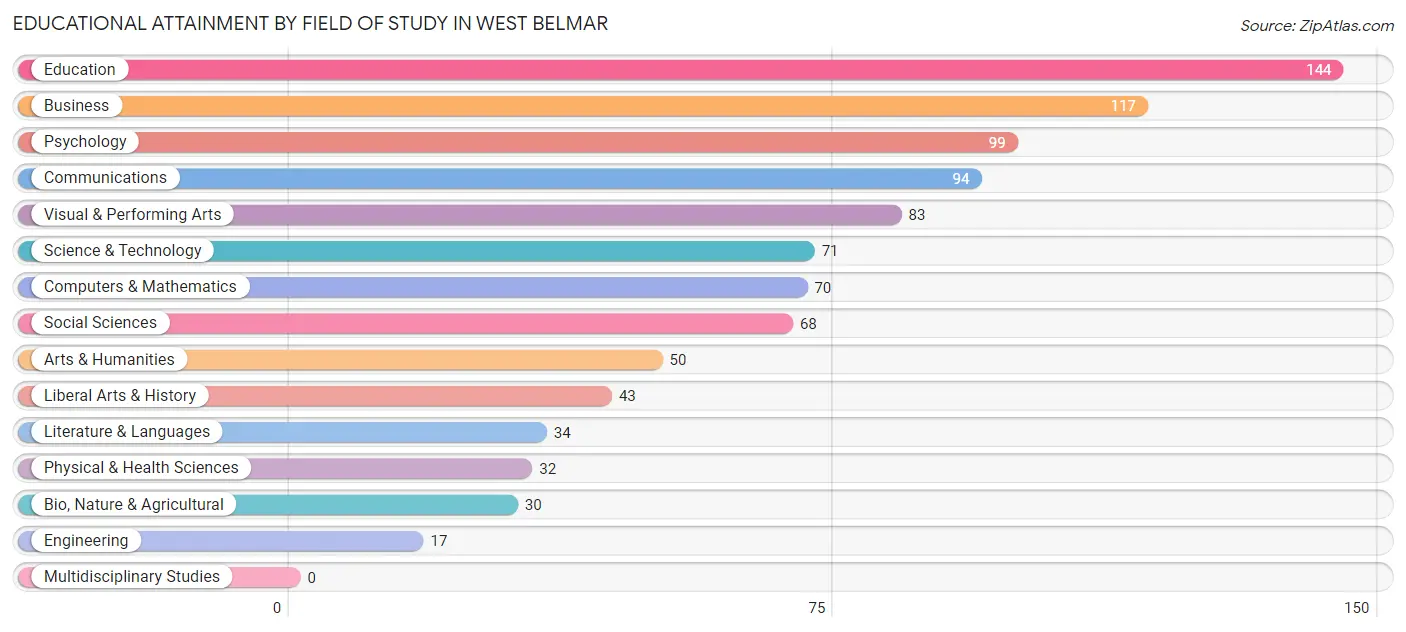
| Field of Study | # Graduates | % Graduates |
| Computers & Mathematics | 70 | 7.3% |
| Bio, Nature & Agricultural | 30 | 3.2% |
| Physical & Health Sciences | 32 | 3.4% |
| Psychology | 99 | 10.4% |
| Social Sciences | 68 | 7.1% |
| Engineering | 17 | 1.8% |
| Multidisciplinary Studies | 0 | 0.0% |
| Science & Technology | 71 | 7.5% |
| Business | 117 | 12.3% |
| Education | 144 | 15.1% |
| Literature & Languages | 34 | 3.6% |
| Liberal Arts & History | 43 | 4.5% |
| Visual & Performing Arts | 83 | 8.7% |
| Communications | 94 | 9.9% |
| Arts & Humanities | 50 | 5.2% |
| Total | 952 | 100.0% |
Transportation & Commute in West Belmar
Vehicle Availability by Sex in West Belmar
The most prevalent vehicle ownership categories in West Belmar are males with 2 vehicles (243, accounting for 39.7%) and females with 2 vehicles (278, making up 39.3%).
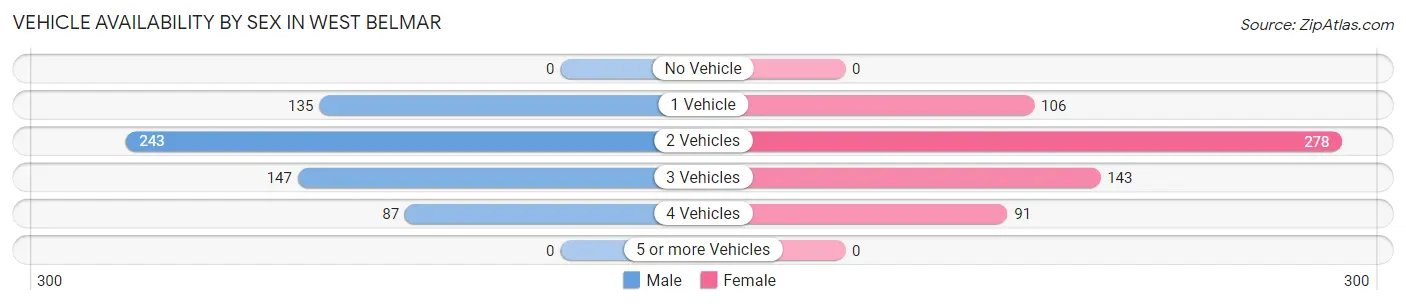
| Vehicles Available | Male | Female |
| No Vehicle | 0 (0.0%) | 0 (0.0%) |
| 1 Vehicle | 135 (22.1%) | 106 (17.2%) |
| 2 Vehicles | 243 (39.7%) | 278 (45.0%) |
| 3 Vehicles | 147 (24.0%) | 143 (23.1%) |
| 4 Vehicles | 87 (14.2%) | 91 (14.7%) |
| 5 or more Vehicles | 0 (0.0%) | 0 (0.0%) |
| Total | 612 (100.0%) | 618 (100.0%) |
Commute Time in West Belmar
The most frequently occuring commute durations in West Belmar are 10 to 14 minutes (168 commuters, 17.4%), 5 to 9 minutes (125 commuters, 12.9%), and 25 to 29 minutes (96 commuters, 9.9%).
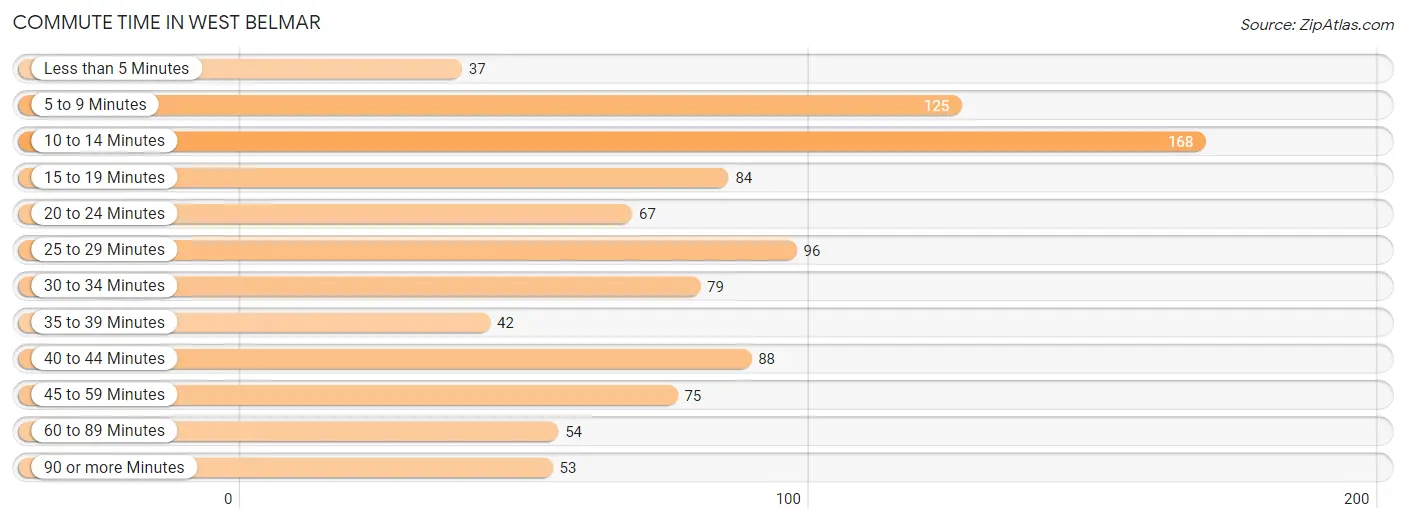
| Commute Time | # Commuters | % Commuters |
| Less than 5 Minutes | 37 | 3.8% |
| 5 to 9 Minutes | 125 | 12.9% |
| 10 to 14 Minutes | 168 | 17.4% |
| 15 to 19 Minutes | 84 | 8.7% |
| 20 to 24 Minutes | 67 | 6.9% |
| 25 to 29 Minutes | 96 | 9.9% |
| 30 to 34 Minutes | 79 | 8.2% |
| 35 to 39 Minutes | 42 | 4.3% |
| 40 to 44 Minutes | 88 | 9.1% |
| 45 to 59 Minutes | 75 | 7.7% |
| 60 to 89 Minutes | 54 | 5.6% |
| 90 or more Minutes | 53 | 5.5% |
Commute Time by Sex in West Belmar
The most common commute times in West Belmar are 10 to 14 minutes (126 commuters, 23.8%) for males and 5 to 9 minutes (70 commuters, 16.0%) for females.
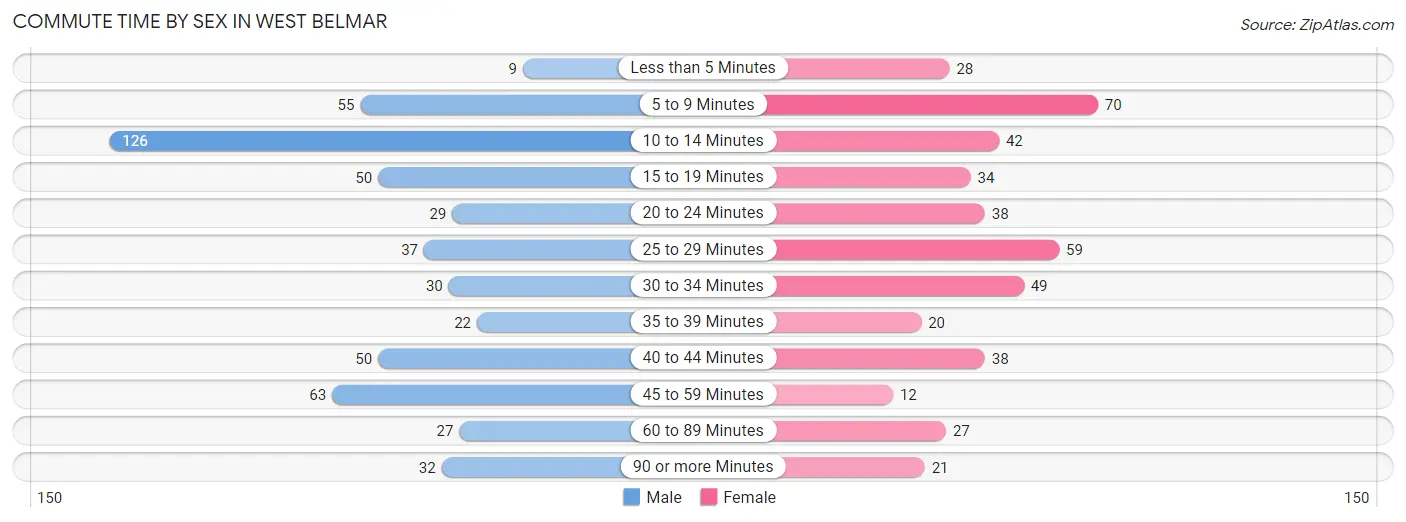
| Commute Time | Male | Female |
| Less than 5 Minutes | 9 (1.7%) | 28 (6.4%) |
| 5 to 9 Minutes | 55 (10.4%) | 70 (16.0%) |
| 10 to 14 Minutes | 126 (23.8%) | 42 (9.6%) |
| 15 to 19 Minutes | 50 (9.4%) | 34 (7.8%) |
| 20 to 24 Minutes | 29 (5.5%) | 38 (8.7%) |
| 25 to 29 Minutes | 37 (7.0%) | 59 (13.5%) |
| 30 to 34 Minutes | 30 (5.7%) | 49 (11.2%) |
| 35 to 39 Minutes | 22 (4.2%) | 20 (4.6%) |
| 40 to 44 Minutes | 50 (9.4%) | 38 (8.7%) |
| 45 to 59 Minutes | 63 (11.9%) | 12 (2.7%) |
| 60 to 89 Minutes | 27 (5.1%) | 27 (6.2%) |
| 90 or more Minutes | 32 (6.0%) | 21 (4.8%) |
Time of Departure to Work by Sex in West Belmar
The most frequent times of departure to work in West Belmar are 6:30 AM to 6:59 AM (149, 28.1%) for males and 8:00 AM to 8:29 AM (132, 30.1%) for females.
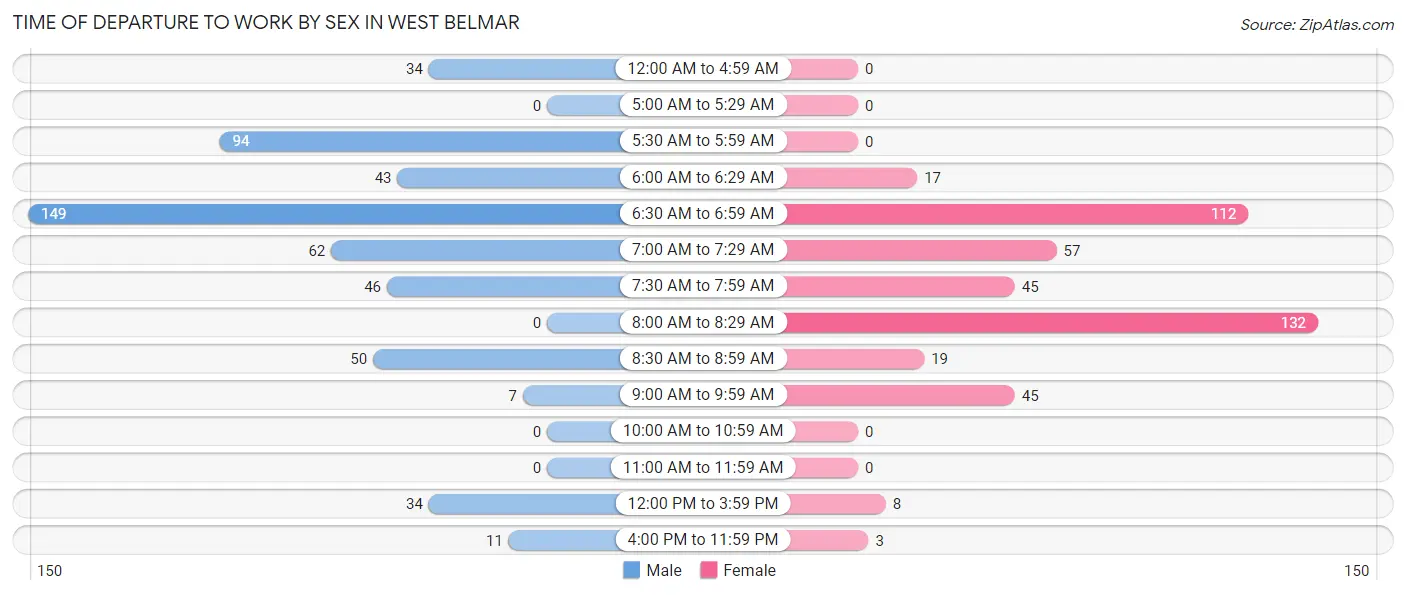
| Time of Departure | Male | Female |
| 12:00 AM to 4:59 AM | 34 (6.4%) | 0 (0.0%) |
| 5:00 AM to 5:29 AM | 0 (0.0%) | 0 (0.0%) |
| 5:30 AM to 5:59 AM | 94 (17.7%) | 0 (0.0%) |
| 6:00 AM to 6:29 AM | 43 (8.1%) | 17 (3.9%) |
| 6:30 AM to 6:59 AM | 149 (28.1%) | 112 (25.6%) |
| 7:00 AM to 7:29 AM | 62 (11.7%) | 57 (13.0%) |
| 7:30 AM to 7:59 AM | 46 (8.7%) | 45 (10.3%) |
| 8:00 AM to 8:29 AM | 0 (0.0%) | 132 (30.1%) |
| 8:30 AM to 8:59 AM | 50 (9.4%) | 19 (4.3%) |
| 9:00 AM to 9:59 AM | 7 (1.3%) | 45 (10.3%) |
| 10:00 AM to 10:59 AM | 0 (0.0%) | 0 (0.0%) |
| 11:00 AM to 11:59 AM | 0 (0.0%) | 0 (0.0%) |
| 12:00 PM to 3:59 PM | 34 (6.4%) | 8 (1.8%) |
| 4:00 PM to 11:59 PM | 11 (2.1%) | 3 (0.7%) |
| Total | 530 (100.0%) | 438 (100.0%) |
Housing Occupancy in West Belmar
Occupancy by Ownership in West Belmar
Of the total 998 dwellings in West Belmar, owner-occupied units account for 903 (90.5%), while renter-occupied units make up 95 (9.5%).
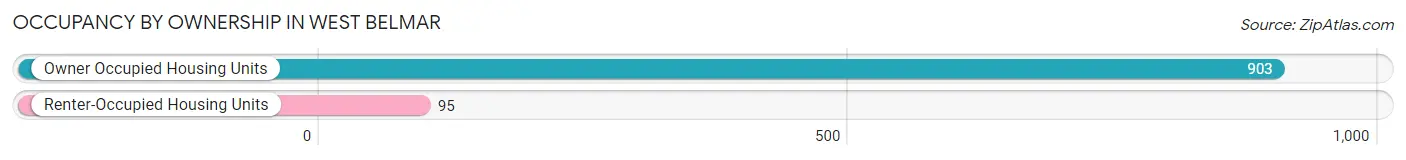
| Occupancy | # Housing Units | % Housing Units |
| Owner Occupied Housing Units | 903 | 90.5% |
| Renter-Occupied Housing Units | 95 | 9.5% |
| Total Occupied Housing Units | 998 | 100.0% |
Occupancy by Household Size in West Belmar
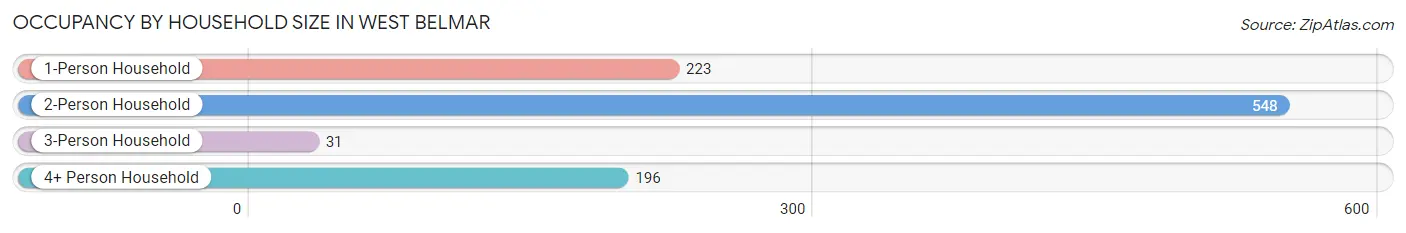
| Household Size | # Housing Units | % Housing Units |
| 1-Person Household | 223 | 22.3% |
| 2-Person Household | 548 | 54.9% |
| 3-Person Household | 31 | 3.1% |
| 4+ Person Household | 196 | 19.6% |
| Total Housing Units | 998 | 100.0% |
Occupancy by Ownership by Household Size in West Belmar
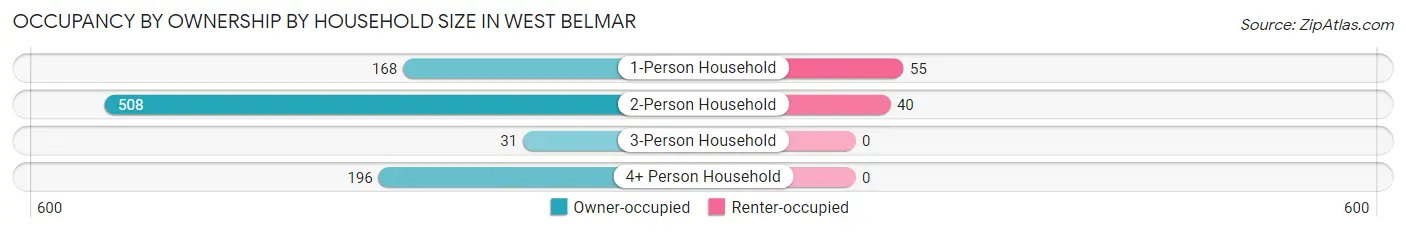
| Household Size | Owner-occupied | Renter-occupied |
| 1-Person Household | 168 (75.3%) | 55 (24.7%) |
| 2-Person Household | 508 (92.7%) | 40 (7.3%) |
| 3-Person Household | 31 (100.0%) | 0 (0.0%) |
| 4+ Person Household | 196 (100.0%) | 0 (0.0%) |
| Total Housing Units | 903 (90.5%) | 95 (9.5%) |
Occupancy by Educational Attainment in West Belmar
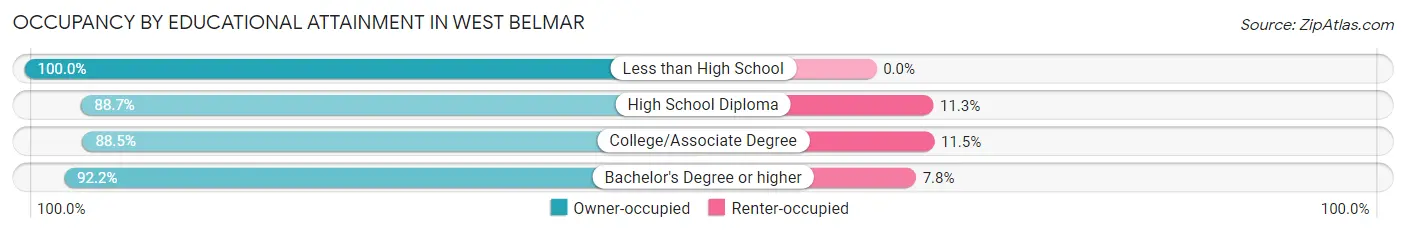
| Household Size | Owner-occupied | Renter-occupied |
| Less than High School | 18 (100.0%) | 0 (0.0%) |
| High School Diploma | 126 (88.7%) | 16 (11.3%) |
| College/Associate Degree | 324 (88.5%) | 42 (11.5%) |
| Bachelor's Degree or higher | 435 (92.2%) | 37 (7.8%) |
Occupancy by Age of Householder in West Belmar
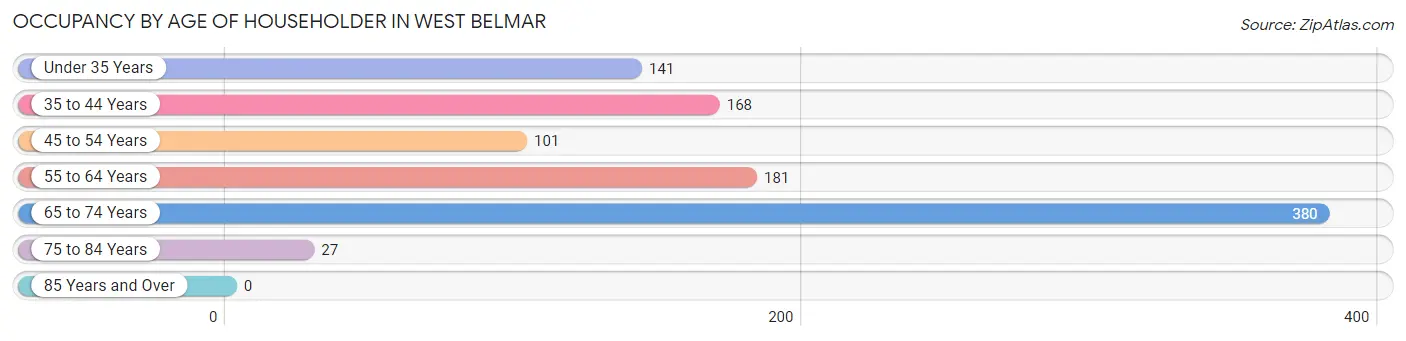
| Age Bracket | # Households | % Households |
| Under 35 Years | 141 | 14.1% |
| 35 to 44 Years | 168 | 16.8% |
| 45 to 54 Years | 101 | 10.1% |
| 55 to 64 Years | 181 | 18.1% |
| 65 to 74 Years | 380 | 38.1% |
| 75 to 84 Years | 27 | 2.7% |
| 85 Years and Over | 0 | 0.0% |
| Total | 998 | 100.0% |
Housing Finances in West Belmar
Median Income by Occupancy in West Belmar
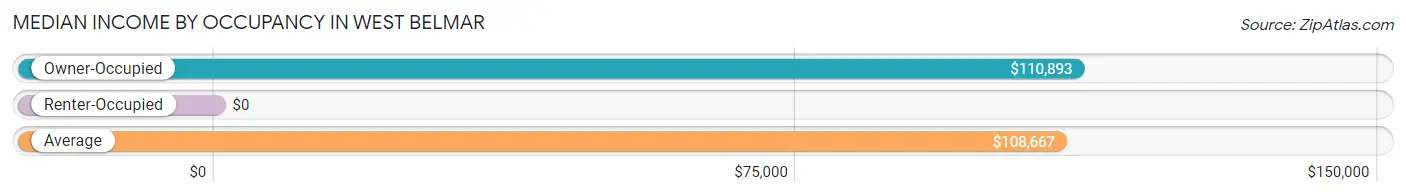
| Occupancy Type | # Households | Median Income |
| Owner-Occupied | 903 (90.5%) | $110,893 |
| Renter-Occupied | 95 (9.5%) | $0 |
| Average | 998 (100.0%) | $108,667 |
Occupancy by Householder Income Bracket in West Belmar
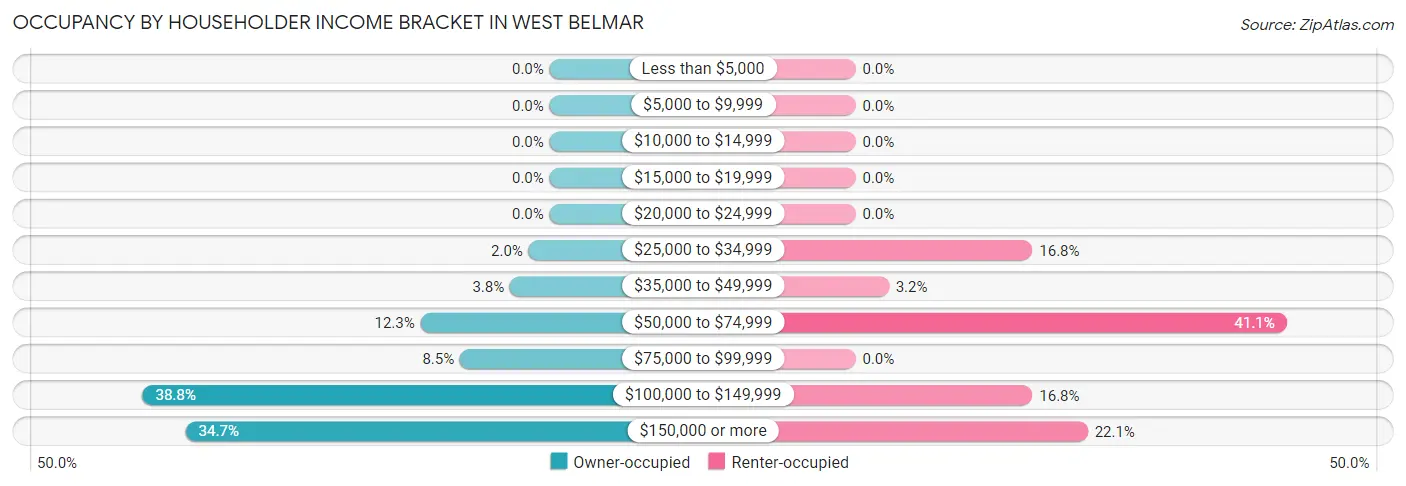
| Income Bracket | Owner-occupied | Renter-occupied |
| Less than $5,000 | 0 (0.0%) | 0 (0.0%) |
| $5,000 to $9,999 | 0 (0.0%) | 0 (0.0%) |
| $10,000 to $14,999 | 0 (0.0%) | 0 (0.0%) |
| $15,000 to $19,999 | 0 (0.0%) | 0 (0.0%) |
| $20,000 to $24,999 | 0 (0.0%) | 0 (0.0%) |
| $25,000 to $34,999 | 18 (2.0%) | 16 (16.8%) |
| $35,000 to $49,999 | 34 (3.8%) | 3 (3.2%) |
| $50,000 to $74,999 | 111 (12.3%) | 39 (41.0%) |
| $75,000 to $99,999 | 77 (8.5%) | 0 (0.0%) |
| $100,000 to $149,999 | 350 (38.8%) | 16 (16.8%) |
| $150,000 or more | 313 (34.7%) | 21 (22.1%) |
| Total | 903 (100.0%) | 95 (100.0%) |
Monthly Housing Cost Tiers in West Belmar
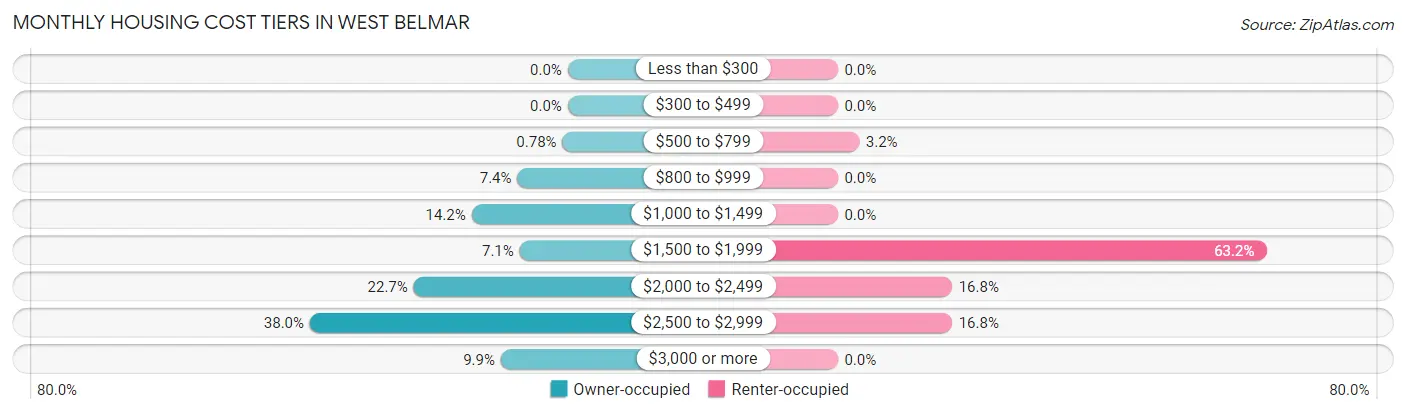
| Monthly Cost | Owner-occupied | Renter-occupied |
| Less than $300 | 0 (0.0%) | 0 (0.0%) |
| $300 to $499 | 0 (0.0%) | 0 (0.0%) |
| $500 to $799 | 7 (0.8%) | 3 (3.2%) |
| $800 to $999 | 67 (7.4%) | 0 (0.0%) |
| $1,000 to $1,499 | 128 (14.2%) | 0 (0.0%) |
| $1,500 to $1,999 | 64 (7.1%) | 60 (63.2%) |
| $2,000 to $2,499 | 205 (22.7%) | 16 (16.8%) |
| $2,500 to $2,999 | 343 (38.0%) | 16 (16.8%) |
| $3,000 or more | 89 (9.9%) | 0 (0.0%) |
| Total | 903 (100.0%) | 95 (100.0%) |
Physical Housing Characteristics in West Belmar
Housing Structures in West Belmar
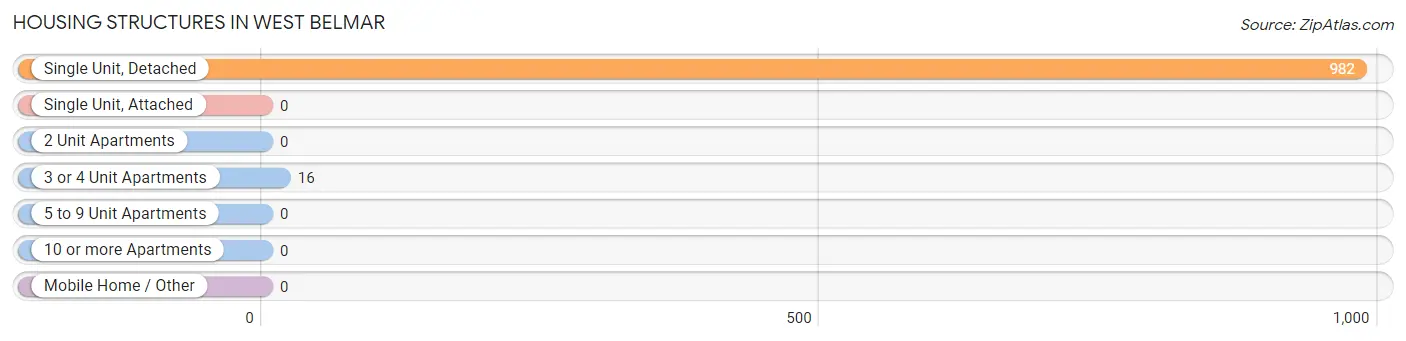
| Structure Type | # Housing Units | % Housing Units |
| Single Unit, Detached | 982 | 98.4% |
| Single Unit, Attached | 0 | 0.0% |
| 2 Unit Apartments | 0 | 0.0% |
| 3 or 4 Unit Apartments | 16 | 1.6% |
| 5 to 9 Unit Apartments | 0 | 0.0% |
| 10 or more Apartments | 0 | 0.0% |
| Mobile Home / Other | 0 | 0.0% |
| Total | 998 | 100.0% |
Housing Structures by Occupancy in West Belmar
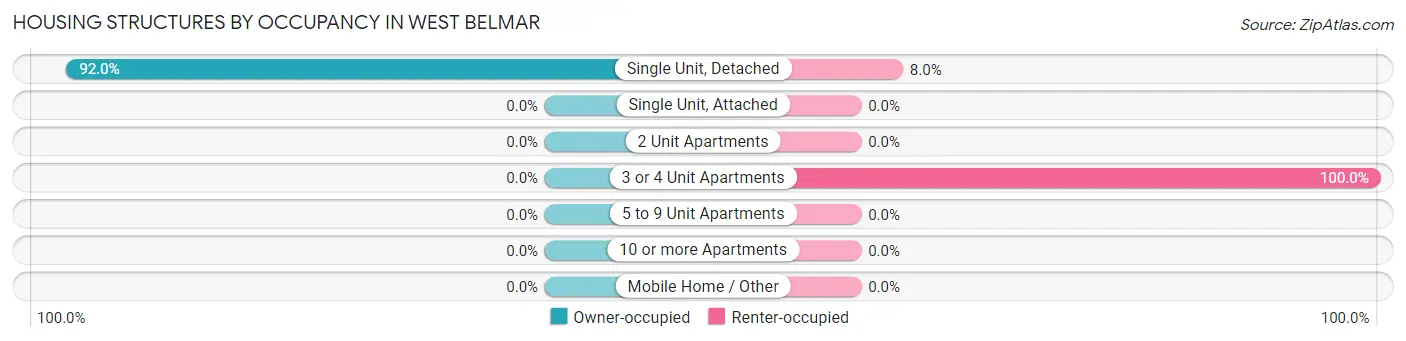
| Structure Type | Owner-occupied | Renter-occupied |
| Single Unit, Detached | 903 (92.0%) | 79 (8.0%) |
| Single Unit, Attached | 0 (0.0%) | 0 (0.0%) |
| 2 Unit Apartments | 0 (0.0%) | 0 (0.0%) |
| 3 or 4 Unit Apartments | 0 (0.0%) | 16 (100.0%) |
| 5 to 9 Unit Apartments | 0 (0.0%) | 0 (0.0%) |
| 10 or more Apartments | 0 (0.0%) | 0 (0.0%) |
| Mobile Home / Other | 0 (0.0%) | 0 (0.0%) |
| Total | 903 (90.5%) | 95 (9.5%) |
Housing Structures by Number of Rooms in West Belmar
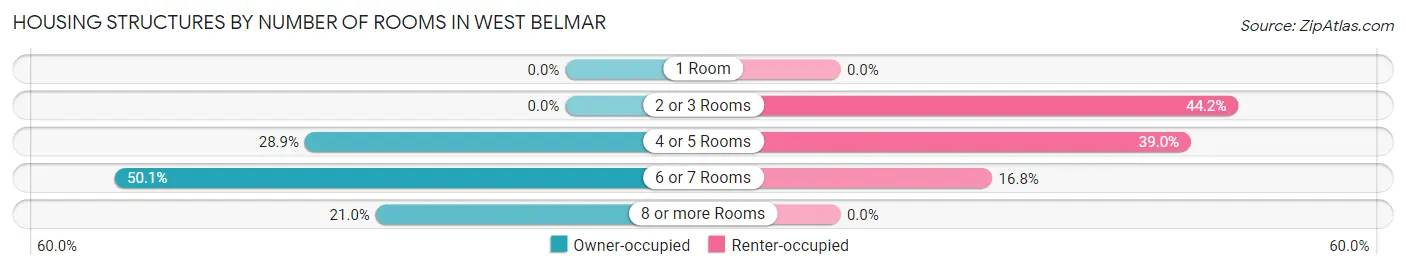
| Number of Rooms | Owner-occupied | Renter-occupied |
| 1 Room | 0 (0.0%) | 0 (0.0%) |
| 2 or 3 Rooms | 0 (0.0%) | 42 (44.2%) |
| 4 or 5 Rooms | 261 (28.9%) | 37 (39.0%) |
| 6 or 7 Rooms | 452 (50.1%) | 16 (16.8%) |
| 8 or more Rooms | 190 (21.0%) | 0 (0.0%) |
| Total | 903 (100.0%) | 95 (100.0%) |
Housing Structure by Heating Type in West Belmar
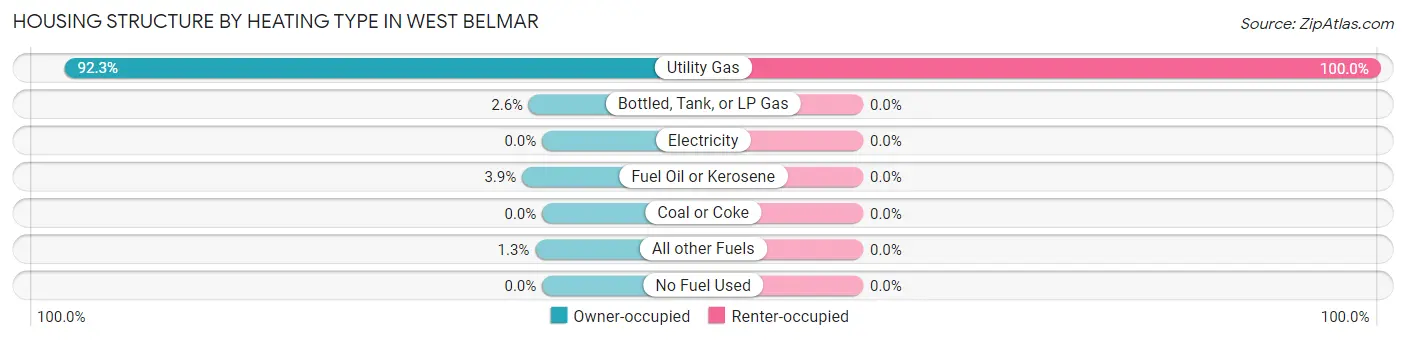
| Heating Type | Owner-occupied | Renter-occupied |
| Utility Gas | 833 (92.2%) | 95 (100.0%) |
| Bottled, Tank, or LP Gas | 23 (2.5%) | 0 (0.0%) |
| Electricity | 0 (0.0%) | 0 (0.0%) |
| Fuel Oil or Kerosene | 35 (3.9%) | 0 (0.0%) |
| Coal or Coke | 0 (0.0%) | 0 (0.0%) |
| All other Fuels | 12 (1.3%) | 0 (0.0%) |
| No Fuel Used | 0 (0.0%) | 0 (0.0%) |
| Total | 903 (100.0%) | 95 (100.0%) |
Household Vehicle Usage in West Belmar
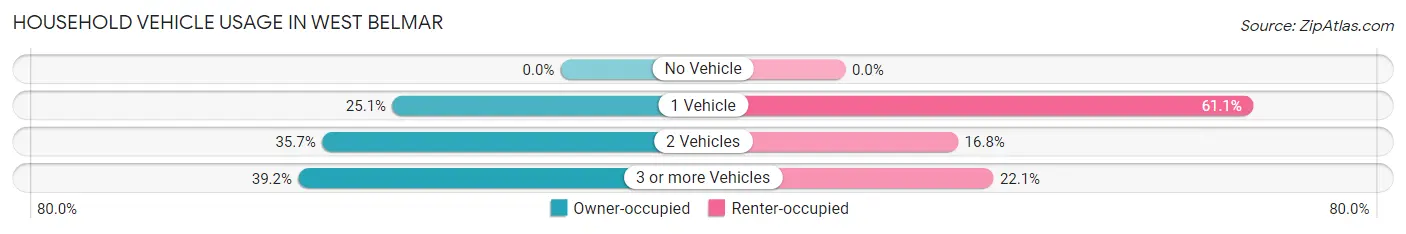
| Vehicles per Household | Owner-occupied | Renter-occupied |
| No Vehicle | 0 (0.0%) | 0 (0.0%) |
| 1 Vehicle | 227 (25.1%) | 58 (61.1%) |
| 2 Vehicles | 322 (35.7%) | 16 (16.8%) |
| 3 or more Vehicles | 354 (39.2%) | 21 (22.1%) |
| Total | 903 (100.0%) | 95 (100.0%) |
Real Estate & Mortgages in West Belmar
Real Estate and Mortgage Overview in West Belmar
| Characteristic | Without Mortgage | With Mortgage |
| Housing Units | 176 | 727 |
| Median Property Value | $422,700 | $485,500 |
| Median Household Income | $132,778 | $255 |
| Monthly Housing Costs | $1,018 | $89 |
| Real Estate Taxes | $7,037 | $0 |
Property Value by Mortgage Status in West Belmar
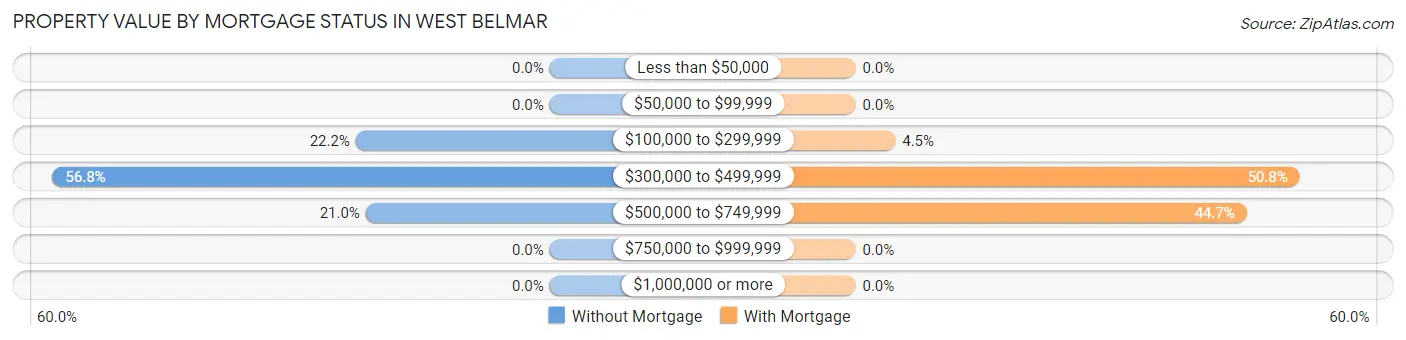
| Property Value | Without Mortgage | With Mortgage |
| Less than $50,000 | 0 (0.0%) | 0 (0.0%) |
| $50,000 to $99,999 | 0 (0.0%) | 0 (0.0%) |
| $100,000 to $299,999 | 39 (22.2%) | 33 (4.5%) |
| $300,000 to $499,999 | 100 (56.8%) | 369 (50.8%) |
| $500,000 to $749,999 | 37 (21.0%) | 325 (44.7%) |
| $750,000 to $999,999 | 0 (0.0%) | 0 (0.0%) |
| $1,000,000 or more | 0 (0.0%) | 0 (0.0%) |
| Total | 176 (100.0%) | 727 (100.0%) |
Household Income by Mortgage Status in West Belmar
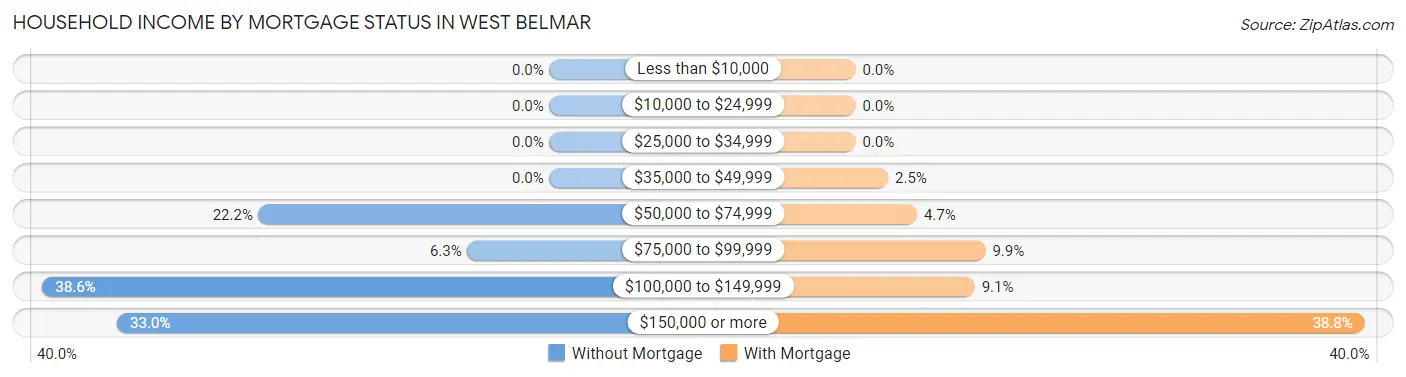
| Household Income | Without Mortgage | With Mortgage |
| Less than $10,000 | 0 (0.0%) | 0 (0.0%) |
| $10,000 to $24,999 | 0 (0.0%) | 0 (0.0%) |
| $25,000 to $34,999 | 0 (0.0%) | 0 (0.0%) |
| $35,000 to $49,999 | 0 (0.0%) | 18 (2.5%) |
| $50,000 to $74,999 | 39 (22.2%) | 34 (4.7%) |
| $75,000 to $99,999 | 11 (6.2%) | 72 (9.9%) |
| $100,000 to $149,999 | 68 (38.6%) | 66 (9.1%) |
| $150,000 or more | 58 (33.0%) | 282 (38.8%) |
| Total | 176 (100.0%) | 727 (100.0%) |
Property Value to Household Income Ratio in West Belmar
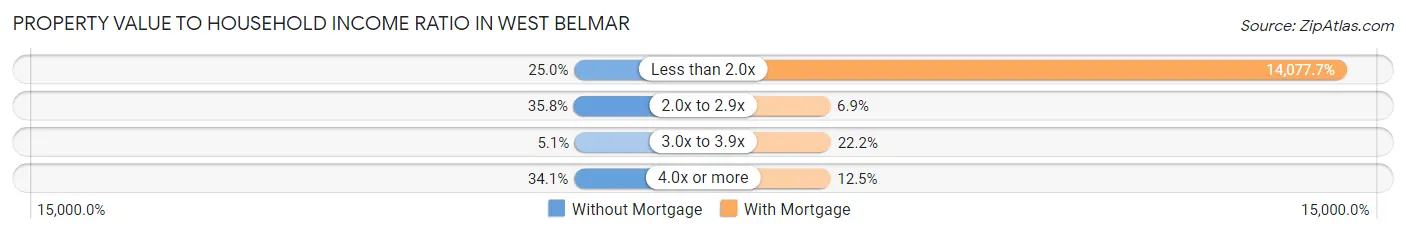
| Value-to-Income Ratio | Without Mortgage | With Mortgage |
| Less than 2.0x | 44 (25.0%) | 102,345 (14,077.7%) |
| 2.0x to 2.9x | 63 (35.8%) | 50 (6.9%) |
| 3.0x to 3.9x | 9 (5.1%) | 161 (22.2%) |
| 4.0x or more | 60 (34.1%) | 91 (12.5%) |
| Total | 176 (100.0%) | 727 (100.0%) |
Real Estate Taxes by Mortgage Status in West Belmar
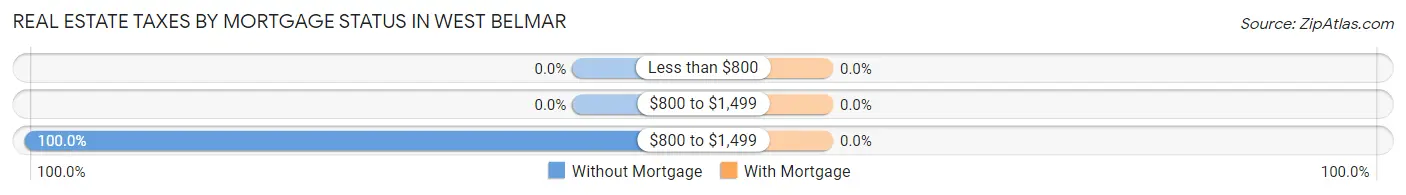
| Property Taxes | Without Mortgage | With Mortgage |
| Less than $800 | 0 (0.0%) | 0 (0.0%) |
| $800 to $1,499 | 0 (0.0%) | 0 (0.0%) |
| $800 to $1,499 | 176 (100.0%) | 0 (0.0%) |
| Total | 176 (100.0%) | 727 (100.0%) |
Health & Disability in West Belmar
Health Insurance Coverage by Age in West Belmar
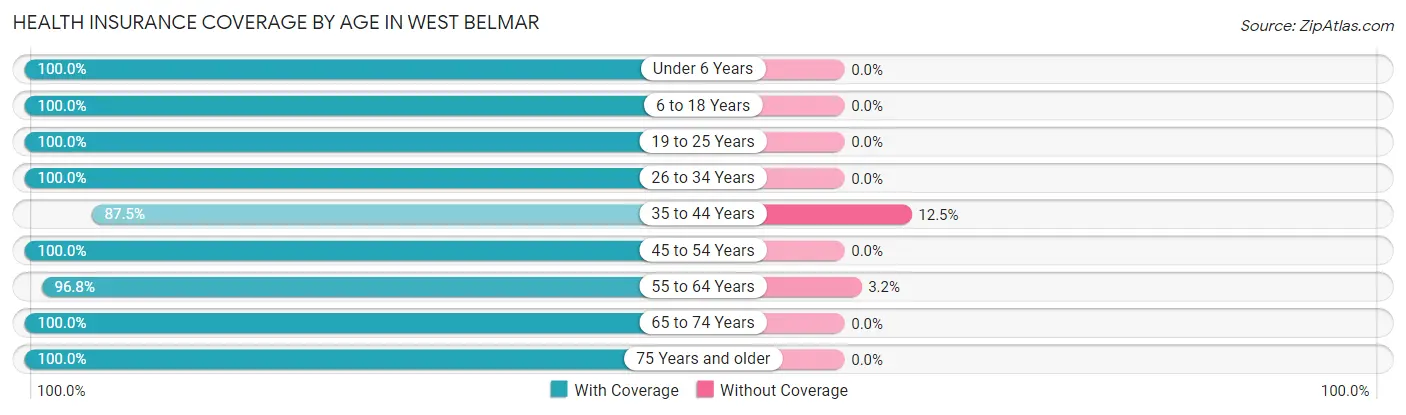
| Age Bracket | With Coverage | Without Coverage |
| Under 6 Years | 119 (100.0%) | 0 (0.0%) |
| 6 to 18 Years | 248 (100.0%) | 0 (0.0%) |
| 19 to 25 Years | 82 (100.0%) | 0 (0.0%) |
| 26 to 34 Years | 292 (100.0%) | 0 (0.0%) |
| 35 to 44 Years | 273 (87.5%) | 39 (12.5%) |
| 45 to 54 Years | 233 (100.0%) | 0 (0.0%) |
| 55 to 64 Years | 276 (96.8%) | 9 (3.2%) |
| 65 to 74 Years | 664 (100.0%) | 0 (0.0%) |
| 75 Years and older | 44 (100.0%) | 0 (0.0%) |
| Total | 2,231 (97.9%) | 48 (2.1%) |
Health Insurance Coverage by Citizenship Status in West Belmar
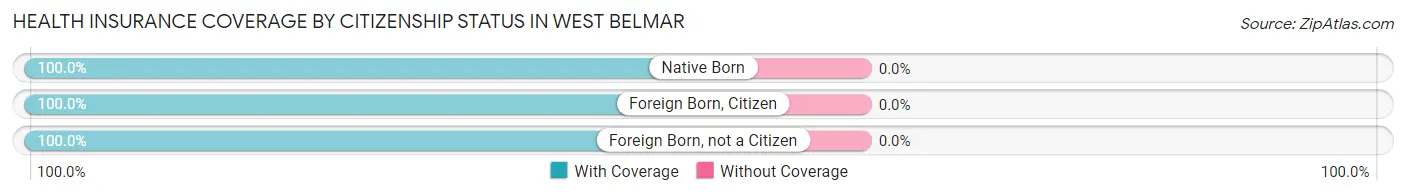
| Citizenship Status | With Coverage | Without Coverage |
| Native Born | 119 (100.0%) | 0 (0.0%) |
| Foreign Born, Citizen | 248 (100.0%) | 0 (0.0%) |
| Foreign Born, not a Citizen | 82 (100.0%) | 0 (0.0%) |
Health Insurance Coverage by Household Income in West Belmar
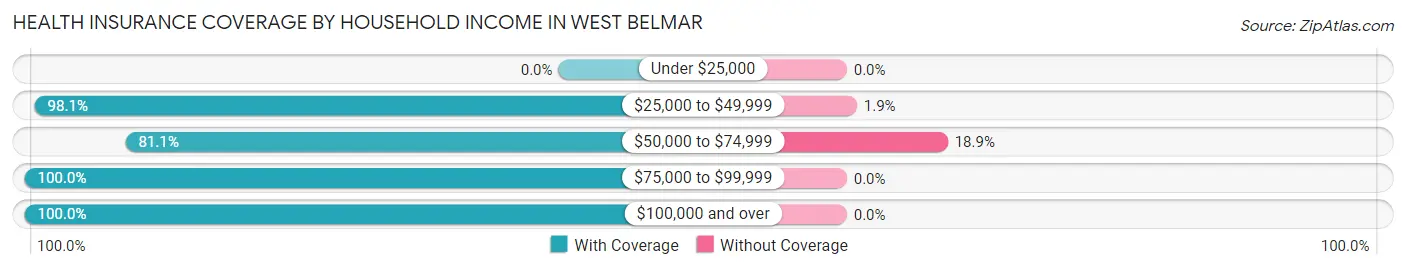
| Household Income | With Coverage | Without Coverage |
| Under $25,000 | 0 (0.0%) | 0 (0.0%) |
| $25,000 to $49,999 | 156 (98.1%) | 3 (1.9%) |
| $50,000 to $74,999 | 193 (81.1%) | 45 (18.9%) |
| $75,000 to $99,999 | 91 (100.0%) | 0 (0.0%) |
| $100,000 and over | 1,791 (100.0%) | 0 (0.0%) |
Public vs Private Health Insurance Coverage by Age in West Belmar
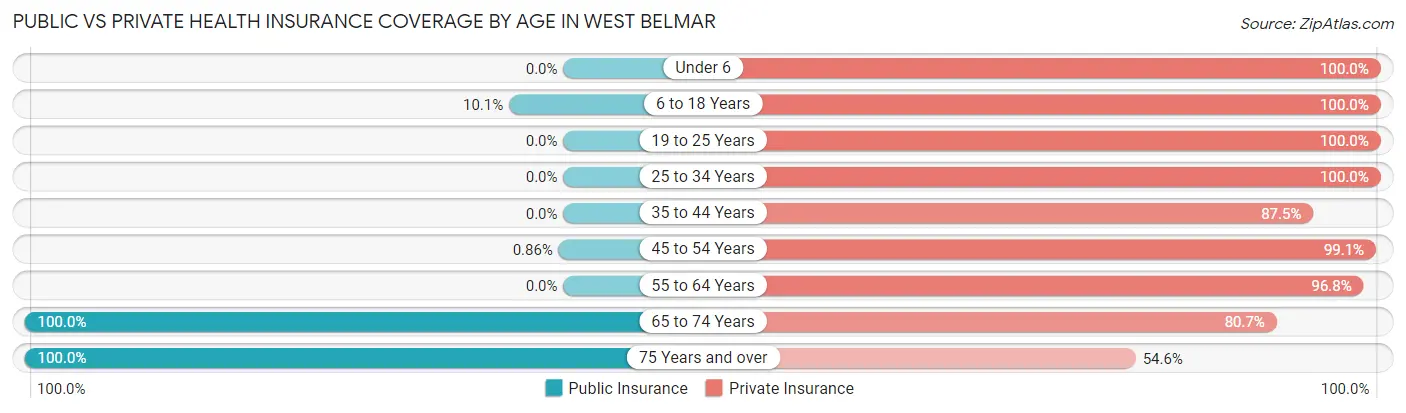
| Age Bracket | Public Insurance | Private Insurance |
| Under 6 | 0 (0.0%) | 119 (100.0%) |
| 6 to 18 Years | 25 (10.1%) | 248 (100.0%) |
| 19 to 25 Years | 0 (0.0%) | 82 (100.0%) |
| 25 to 34 Years | 0 (0.0%) | 292 (100.0%) |
| 35 to 44 Years | 0 (0.0%) | 273 (87.5%) |
| 45 to 54 Years | 2 (0.9%) | 231 (99.1%) |
| 55 to 64 Years | 0 (0.0%) | 276 (96.8%) |
| 65 to 74 Years | 664 (100.0%) | 536 (80.7%) |
| 75 Years and over | 44 (100.0%) | 24 (54.5%) |
| Total | 735 (32.3%) | 2,081 (91.3%) |
Disability Status by Sex by Age in West Belmar
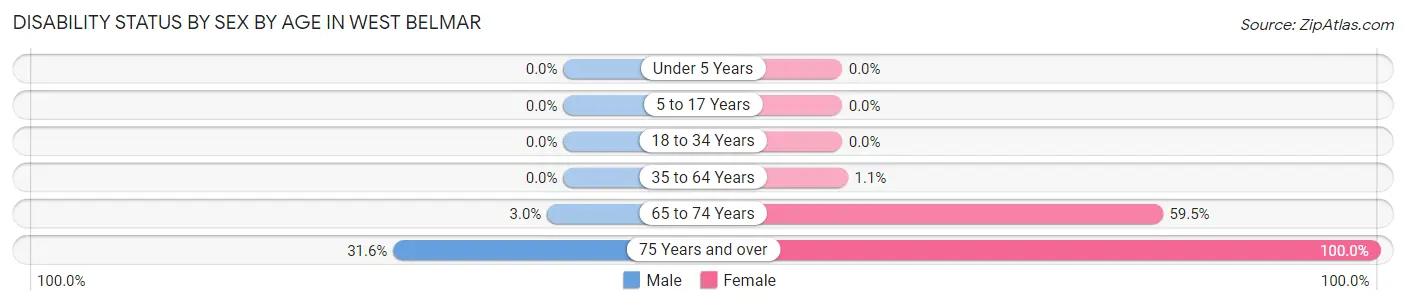
| Age Bracket | Male | Female |
| Under 5 Years | 0 (0.0%) | 0 (0.0%) |
| 5 to 17 Years | 0 (0.0%) | 0 (0.0%) |
| 18 to 34 Years | 0 (0.0%) | 0 (0.0%) |
| 35 to 64 Years | 0 (0.0%) | 5 (1.1%) |
| 65 to 74 Years | 10 (3.0%) | 197 (59.5%) |
| 75 Years and over | 6 (31.6%) | 25 (100.0%) |
Disability Class by Sex by Age in West Belmar
Disability Class: Hearing Difficulty
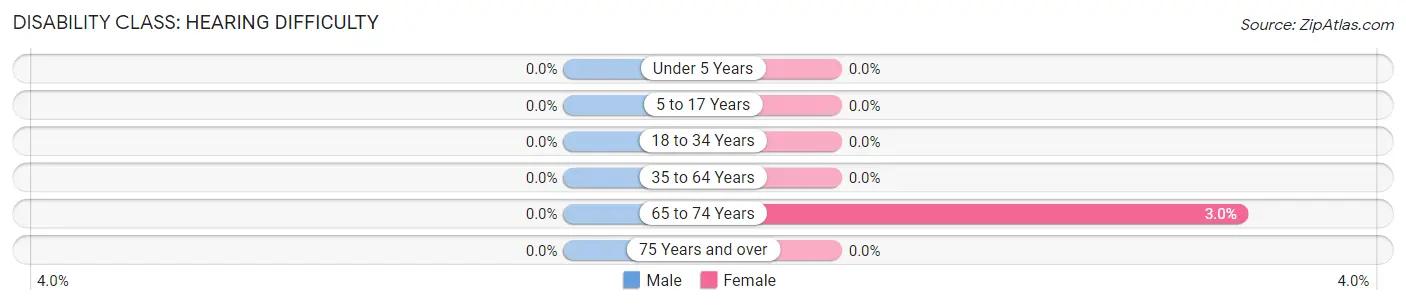
| Age Bracket | Male | Female |
| Under 5 Years | 0 (0.0%) | 0 (0.0%) |
| 5 to 17 Years | 0 (0.0%) | 0 (0.0%) |
| 18 to 34 Years | 0 (0.0%) | 0 (0.0%) |
| 35 to 64 Years | 0 (0.0%) | 0 (0.0%) |
| 65 to 74 Years | 0 (0.0%) | 10 (3.0%) |
| 75 Years and over | 0 (0.0%) | 0 (0.0%) |
Disability Class: Vision Difficulty
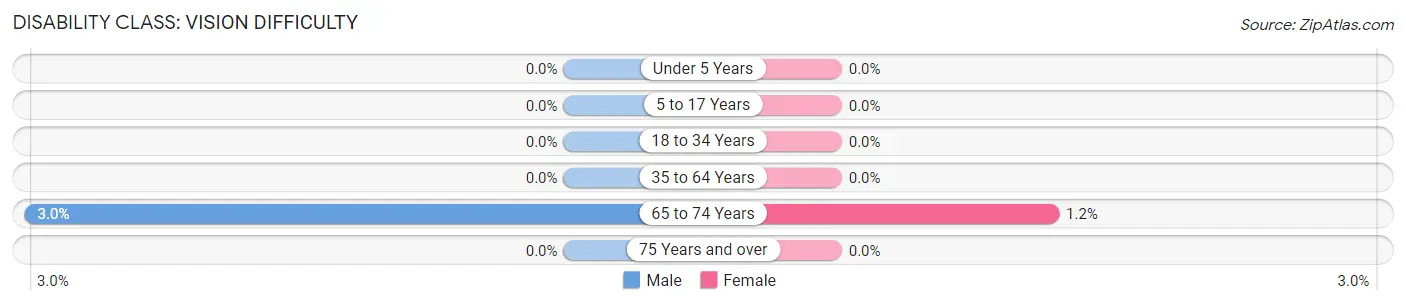
| Age Bracket | Male | Female |
| Under 5 Years | 0 (0.0%) | 0 (0.0%) |
| 5 to 17 Years | 0 (0.0%) | 0 (0.0%) |
| 18 to 34 Years | 0 (0.0%) | 0 (0.0%) |
| 35 to 64 Years | 0 (0.0%) | 0 (0.0%) |
| 65 to 74 Years | 10 (3.0%) | 4 (1.2%) |
| 75 Years and over | 0 (0.0%) | 0 (0.0%) |
Disability Class: Cognitive Difficulty
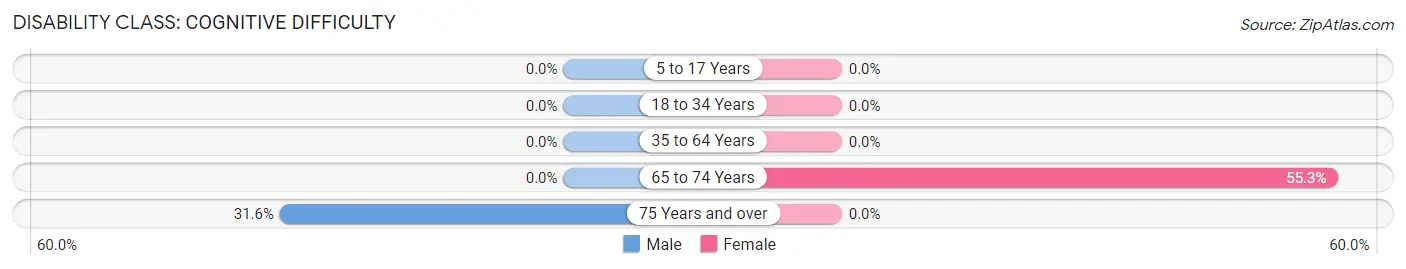
| Age Bracket | Male | Female |
| 5 to 17 Years | 0 (0.0%) | 0 (0.0%) |
| 18 to 34 Years | 0 (0.0%) | 0 (0.0%) |
| 35 to 64 Years | 0 (0.0%) | 0 (0.0%) |
| 65 to 74 Years | 0 (0.0%) | 183 (55.3%) |
| 75 Years and over | 6 (31.6%) | 0 (0.0%) |
Disability Class: Ambulatory Difficulty
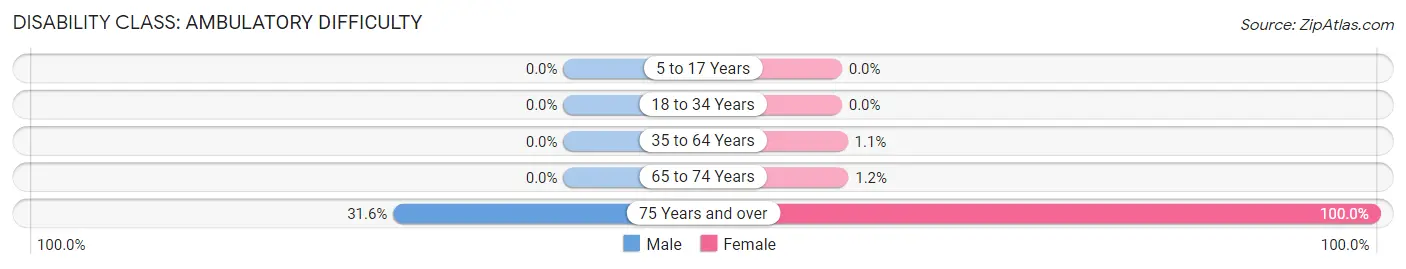
| Age Bracket | Male | Female |
| 5 to 17 Years | 0 (0.0%) | 0 (0.0%) |
| 18 to 34 Years | 0 (0.0%) | 0 (0.0%) |
| 35 to 64 Years | 0 (0.0%) | 5 (1.1%) |
| 65 to 74 Years | 0 (0.0%) | 4 (1.2%) |
| 75 Years and over | 6 (31.6%) | 25 (100.0%) |
Disability Class: Self-Care Difficulty
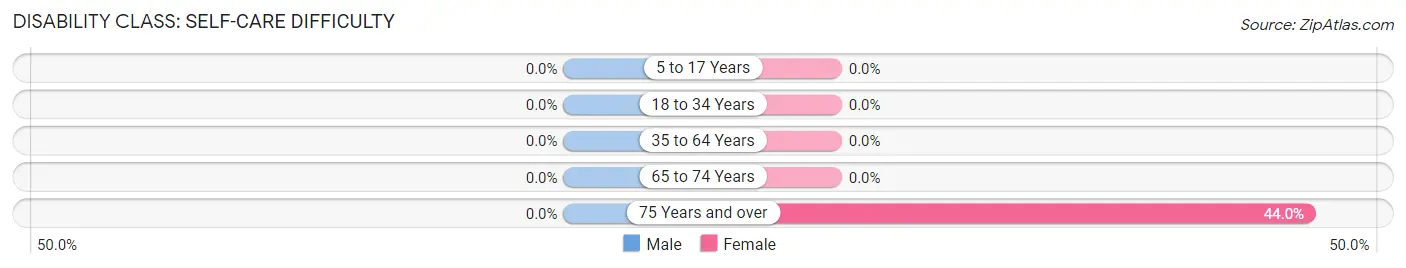
| Age Bracket | Male | Female |
| 5 to 17 Years | 0 (0.0%) | 0 (0.0%) |
| 18 to 34 Years | 0 (0.0%) | 0 (0.0%) |
| 35 to 64 Years | 0 (0.0%) | 0 (0.0%) |
| 65 to 74 Years | 0 (0.0%) | 0 (0.0%) |
| 75 Years and over | 0 (0.0%) | 11 (44.0%) |
Technology Access in West Belmar
Computing Device Access in West Belmar
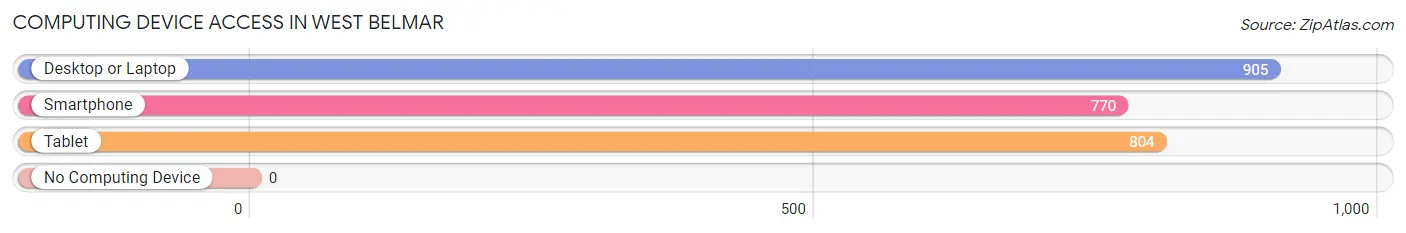
| Device Type | # Households | % Households |
| Desktop or Laptop | 905 | 90.7% |
| Smartphone | 770 | 77.1% |
| Tablet | 804 | 80.6% |
| No Computing Device | 0 | 0.0% |
| Total | 998 | 100.0% |
Internet Access in West Belmar
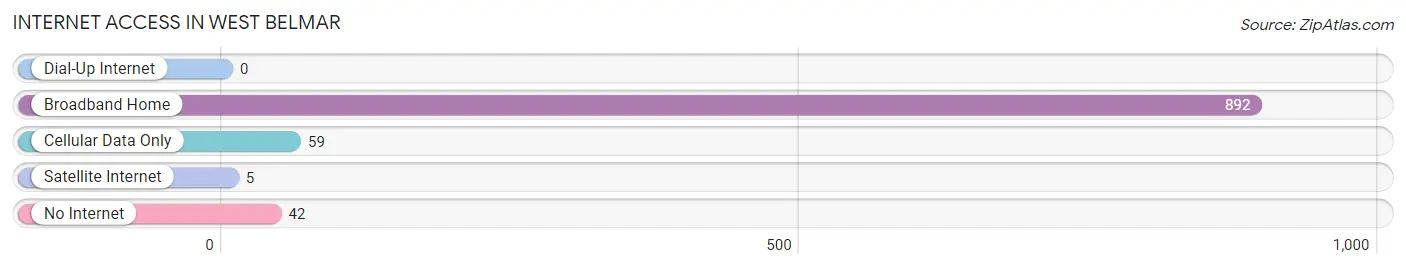
| Internet Type | # Households | % Households |
| Dial-Up Internet | 0 | 0.0% |
| Broadband Home | 892 | 89.4% |
| Cellular Data Only | 59 | 5.9% |
| Satellite Internet | 5 | 0.5% |
| No Internet | 42 | 4.2% |
| Total | 998 | 100.0% |
West Belmar Summary
West Belmar is a small borough located in Monmouth County, New Jersey. It is situated on the banks of the Shark River, and is part of the Jersey Shore region. The borough was incorporated in 1891, and is home to a population of approximately 1,500 people.
Geography
West Belmar is located in the northern part of Monmouth County, New Jersey. It is situated on the banks of the Shark River, and is part of the Jersey Shore region. The borough is bordered by the boroughs of Lake Como, Belmar, and Wall Township. The total area of West Belmar is 0.7 square miles, all of which is land.
The Shark River is the main waterway that runs through West Belmar. It is a tidal river that flows into the Atlantic Ocean. The river is a popular spot for fishing, boating, and other recreational activities.
Climate
West Belmar has a humid subtropical climate, with hot and humid summers and mild winters. The average temperature in the summer is around 75°F, and the average temperature in the winter is around 40°F. The average annual precipitation is around 45 inches.
Demographics
As of the 2010 census, West Belmar had a population of 1,521 people. The racial makeup of the borough was 94.3% White, 2.2% African American, 0.3% Native American, 0.9% Asian, 0.1% Pacific Islander, 0.7% from other races, and 1.5% from two or more races. Hispanic or Latino of any race were 3.2% of the population.
The median household income in West Belmar was $60,938, and the median family income was $68,750. The per capita income was $30,945. About 4.3% of families and 5.3% of the population were below the poverty line, including 6.2% of those under age 18 and 4.2% of those age 65 or over.
Economy
West Belmar is a small borough with a limited economy. The main industries in the area are tourism, retail, and services. The borough is home to several small businesses, including restaurants, shops, and other services.
Tourism is a major part of the economy in West Belmar. The borough is home to several popular beaches, including Belmar Beach, Silver Lake Beach, and Shark River Beach. The beaches are popular destinations for swimming, fishing, and other recreational activities.
The borough also has a few small retail stores, including convenience stores, clothing stores, and gift shops. There are also several restaurants in the area, including Italian, Mexican, and seafood restaurants.
Conclusion
West Belmar is a small borough located in Monmouth County, New Jersey. It is situated on the banks of the Shark River, and is part of the Jersey Shore region. The borough was incorporated in 1891, and is home to a population of approximately 1,500 people. The main industries in the area are tourism, retail, and services. The borough is home to several popular beaches, and is a popular destination for swimming, fishing, and other recreational activities.
Common Questions
What is Per Capita Income in West Belmar?
Per Capita income in West Belmar is $57,860.
What is the Median Family Income in West Belmar?
Median Family Income in West Belmar is $130,125.
What is the Median Household income in West Belmar?
Median Household Income in West Belmar is $108,667.
What is Income or Wage Gap in West Belmar?
Income or Wage Gap in West Belmar is 12.2%.
Women in West Belmar earn 87.8 cents for every dollar earned by a man.
What is Inequality or Gini Index in West Belmar?
Inequality or Gini Index in West Belmar is 0.29.
What is the Total Population of West Belmar?
Total Population of West Belmar is 2,279.
What is the Total Male Population of West Belmar?
Total Male Population of West Belmar is 1,058.
What is the Total Female Population of West Belmar?
Total Female Population of West Belmar is 1,221.
What is the Ratio of Males per 100 Females in West Belmar?
There are 86.65 Males per 100 Females in West Belmar.
What is the Ratio of Females per 100 Males in West Belmar?
There are 115.41 Females per 100 Males in West Belmar.
What is the Median Population Age in West Belmar?
Median Population Age in West Belmar is 50.0 Years.
What is the Average Family Size in West Belmar
Average Family Size in West Belmar is 2.7 People.
What is the Average Household Size in West Belmar
Average Household Size in West Belmar is 2.3 People.
How Large is the Labor Force in West Belmar?
There are 1,315 People in the Labor Forcein in West Belmar.
What is the Percentage of People in the Labor Force in West Belmar?
66.5% of People are in the Labor Force in West Belmar.
What is the Unemployment Rate in West Belmar?
Unemployment Rate in West Belmar is 3.9%.