Cities with the Highest Percentage of Population Employed in Arts, Media & Entertainment in New Jersey
RELATED REPORTS & OPTIONS
Arts, Media & Entertainment
New Jersey
Compare Cities
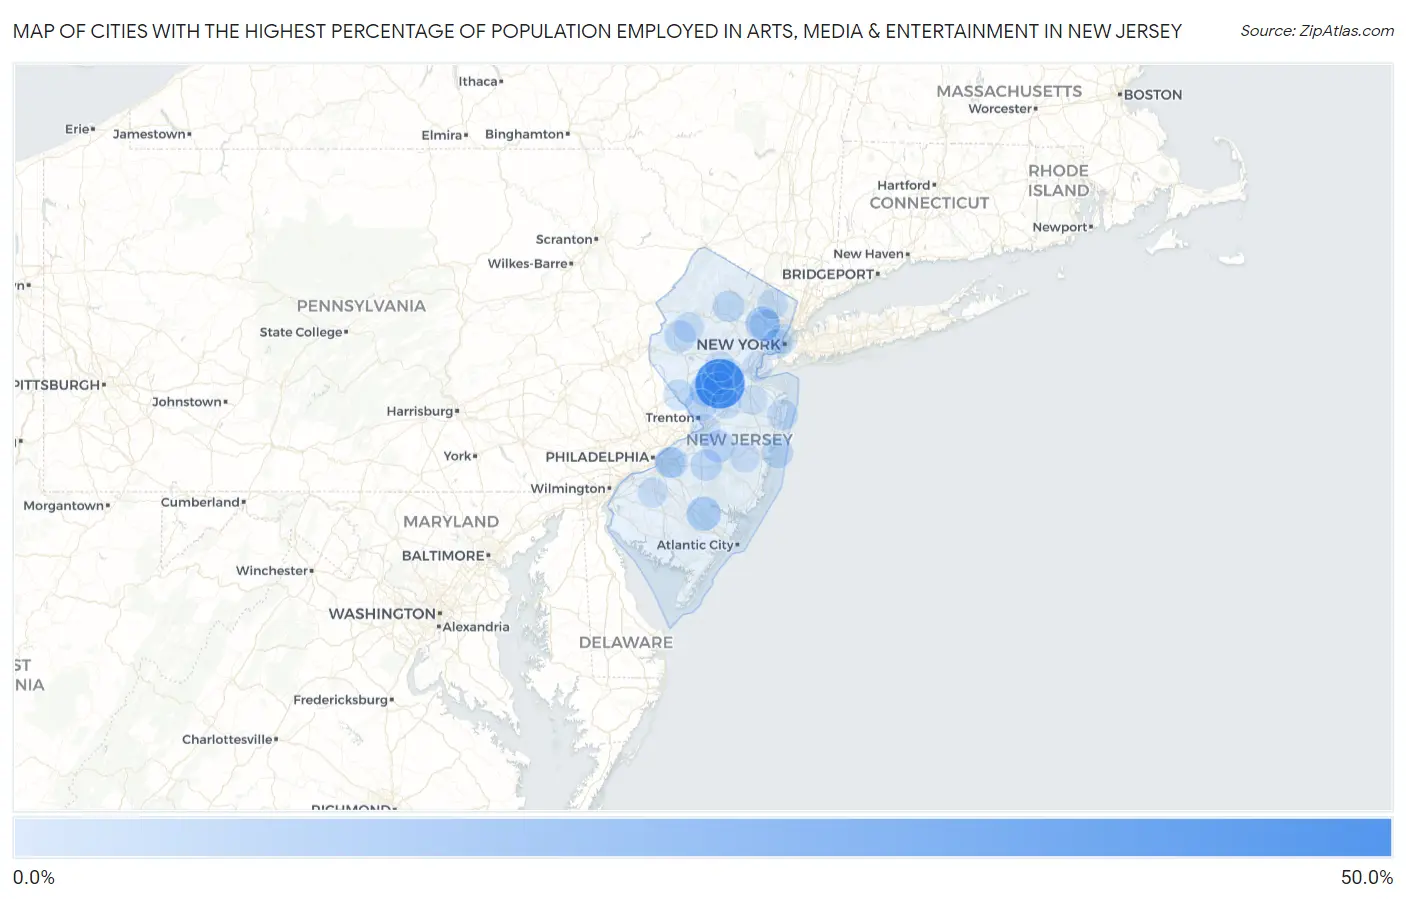
Map of Cities with the Highest Percentage of Population Employed in Arts, Media & Entertainment in New Jersey
0.0%
50.0%
Cities with the Highest Percentage of Population Employed in Arts, Media & Entertainment in New Jersey
| City | % Employed | vs State | vs National | |
| 1. | Pleasant Plains | 40.9% | 2.1%(+38.8)#1 | 2.1%(+38.8)#29 |
| 2. | Elwood | 11.6% | 2.1%(+9.53)#2 | 2.1%(+9.56)#304 |
| 3. | Upper Montclair | 11.3% | 2.1%(+9.20)#3 | 2.1%(+9.23)#313 |
| 4. | Blawenburg | 10.1% | 2.1%(+8.01)#4 | 2.1%(+8.04)#375 |
| 5. | Tavistock Borough | 10.0% | 2.1%(+7.90)#5 | 2.1%(+7.94)#389 |
| 6. | Neshanic | 9.9% | 2.1%(+7.76)#6 | 2.1%(+7.79)#398 |
| 7. | New Vernon | 9.0% | 2.1%(+6.93)#7 | 2.1%(+6.96)#461 |
| 8. | Lavallette Borough | 9.0% | 2.1%(+6.89)#8 | 2.1%(+6.92)#467 |
| 9. | Llewellyn Park | 8.5% | 2.1%(+6.44)#9 | 2.1%(+6.48)#519 |
| 10. | Crosswicks | 8.5% | 2.1%(+6.37)#10 | 2.1%(+6.41)#530 |
| 11. | Farmingdale Borough | 8.4% | 2.1%(+6.29)#11 | 2.1%(+6.32)#540 |
| 12. | Allendale Borough | 8.2% | 2.1%(+6.09)#12 | 2.1%(+6.13)#563 |
| 13. | Goshen | 8.0% | 2.1%(+5.94)#13 | 2.1%(+5.98)#586 |
| 14. | Rocky Hill Borough | 8.0% | 2.1%(+5.90)#14 | 2.1%(+5.94)#593 |
| 15. | Watsessing | 7.8% | 2.1%(+5.74)#15 | 2.1%(+5.78)#616 |
| 16. | Harrisonville | 7.6% | 2.1%(+5.47)#16 | 2.1%(+5.51)#672 |
| 17. | Marshallville | 7.5% | 2.1%(+5.42)#17 | 2.1%(+5.46)#684 |
| 18. | Hopewell Borough | 7.5% | 2.1%(+5.40)#18 | 2.1%(+5.43)#688 |
| 19. | Mcguire Afb | 7.5% | 2.1%(+5.37)#19 | 2.1%(+5.40)#696 |
| 20. | Interlaken Borough | 7.3% | 2.1%(+5.24)#20 | 2.1%(+5.27)#718 |
| 21. | Glen Ridge Borough | 7.1% | 2.1%(+5.04)#21 | 2.1%(+5.08)#766 |
| 22. | Leisuretowne | 7.0% | 2.1%(+4.95)#22 | 2.1%(+4.99)#778 |
| 23. | Lake Telemark | 6.7% | 2.1%(+4.60)#23 | 2.1%(+4.63)#854 |
| 24. | Frenchtown Borough | 6.7% | 2.1%(+4.59)#24 | 2.1%(+4.62)#856 |
| 25. | Anderson | 6.6% | 2.1%(+4.53)#25 | 2.1%(+4.56)#871 |
| 26. | Mantoloking Borough | 6.6% | 2.1%(+4.50)#26 | 2.1%(+4.54)#878 |
| 27. | Lawrenceville | 6.6% | 2.1%(+4.49)#27 | 2.1%(+4.52)#882 |
| 28. | Kingston Estates | 6.5% | 2.1%(+4.45)#28 | 2.1%(+4.48)#894 |
| 29. | Dover Beaches North | 6.5% | 2.1%(+4.40)#29 | 2.1%(+4.43)#909 |
| 30. | Blackwells Mills | 6.5% | 2.1%(+4.39)#30 | 2.1%(+4.43)#912 |
| 31. | Highlands Borough | 6.5% | 2.1%(+4.36)#31 | 2.1%(+4.39)#919 |
| 32. | Brookdale | 6.4% | 2.1%(+4.33)#32 | 2.1%(+4.36)#937 |
| 33. | Roseland Borough | 6.3% | 2.1%(+4.22)#33 | 2.1%(+4.26)#957 |
| 34. | Harrington Park Borough | 6.2% | 2.1%(+4.15)#34 | 2.1%(+4.19)#984 |
| 35. | Packanack Lake | 6.2% | 2.1%(+4.08)#35 | 2.1%(+4.12)#1,000 |
| 36. | Metuchen Borough | 6.0% | 2.1%(+3.91)#36 | 2.1%(+3.94)#1,050 |
| 37. | Lambertville | 5.8% | 2.1%(+3.66)#37 | 2.1%(+3.70)#1,143 |
| 38. | Stockton Borough | 5.6% | 2.1%(+3.52)#38 | 2.1%(+3.56)#1,196 |
| 39. | Monroe Manor | 5.6% | 2.1%(+3.52)#39 | 2.1%(+3.55)#1,199 |
| 40. | Wanamassa | 5.5% | 2.1%(+3.45)#40 | 2.1%(+3.49)#1,240 |
| 41. | West Long Branch Borough | 5.5% | 2.1%(+3.42)#41 | 2.1%(+3.46)#1,256 |
| 42. | Millington | 5.5% | 2.1%(+3.42)#42 | 2.1%(+3.45)#1,258 |
| 43. | New Providence Borough | 5.5% | 2.1%(+3.41)#43 | 2.1%(+3.44)#1,261 |
| 44. | Peapack And Gladstone Borough | 5.3% | 2.1%(+3.25)#44 | 2.1%(+3.29)#1,344 |
| 45. | Silver Lake Cdp Essex County | 5.3% | 2.1%(+3.22)#45 | 2.1%(+3.26)#1,356 |
| 46. | Ellisburg | 5.3% | 2.1%(+3.17)#46 | 2.1%(+3.21)#1,379 |
| 47. | Audubon Borough | 5.3% | 2.1%(+3.16)#47 | 2.1%(+3.19)#1,391 |
| 48. | Pluckemin | 5.2% | 2.1%(+3.12)#48 | 2.1%(+3.16)#1,406 |
| 49. | Glen Rock Borough | 5.2% | 2.1%(+3.12)#49 | 2.1%(+3.15)#1,408 |
| 50. | Grenloch | 5.2% | 2.1%(+3.07)#50 | 2.1%(+3.11)#1,429 |
| 51. | Beach Haven Borough | 5.2% | 2.1%(+3.07)#51 | 2.1%(+3.10)#1,430 |
| 52. | Ridgewood | 5.2% | 2.1%(+3.07)#52 | 2.1%(+3.10)#1,431 |
| 53. | Chester Borough | 5.2% | 2.1%(+3.06)#53 | 2.1%(+3.10)#1,435 |
| 54. | Rutherford Borough | 5.1% | 2.1%(+2.99)#54 | 2.1%(+3.03)#1,469 |
| 55. | Pennington Borough | 5.0% | 2.1%(+2.93)#55 | 2.1%(+2.97)#1,498 |
| 56. | Bedminster | 5.0% | 2.1%(+2.89)#56 | 2.1%(+2.92)#1,533 |
| 57. | Sussex Borough | 5.0% | 2.1%(+2.87)#57 | 2.1%(+2.90)#1,550 |
| 58. | Brielle Borough | 4.9% | 2.1%(+2.81)#58 | 2.1%(+2.84)#1,576 |
| 59. | Ten Mile Run | 4.9% | 2.1%(+2.77)#59 | 2.1%(+2.81)#1,603 |
| 60. | Brookside | 4.8% | 2.1%(+2.75)#60 | 2.1%(+2.78)#1,618 |
| 61. | Ramapo College Of New Jersey | 4.8% | 2.1%(+2.67)#61 | 2.1%(+2.71)#1,667 |
| 62. | Tenafly Borough | 4.7% | 2.1%(+2.64)#62 | 2.1%(+2.68)#1,690 |
| 63. | Longport Borough | 4.7% | 2.1%(+2.63)#63 | 2.1%(+2.67)#1,694 |
| 64. | Hasbrouck Heights Borough | 4.7% | 2.1%(+2.62)#64 | 2.1%(+2.65)#1,712 |
| 65. | Wood Ridge Borough | 4.7% | 2.1%(+2.57)#65 | 2.1%(+2.61)#1,739 |
| 66. | South Dennis | 4.7% | 2.1%(+2.56)#66 | 2.1%(+2.59)#1,750 |
| 67. | Leonia Borough | 4.6% | 2.1%(+2.48)#67 | 2.1%(+2.52)#1,799 |
| 68. | Great Notch | 4.6% | 2.1%(+2.46)#68 | 2.1%(+2.49)#1,810 |
| 69. | Beattystown | 4.5% | 2.1%(+2.44)#69 | 2.1%(+2.47)#1,834 |
| 70. | Red Bank Borough | 4.5% | 2.1%(+2.43)#70 | 2.1%(+2.47)#1,837 |
| 71. | Carlstadt Borough | 4.5% | 2.1%(+2.43)#71 | 2.1%(+2.46)#1,841 |
| 72. | Crestwood Village | 4.5% | 2.1%(+2.42)#72 | 2.1%(+2.46)#1,842 |
| 73. | Port Reading | 4.5% | 2.1%(+2.41)#73 | 2.1%(+2.45)#1,850 |
| 74. | Preakness | 4.5% | 2.1%(+2.37)#74 | 2.1%(+2.41)#1,879 |
| 75. | Cranbury | 4.4% | 2.1%(+2.33)#75 | 2.1%(+2.36)#1,909 |
| 76. | Somerset | 4.4% | 2.1%(+2.31)#76 | 2.1%(+2.34)#1,922 |
| 77. | Dividing Creek | 4.4% | 2.1%(+2.31)#77 | 2.1%(+2.34)#1,924 |
| 78. | Pitman Borough | 4.4% | 2.1%(+2.30)#78 | 2.1%(+2.33)#1,937 |
| 79. | Island Heights Borough | 4.3% | 2.1%(+2.24)#79 | 2.1%(+2.28)#1,979 |
| 80. | Bordentown | 4.3% | 2.1%(+2.22)#80 | 2.1%(+2.25)#1,990 |
| 81. | Hoboken | 4.2% | 2.1%(+2.15)#81 | 2.1%(+2.18)#2,041 |
| 82. | Finderne | 4.2% | 2.1%(+2.14)#82 | 2.1%(+2.17)#2,049 |
| 83. | Richwood | 4.2% | 2.1%(+2.12)#83 | 2.1%(+2.16)#2,055 |
| 84. | Upper Saddle River Borough | 4.2% | 2.1%(+2.11)#84 | 2.1%(+2.15)#2,069 |
| 85. | Jersey City | 4.1% | 2.1%(+2.04)#85 | 2.1%(+2.08)#2,139 |
| 86. | Surf City Borough | 4.1% | 2.1%(+1.99)#86 | 2.1%(+2.02)#2,179 |
| 87. | The College Of New Jersey | 4.0% | 2.1%(+1.95)#87 | 2.1%(+1.99)#2,220 |
| 88. | Califon Borough | 4.0% | 2.1%(+1.94)#88 | 2.1%(+1.97)#2,233 |
| 89. | Robertsville | 4.0% | 2.1%(+1.90)#89 | 2.1%(+1.94)#2,274 |
| 90. | Absecon Highlands | 4.0% | 2.1%(+1.89)#90 | 2.1%(+1.93)#2,280 |
| 91. | Far Hills Borough | 4.0% | 2.1%(+1.86)#91 | 2.1%(+1.89)#2,318 |
| 92. | Allenhurst Borough | 3.9% | 2.1%(+1.83)#92 | 2.1%(+1.87)#2,335 |
| 93. | Titusville | 3.9% | 2.1%(+1.80)#93 | 2.1%(+1.84)#2,371 |
| 94. | Saddle River Borough | 3.9% | 2.1%(+1.80)#94 | 2.1%(+1.83)#2,374 |
| 95. | Demarest Borough | 3.9% | 2.1%(+1.78)#95 | 2.1%(+1.82)#2,387 |
| 96. | Milford Borough | 3.9% | 2.1%(+1.78)#96 | 2.1%(+1.82)#2,389 |
| 97. | Riverdale Borough | 3.8% | 2.1%(+1.71)#97 | 2.1%(+1.74)#2,459 |
| 98. | Regency At Monroe | 3.8% | 2.1%(+1.70)#98 | 2.1%(+1.73)#2,477 |
| 99. | Mount Arlington Borough | 3.8% | 2.1%(+1.70)#99 | 2.1%(+1.73)#2,482 |
| 100. | Forsgate | 3.8% | 2.1%(+1.66)#100 | 2.1%(+1.70)#2,524 |
Common Questions
What are the Top 10 Cities with the Highest Percentage of Population Employed in Arts, Media & Entertainment in New Jersey?
Top 10 Cities with the Highest Percentage of Population Employed in Arts, Media & Entertainment in New Jersey are:
#1
40.9%
#2
11.6%
#3
11.3%
#4
10.1%
#5
7.5%
#6
7.0%
#7
6.7%
#8
6.6%
#9
6.6%
#10
6.5%
What city has the Highest Percentage of Population Employed in Arts, Media & Entertainment in New Jersey?
Pleasant Plains has the Highest Percentage of Population Employed in Arts, Media & Entertainment in New Jersey with 40.9%.
What is the Percentage of Population Employed in Arts, Media & Entertainment in the State of New Jersey?
Percentage of Population Employed in Arts, Media & Entertainment in New Jersey is 2.1%.
What is the Percentage of Population Employed in Arts, Media & Entertainment in the United States?
Percentage of Population Employed in Arts, Media & Entertainment in the United States is 2.1%.