Cities with the Highest Percentage of Population Enrolled in Kindergarten in New Jersey
RELATED REPORTS & OPTIONS
Kindergarten
New Jersey
Compare Cities
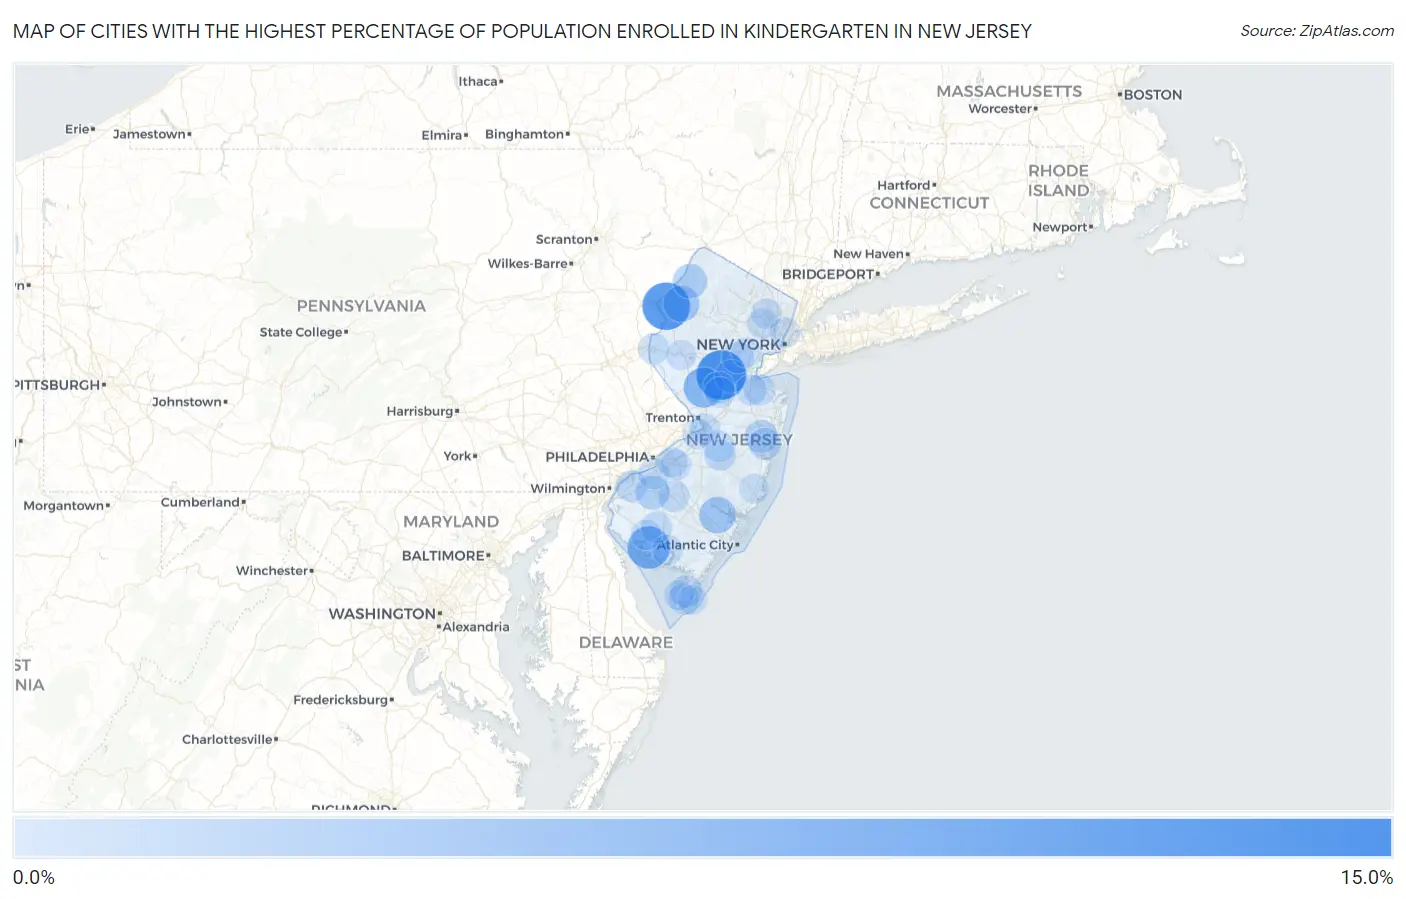
Map of Cities with the Highest Percentage of Population Enrolled in Kindergarten in New Jersey
0.0%
15.0%
Cities with the Highest Percentage of Population Enrolled in Kindergarten in New Jersey
| City | % in Kindergarten | vs State | vs National | |
| 1. | East Millstone | 10.7% | 1.3%(+9.35)#1 | 1.3%(+9.40)#141 |
| 2. | Hainesburg | 9.7% | 1.3%(+8.44)#2 | 1.3%(+8.49)#183 |
| 3. | Sheppards Mill | 8.2% | 1.3%(+6.91)#3 | 1.3%(+6.97)#286 |
| 4. | Cedarville | 7.5% | 1.3%(+6.19)#4 | 1.3%(+6.24)#348 |
| 5. | Richland | 7.3% | 1.3%(+6.03)#5 | 1.3%(+6.08)#364 |
| 6. | Milmay | 7.0% | 1.3%(+5.70)#6 | 1.3%(+5.75)#402 |
| 7. | Windsor | 6.7% | 1.3%(+5.40)#7 | 1.3%(+5.46)#448 |
| 8. | Mount Royal | 6.7% | 1.3%(+5.38)#8 | 1.3%(+5.44)#449 |
| 9. | Skillman | 6.4% | 1.3%(+5.09)#9 | 1.3%(+5.15)#497 |
| 10. | Keasbey | 4.8% | 1.3%(+3.48)#10 | 1.3%(+3.53)#946 |
| 11. | Laurel Heights | 4.8% | 1.3%(+3.47)#11 | 1.3%(+3.52)#948 |
| 12. | Egg Harbor City | 4.7% | 1.3%(+3.39)#12 | 1.3%(+3.44)#975 |
| 13. | Beesleys Point | 4.7% | 1.3%(+3.35)#13 | 1.3%(+3.40)#994 |
| 14. | Marksboro | 4.6% | 1.3%(+3.30)#14 | 1.3%(+3.35)#1,021 |
| 15. | Penns Grove Borough | 4.6% | 1.3%(+3.28)#15 | 1.3%(+3.34)#1,027 |
| 16. | Bargaintown | 4.5% | 1.3%(+3.22)#16 | 1.3%(+3.27)#1,058 |
| 17. | Cedar Knolls | 4.5% | 1.3%(+3.22)#17 | 1.3%(+3.27)#1,060 |
| 18. | Auburn | 4.3% | 1.3%(+3.04)#18 | 1.3%(+3.09)#1,166 |
| 19. | Crandon Lakes | 3.9% | 1.3%(+2.55)#19 | 1.3%(+2.61)#1,500 |
| 20. | Lavallette Borough | 3.7% | 1.3%(+2.36)#20 | 1.3%(+2.41)#1,694 |
| 21. | Dividing Creek | 3.7% | 1.3%(+2.36)#21 | 1.3%(+2.41)#1,700 |
| 22. | Ho Ho Kus Borough | 3.6% | 1.3%(+2.31)#22 | 1.3%(+2.37)#1,741 |
| 23. | Richwood | 3.6% | 1.3%(+2.25)#23 | 1.3%(+2.30)#1,809 |
| 24. | Port Morris | 3.3% | 1.3%(+2.04)#24 | 1.3%(+2.10)#2,040 |
| 25. | Hopewell Borough | 3.3% | 1.3%(+2.03)#25 | 1.3%(+2.09)#2,054 |
| 26. | Seaville | 3.3% | 1.3%(+1.97)#26 | 1.3%(+2.03)#2,131 |
| 27. | Lakewood | 3.3% | 1.3%(+1.96)#27 | 1.3%(+2.01)#2,154 |
| 28. | East Franklin | 3.1% | 1.3%(+1.81)#28 | 1.3%(+1.87)#2,370 |
| 29. | Newfield Borough | 3.1% | 1.3%(+1.80)#29 | 1.3%(+1.85)#2,389 |
| 30. | Whitesboro | 3.0% | 1.3%(+1.72)#30 | 1.3%(+1.77)#2,512 |
| 31. | South River Borough | 3.0% | 1.3%(+1.70)#31 | 1.3%(+1.75)#2,546 |
| 32. | Palermo | 2.9% | 1.3%(+1.64)#32 | 1.3%(+1.69)#2,654 |
| 33. | Packanack Lake | 2.9% | 1.3%(+1.62)#33 | 1.3%(+1.68)#2,683 |
| 34. | Leisure Village | 2.8% | 1.3%(+1.52)#34 | 1.3%(+1.57)#2,918 |
| 35. | Preakness | 2.7% | 1.3%(+1.42)#35 | 1.3%(+1.48)#3,108 |
| 36. | Monmouth Beach Borough | 2.7% | 1.3%(+1.41)#36 | 1.3%(+1.46)#3,134 |
| 37. | Plainfield | 2.7% | 1.3%(+1.40)#37 | 1.3%(+1.46)#3,150 |
| 38. | Gillette | 2.7% | 1.3%(+1.40)#38 | 1.3%(+1.45)#3,153 |
| 39. | Beckett | 2.7% | 1.3%(+1.37)#39 | 1.3%(+1.43)#3,210 |
| 40. | West Cape May Borough | 2.7% | 1.3%(+1.37)#40 | 1.3%(+1.42)#3,221 |
| 41. | Ten Mile Run | 2.7% | 1.3%(+1.36)#41 | 1.3%(+1.41)#3,244 |
| 42. | Menlo Park Terrace | 2.7% | 1.3%(+1.35)#42 | 1.3%(+1.40)#3,272 |
| 43. | Waldwick Borough | 2.6% | 1.3%(+1.33)#43 | 1.3%(+1.39)#3,307 |
| 44. | Tenafly Borough | 2.6% | 1.3%(+1.30)#44 | 1.3%(+1.36)#3,389 |
| 45. | Interlaken Borough | 2.6% | 1.3%(+1.27)#45 | 1.3%(+1.32)#3,471 |
| 46. | Rosenhayn | 2.6% | 1.3%(+1.26)#46 | 1.3%(+1.32)#3,487 |
| 47. | Mcguire Afb | 2.6% | 1.3%(+1.26)#47 | 1.3%(+1.31)#3,490 |
| 48. | Magnolia Borough | 2.6% | 1.3%(+1.25)#48 | 1.3%(+1.31)#3,507 |
| 49. | Lawnside Borough | 2.5% | 1.3%(+1.24)#49 | 1.3%(+1.29)#3,553 |
| 50. | Williamstown | 2.5% | 1.3%(+1.24)#50 | 1.3%(+1.29)#3,554 |
| 51. | Strathmore | 2.5% | 1.3%(+1.22)#51 | 1.3%(+1.27)#3,629 |
| 52. | Woodbury | 2.5% | 1.3%(+1.19)#52 | 1.3%(+1.24)#3,697 |
| 53. | Browns Mills | 2.5% | 1.3%(+1.18)#53 | 1.3%(+1.23)#3,720 |
| 54. | Erma | 2.5% | 1.3%(+1.17)#54 | 1.3%(+1.22)#3,744 |
| 55. | Franklin Borough | 2.5% | 1.3%(+1.16)#55 | 1.3%(+1.21)#3,780 |
| 56. | Bradley Beach Borough | 2.4% | 1.3%(+1.13)#56 | 1.3%(+1.19)#3,858 |
| 57. | Brownville | 2.4% | 1.3%(+1.08)#57 | 1.3%(+1.13)#4,046 |
| 58. | Pines Lake | 2.4% | 1.3%(+1.06)#58 | 1.3%(+1.11)#4,109 |
| 59. | Upper Pohatcong | 2.4% | 1.3%(+1.06)#59 | 1.3%(+1.11)#4,124 |
| 60. | Sea Bright Borough | 2.4% | 1.3%(+1.05)#60 | 1.3%(+1.11)#4,136 |
| 61. | Cologne | 2.3% | 1.3%(+1.04)#61 | 1.3%(+1.09)#4,183 |
| 62. | Demarest Borough | 2.3% | 1.3%(+1.04)#62 | 1.3%(+1.09)#4,191 |
| 63. | Shiloh Borough | 2.3% | 1.3%(+1.04)#63 | 1.3%(+1.09)#4,195 |
| 64. | Little Ferry Borough | 2.3% | 1.3%(+1.03)#64 | 1.3%(+1.09)#4,207 |
| 65. | Thorofare | 2.3% | 1.3%(+0.998)#65 | 1.3%(+1.05)#4,329 |
| 66. | Heathcote | 2.3% | 1.3%(+0.985)#66 | 1.3%(+1.04)#4,370 |
| 67. | Robbinsville Center | 2.3% | 1.3%(+0.980)#67 | 1.3%(+1.03)#4,385 |
| 68. | Roebling | 2.3% | 1.3%(+0.969)#68 | 1.3%(+1.02)#4,412 |
| 69. | Bordentown | 2.3% | 1.3%(+0.963)#69 | 1.3%(+1.02)#4,425 |
| 70. | Laurel Lake | 2.3% | 1.3%(+0.959)#70 | 1.3%(+1.01)#4,441 |
| 71. | Deal Borough | 2.3% | 1.3%(+0.947)#71 | 1.3%(+1.000)#4,487 |
| 72. | Goshen | 2.2% | 1.3%(+0.943)#72 | 1.3%(+0.996)#4,501 |
| 73. | Bogota Borough | 2.2% | 1.3%(+0.923)#73 | 1.3%(+0.977)#4,582 |
| 74. | Red Bank Borough | 2.2% | 1.3%(+0.921)#74 | 1.3%(+0.974)#4,588 |
| 75. | Upper Montclair | 2.2% | 1.3%(+0.900)#75 | 1.3%(+0.953)#4,684 |
| 76. | Llewellyn Park | 2.2% | 1.3%(+0.898)#76 | 1.3%(+0.952)#4,689 |
| 77. | Paterson | 2.2% | 1.3%(+0.888)#77 | 1.3%(+0.941)#4,731 |
| 78. | Bridgeton | 2.2% | 1.3%(+0.866)#78 | 1.3%(+0.919)#4,831 |
| 79. | Gouldtown | 2.2% | 1.3%(+0.856)#79 | 1.3%(+0.909)#4,871 |
| 80. | Clinton | 2.2% | 1.3%(+0.851)#80 | 1.3%(+0.905)#4,885 |
| 81. | Kenilworth Borough | 2.2% | 1.3%(+0.846)#81 | 1.3%(+0.899)#4,912 |
| 82. | Bloomsbury Borough | 2.1% | 1.3%(+0.839)#82 | 1.3%(+0.892)#4,945 |
| 83. | West New York | 2.1% | 1.3%(+0.835)#83 | 1.3%(+0.888)#4,954 |
| 84. | Bound Brook Borough | 2.1% | 1.3%(+0.831)#84 | 1.3%(+0.884)#4,966 |
| 85. | Sicklerville | 2.1% | 1.3%(+0.825)#85 | 1.3%(+0.878)#4,984 |
| 86. | Greentree | 2.1% | 1.3%(+0.820)#86 | 1.3%(+0.874)#5,007 |
| 87. | Upper Saddle River Borough | 2.1% | 1.3%(+0.806)#87 | 1.3%(+0.859)#5,066 |
| 88. | Stirling | 2.1% | 1.3%(+0.784)#88 | 1.3%(+0.837)#5,166 |
| 89. | Kingston Estates | 2.0% | 1.3%(+0.738)#89 | 1.3%(+0.791)#5,356 |
| 90. | Villas | 2.0% | 1.3%(+0.719)#90 | 1.3%(+0.773)#5,441 |
| 91. | Buena Borough | 2.0% | 1.3%(+0.713)#91 | 1.3%(+0.766)#5,468 |
| 92. | Merchantville Borough | 2.0% | 1.3%(+0.709)#92 | 1.3%(+0.762)#5,491 |
| 93. | Alpha Borough | 2.0% | 1.3%(+0.686)#93 | 1.3%(+0.739)#5,603 |
| 94. | Ocean Acres | 2.0% | 1.3%(+0.683)#94 | 1.3%(+0.736)#5,610 |
| 95. | Hopatcong Borough | 2.0% | 1.3%(+0.678)#95 | 1.3%(+0.731)#5,630 |
| 96. | Gibbsboro Borough | 2.0% | 1.3%(+0.674)#96 | 1.3%(+0.727)#5,657 |
| 97. | Rockaway Borough | 2.0% | 1.3%(+0.673)#97 | 1.3%(+0.726)#5,663 |
| 98. | Westfield | 2.0% | 1.3%(+0.665)#98 | 1.3%(+0.718)#5,711 |
| 99. | Flemington Borough | 2.0% | 1.3%(+0.661)#99 | 1.3%(+0.714)#5,737 |
| 100. | Wildwood | 2.0% | 1.3%(+0.648)#100 | 1.3%(+0.701)#5,799 |
Common Questions
What are the Top 10 Cities with the Highest Percentage of Population Enrolled in Kindergarten in New Jersey?
Top 10 Cities with the Highest Percentage of Population Enrolled in Kindergarten in New Jersey are:
#1
10.7%
#2
9.7%
#3
7.5%
#4
6.4%
#5
4.7%
#6
4.6%
#7
3.9%
#8
3.6%
#9
3.3%
#10
3.1%
What city has the Highest Percentage of Population Enrolled in Kindergarten in New Jersey?
East Millstone has the Highest Percentage of Population Enrolled in Kindergarten in New Jersey with 10.7%.
What is the Percentage of Population Enrolled in Kindergarten in the State of New Jersey?
Percentage of Population Enrolled in Kindergarten in New Jersey is 1.3%.
What is the Percentage of Population Enrolled in Kindergarten in the United States?
Percentage of Population Enrolled in Kindergarten in the United States is 1.3%.