Cities with the Most Immigrants from Caribbean in New Jersey
RELATED REPORTS & OPTIONS
Caribbean
New Jersey
Compare Cities
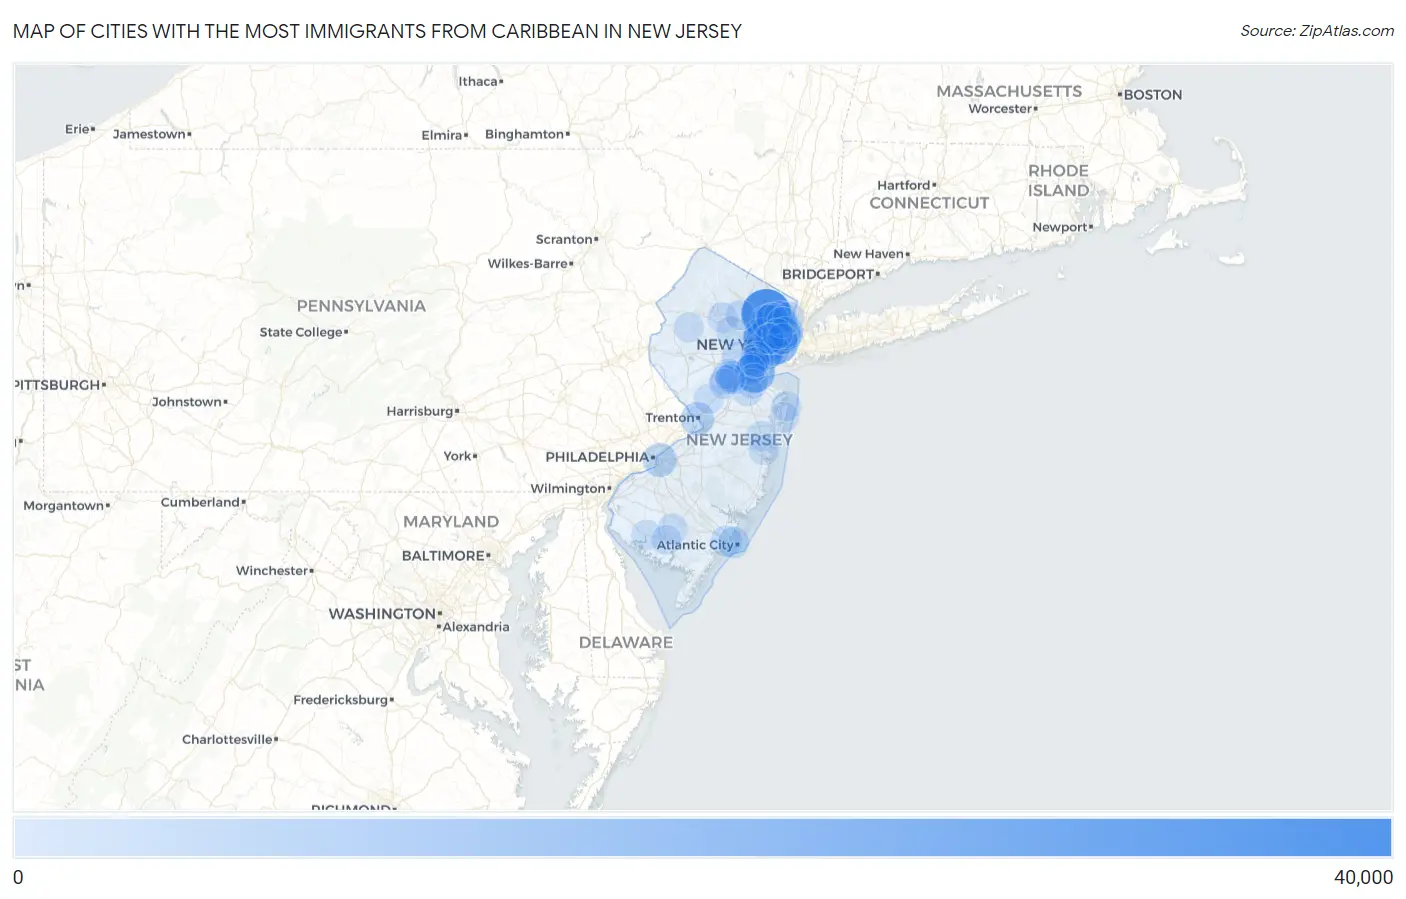
Map of Cities with the Most Immigrants from Caribbean in New Jersey
0
40,000
Cities with the Most Immigrants from Caribbean in New Jersey
| City | Caribbean | vs State | vs National | |
| 1. | Paterson | 36,182 | 382,885(9.45%)#1 | 4,544,093(0.80%)#6 |
| 2. | Newark | 24,409 | 382,885(6.38%)#2 | 4,544,093(0.54%)#15 |
| 3. | Jersey City | 19,398 | 382,885(5.07%)#3 | 4,544,093(0.43%)#27 |
| 4. | Perth Amboy | 17,810 | 382,885(4.65%)#4 | 4,544,093(0.39%)#33 |
| 5. | Elizabeth | 16,821 | 382,885(4.39%)#5 | 4,544,093(0.37%)#36 |
| 6. | Union City | 13,518 | 382,885(3.53%)#6 | 4,544,093(0.30%)#50 |
| 7. | Passaic | 11,709 | 382,885(3.06%)#7 | 4,544,093(0.26%)#64 |
| 8. | East Orange | 11,676 | 382,885(3.05%)#8 | 4,544,093(0.26%)#65 |
| 9. | West New York | 11,098 | 382,885(2.90%)#9 | 4,544,093(0.24%)#67 |
| 10. | Camden | 6,918 | 382,885(1.81%)#10 | 4,544,093(0.15%)#93 |
| 11. | Trenton | 6,234 | 382,885(1.63%)#11 | 4,544,093(0.14%)#104 |
| 12. | Clifton | 5,874 | 382,885(1.53%)#12 | 4,544,093(0.13%)#112 |
| 13. | New Brunswick | 5,046 | 382,885(1.32%)#13 | 4,544,093(0.11%)#130 |
| 14. | Hackensack | 4,716 | 382,885(1.23%)#14 | 4,544,093(0.10%)#135 |
| 15. | Bayonne | 3,628 | 382,885(0.95%)#15 | 4,544,093(0.08%)#152 |
| 16. | Linden | 3,331 | 382,885(0.87%)#16 | 4,544,093(0.07%)#159 |
| 17. | Plainfield | 3,252 | 382,885(0.85%)#17 | 4,544,093(0.07%)#163 |
| 18. | Garfield | 3,229 | 382,885(0.84%)#18 | 4,544,093(0.07%)#165 |
| 19. | Roselle Borough | 3,067 | 382,885(0.80%)#19 | 4,544,093(0.07%)#178 |
| 20. | Englewood | 2,865 | 382,885(0.75%)#20 | 4,544,093(0.06%)#184 |
| 21. | Pleasantville | 2,635 | 382,885(0.69%)#21 | 4,544,093(0.06%)#197 |
| 22. | Atlantic City | 2,356 | 382,885(0.62%)#22 | 4,544,093(0.05%)#218 |
| 23. | Kearny | 2,284 | 382,885(0.60%)#23 | 4,544,093(0.05%)#223 |
| 24. | Guttenberg | 2,204 | 382,885(0.58%)#24 | 4,544,093(0.05%)#232 |
| 25. | Sayreville Borough | 2,128 | 382,885(0.56%)#25 | 4,544,093(0.05%)#244 |
| 26. | East Franklin | 2,072 | 382,885(0.54%)#26 | 4,544,093(0.05%)#252 |
| 27. | Bergenfield Borough | 1,934 | 382,885(0.51%)#27 | 4,544,093(0.04%)#263 |
| 28. | Cliffside Park Borough | 1,839 | 382,885(0.48%)#28 | 4,544,093(0.04%)#273 |
| 29. | Rahway | 1,825 | 382,885(0.48%)#29 | 4,544,093(0.04%)#276 |
| 30. | Ridgefield Park | 1,769 | 382,885(0.46%)#30 | 4,544,093(0.04%)#283 |
| 31. | Elmwood Park Borough | 1,600 | 382,885(0.42%)#31 | 4,544,093(0.04%)#299 |
| 32. | Lodi Borough | 1,589 | 382,885(0.42%)#32 | 4,544,093(0.03%)#303 |
| 33. | Fairview Borough | 1,483 | 382,885(0.39%)#33 | 4,544,093(0.03%)#317 |
| 34. | Carteret Borough | 1,302 | 382,885(0.34%)#34 | 4,544,093(0.03%)#344 |
| 35. | North Plainfield Borough | 1,272 | 382,885(0.33%)#35 | 4,544,093(0.03%)#352 |
| 36. | Vineland | 1,213 | 382,885(0.32%)#36 | 4,544,093(0.03%)#366 |
| 37. | Bogota Borough | 1,076 | 382,885(0.28%)#37 | 4,544,093(0.02%)#401 |
| 38. | Fair Lawn Borough | 989 | 382,885(0.26%)#38 | 4,544,093(0.02%)#421 |
| 39. | Fort Lee Borough | 939 | 382,885(0.25%)#39 | 4,544,093(0.02%)#442 |
| 40. | Hawthorne Borough | 919 | 382,885(0.24%)#40 | 4,544,093(0.02%)#447 |
| 41. | Lakewood | 909 | 382,885(0.24%)#41 | 4,544,093(0.02%)#452 |
| 42. | Lindenwold Borough | 864 | 382,885(0.23%)#42 | 4,544,093(0.02%)#467 |
| 43. | Haledon Borough | 862 | 382,885(0.23%)#43 | 4,544,093(0.02%)#470 |
| 44. | Hoboken | 850 | 382,885(0.22%)#44 | 4,544,093(0.02%)#473 |
| 45. | Woodbridge | 816 | 382,885(0.21%)#45 | 4,544,093(0.02%)#486 |
| 46. | Harrison | 802 | 382,885(0.21%)#46 | 4,544,093(0.02%)#495 |
| 47. | Prospect Park Borough | 797 | 382,885(0.21%)#47 | 4,544,093(0.02%)#497 |
| 48. | Somerset | 782 | 382,885(0.20%)#48 | 4,544,093(0.02%)#501 |
| 49. | Dover | 782 | 382,885(0.20%)#49 | 4,544,093(0.02%)#503 |
| 50. | New Milford Borough | 774 | 382,885(0.20%)#50 | 4,544,093(0.02%)#509 |
| 51. | Hasbrouck Heights Borough | 754 | 382,885(0.20%)#51 | 4,544,093(0.02%)#517 |
| 52. | Union | 752 | 382,885(0.20%)#52 | 4,544,093(0.02%)#519 |
| 53. | Secaucus | 700 | 382,885(0.18%)#53 | 4,544,093(0.02%)#547 |
| 54. | Toms River | 696 | 382,885(0.18%)#54 | 4,544,093(0.02%)#550 |
| 55. | Asbury Park | 691 | 382,885(0.18%)#55 | 4,544,093(0.02%)#553 |
| 56. | Little Ferry Borough | 688 | 382,885(0.18%)#56 | 4,544,093(0.02%)#559 |
| 57. | Dumont Borough | 675 | 382,885(0.18%)#57 | 4,544,093(0.01%)#563 |
| 58. | Sicklerville | 646 | 382,885(0.17%)#58 | 4,544,093(0.01%)#576 |
| 59. | Fords | 617 | 382,885(0.16%)#59 | 4,544,093(0.01%)#595 |
| 60. | North Arlington Borough | 580 | 382,885(0.15%)#60 | 4,544,093(0.01%)#619 |
| 61. | Watsessing | 562 | 382,885(0.15%)#61 | 4,544,093(0.01%)#625 |
| 62. | Bridgeton | 538 | 382,885(0.14%)#62 | 4,544,093(0.01%)#645 |
| 63. | Princeton | 517 | 382,885(0.14%)#63 | 4,544,093(0.01%)#659 |
| 64. | Keasbey | 484 | 382,885(0.13%)#64 | 4,544,093(0.01%)#684 |
| 65. | Roselle Park Borough | 474 | 382,885(0.12%)#65 | 4,544,093(0.01%)#694 |
| 66. | Old Bridge | 463 | 382,885(0.12%)#66 | 4,544,093(0.01%)#710 |
| 67. | South Plainfield Borough | 445 | 382,885(0.12%)#67 | 4,544,093(0.01%)#731 |
| 68. | Madison Park | 444 | 382,885(0.12%)#68 | 4,544,093(0.01%)#732 |
| 69. | Palisades Park Borough | 442 | 382,885(0.12%)#69 | 4,544,093(0.01%)#734 |
| 70. | Long Branch | 419 | 382,885(0.11%)#70 | 4,544,093(0.01%)#773 |
| 71. | South Amboy | 416 | 382,885(0.11%)#71 | 4,544,093(0.01%)#776 |
| 72. | River Edge Borough | 414 | 382,885(0.11%)#72 | 4,544,093(0.01%)#777 |
| 73. | Silver Lake Cdp Essex County | 408 | 382,885(0.11%)#73 | 4,544,093(0.01%)#787 |
| 74. | Six Mile Run | 390 | 382,885(0.10%)#74 | 4,544,093(0.01%)#812 |
| 75. | Ampere North | 384 | 382,885(0.10%)#75 | 4,544,093(0.01%)#823 |
| 76. | Somerville Borough | 380 | 382,885(0.10%)#76 | 4,544,093(0.01%)#828 |
| 77. | Rutherford Borough | 377 | 382,885(0.10%)#77 | 4,544,093(0.01%)#831 |
| 78. | Ridgefield Borough | 377 | 382,885(0.10%)#78 | 4,544,093(0.01%)#832 |
| 79. | Franklin Park | 373 | 382,885(0.10%)#79 | 4,544,093(0.01%)#840 |
| 80. | Morristown | 361 | 382,885(0.09%)#80 | 4,544,093(0.01%)#863 |
| 81. | Avenel | 351 | 382,885(0.09%)#81 | 4,544,093(0.01%)#883 |
| 82. | Edgewater Borough | 349 | 382,885(0.09%)#82 | 4,544,093(0.01%)#889 |
| 83. | Wallington Borough | 345 | 382,885(0.09%)#83 | 4,544,093(0.01%)#897 |
| 84. | Freehold Borough | 334 | 382,885(0.09%)#84 | 4,544,093(0.01%)#922 |
| 85. | Woodland Park Borough | 333 | 382,885(0.09%)#85 | 4,544,093(0.01%)#923 |
| 86. | Maywood Borough | 328 | 382,885(0.09%)#86 | 4,544,093(0.01%)#936 |
| 87. | Millville | 327 | 382,885(0.09%)#87 | 4,544,093(0.01%)#937 |
| 88. | Boonton | 321 | 382,885(0.08%)#88 | 4,544,093(0.01%)#952 |
| 89. | East Rutherford Borough | 318 | 382,885(0.08%)#89 | 4,544,093(0.01%)#959 |
| 90. | Wharton Borough | 318 | 382,885(0.08%)#90 | 4,544,093(0.01%)#961 |
| 91. | Voorhees | 312 | 382,885(0.08%)#91 | 4,544,093(0.01%)#971 |
| 92. | Beattystown | 303 | 382,885(0.08%)#92 | 4,544,093(0.01%)#996 |
| 93. | Rockaway Borough | 290 | 382,885(0.08%)#93 | 4,544,093(0.01%)#1,015 |
| 94. | Tinton Falls Borough | 288 | 382,885(0.08%)#94 | 4,544,093(0.01%)#1,022 |
| 95. | Neptune City Borough | 287 | 382,885(0.07%)#95 | 4,544,093(0.01%)#1,026 |
| 96. | Leonia Borough | 284 | 382,885(0.07%)#96 | 4,544,093(0.01%)#1,036 |
| 97. | Paramus Borough | 279 | 382,885(0.07%)#97 | 4,544,093(0.01%)#1,044 |
| 98. | Wood Ridge Borough | 272 | 382,885(0.07%)#98 | 4,544,093(0.01%)#1,071 |
| 99. | Parsippany | 270 | 382,885(0.07%)#99 | 4,544,093(0.01%)#1,075 |
| 100. | Highland Park Borough | 262 | 382,885(0.07%)#100 | 4,544,093(0.01%)#1,096 |
Common Questions
What are the Top 10 Cities with the Most Immigrants from Caribbean in New Jersey?
Top 10 Cities with the Most Immigrants from Caribbean in New Jersey are:
#1
36,182
#2
24,409
#3
19,398
#4
17,810
#5
16,821
#6
13,518
#7
11,709
#8
11,676
#9
11,098
#10
6,918
What city has the Most Immigrants from Caribbean in New Jersey?
Paterson has the Most Immigrants from Caribbean in New Jersey with 36,182.
What is the Total Immigrants from Caribbean in the State of New Jersey?
Total Immigrants from Caribbean in New Jersey is 382,885.
What is the Total Immigrants from Caribbean in the United States?
Total Immigrants from Caribbean in the United States is 4,544,093.