Cities with the Most Immigrants from Mexico in New Jersey
RELATED REPORTS & OPTIONS
Mexico
New Jersey
Compare Cities
Map of Cities with the Most Immigrants from Mexico in New Jersey
0
15,000
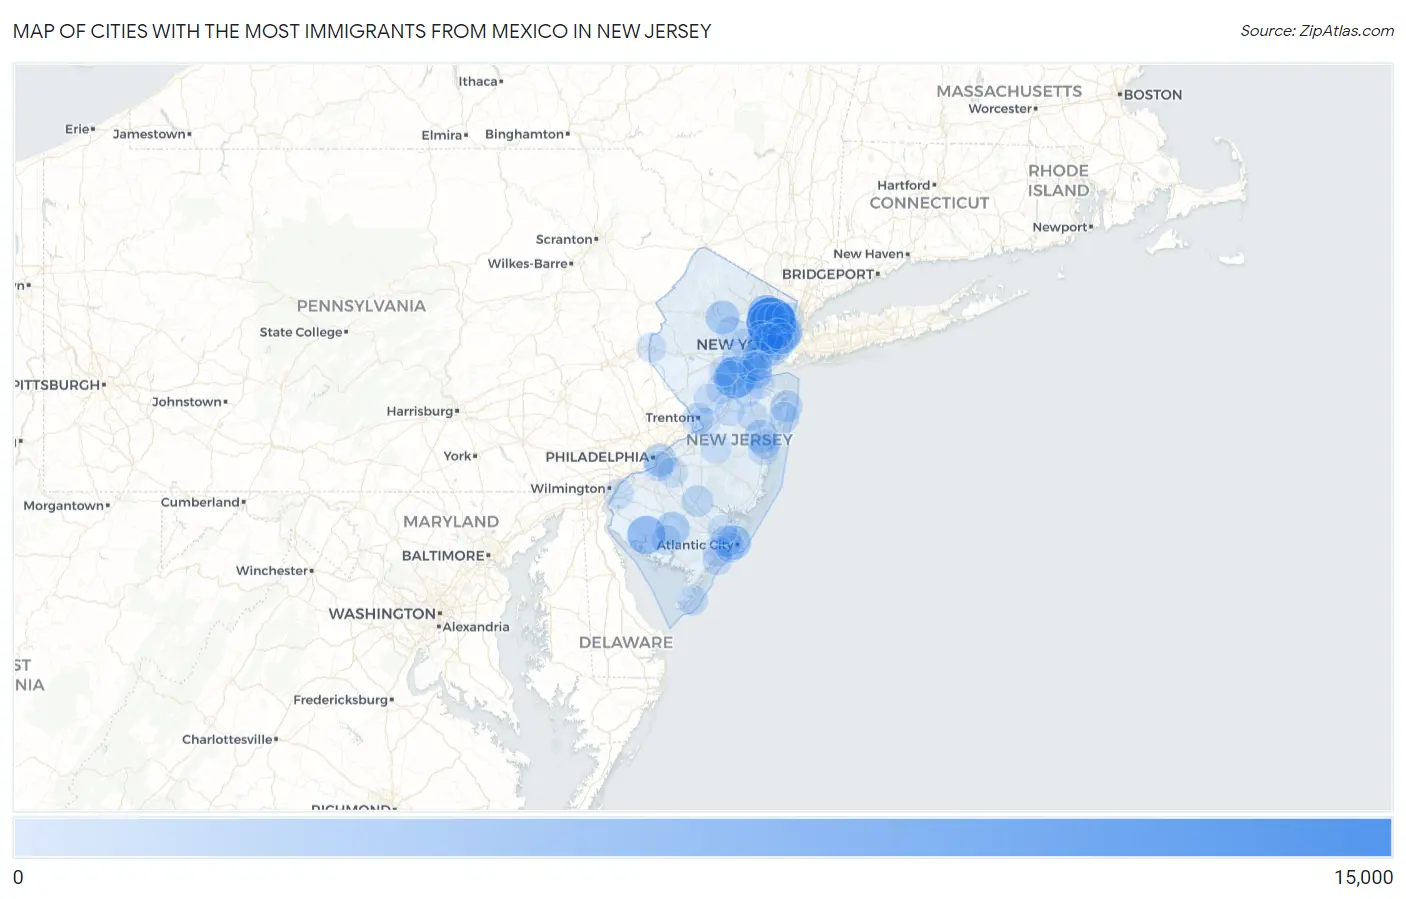
Cities with the Most Immigrants from Mexico in New Jersey
| City | Mexico | vs State | vs National | |
| 1. | Passaic | 10,038 | 102,527(9.79%)#1 | 10,767,104(0.09%)#145 |
| 2. | New Brunswick | 5,987 | 102,527(5.84%)#2 | 10,767,104(0.06%)#253 |
| 3. | Bridgeton | 4,085 | 102,527(3.98%)#3 | 10,767,104(0.04%)#385 |
| 4. | Paterson | 3,777 | 102,527(3.68%)#4 | 10,767,104(0.04%)#409 |
| 5. | Clifton | 2,821 | 102,527(2.75%)#5 | 10,767,104(0.03%)#534 |
| 6. | Union City | 2,751 | 102,527(2.68%)#6 | 10,767,104(0.03%)#544 |
| 7. | Elizabeth | 2,655 | 102,527(2.59%)#7 | 10,767,104(0.02%)#555 |
| 8. | West New York | 2,494 | 102,527(2.43%)#8 | 10,767,104(0.02%)#596 |
| 9. | Newark | 2,383 | 102,527(2.32%)#9 | 10,767,104(0.02%)#617 |
| 10. | Atlantic City | 2,266 | 102,527(2.21%)#10 | 10,767,104(0.02%)#644 |
| 11. | Vineland | 2,135 | 102,527(2.08%)#11 | 10,767,104(0.02%)#675 |
| 12. | Dover | 2,030 | 102,527(1.98%)#12 | 10,767,104(0.02%)#703 |
| 13. | Freehold Borough | 1,932 | 102,527(1.88%)#13 | 10,767,104(0.02%)#733 |
| 14. | Perth Amboy | 1,795 | 102,527(1.75%)#14 | 10,767,104(0.02%)#772 |
| 15. | Lakewood | 1,709 | 102,527(1.67%)#15 | 10,767,104(0.02%)#803 |
| 16. | Camden | 1,683 | 102,527(1.64%)#16 | 10,767,104(0.02%)#814 |
| 17. | Jersey City | 1,345 | 102,527(1.31%)#17 | 10,767,104(0.01%)#946 |
| 18. | Red Bank Borough | 1,123 | 102,527(1.10%)#18 | 10,767,104(0.01%)#1,070 |
| 19. | Long Branch | 1,099 | 102,527(1.07%)#19 | 10,767,104(0.01%)#1,093 |
| 20. | Hammonton | 905 | 102,527(0.88%)#20 | 10,767,104(0.01%)#1,261 |
| 21. | Plainfield | 883 | 102,527(0.86%)#21 | 10,767,104(0.01%)#1,282 |
| 22. | Pleasantville | 876 | 102,527(0.85%)#22 | 10,767,104(0.01%)#1,293 |
| 23. | Garfield | 767 | 102,527(0.75%)#23 | 10,767,104(0.01%)#1,431 |
| 24. | Trenton | 756 | 102,527(0.74%)#24 | 10,767,104(0.01%)#1,452 |
| 25. | South River Borough | 739 | 102,527(0.72%)#25 | 10,767,104(0.01%)#1,467 |
| 26. | Asbury Park | 692 | 102,527(0.67%)#26 | 10,767,104(0.01%)#1,540 |
| 27. | Bayonne | 685 | 102,527(0.67%)#27 | 10,767,104(0.01%)#1,550 |
| 28. | Bound Brook Borough | 583 | 102,527(0.57%)#28 | 10,767,104(0.01%)#1,737 |
| 29. | Lindenwold Borough | 575 | 102,527(0.56%)#29 | 10,767,104(0.01%)#1,750 |
| 30. | Wildwood | 543 | 102,527(0.53%)#30 | 10,767,104(0.01%)#1,815 |
| 31. | Toms River | 534 | 102,527(0.52%)#31 | 10,767,104(0.00%)#1,848 |
| 32. | Linden | 525 | 102,527(0.51%)#32 | 10,767,104(0.00%)#1,868 |
| 33. | East Franklin | 519 | 102,527(0.51%)#33 | 10,767,104(0.00%)#1,881 |
| 34. | Kearny | 499 | 102,527(0.49%)#34 | 10,767,104(0.00%)#1,929 |
| 35. | Point Pleasant Borough | 496 | 102,527(0.48%)#35 | 10,767,104(0.00%)#1,942 |
| 36. | Old Bridge | 454 | 102,527(0.44%)#36 | 10,767,104(0.00%)#2,046 |
| 37. | Woodbridge | 451 | 102,527(0.44%)#37 | 10,767,104(0.00%)#2,055 |
| 38. | Englewood | 436 | 102,527(0.43%)#38 | 10,767,104(0.00%)#2,102 |
| 39. | Roselle Borough | 428 | 102,527(0.42%)#39 | 10,767,104(0.00%)#2,130 |
| 40. | Somers Point | 381 | 102,527(0.37%)#40 | 10,767,104(0.00%)#2,301 |
| 41. | Point Pleasant Beach Borough | 362 | 102,527(0.35%)#41 | 10,767,104(0.00%)#2,371 |
| 42. | East Orange | 351 | 102,527(0.34%)#42 | 10,767,104(0.00%)#2,414 |
| 43. | North Plainfield Borough | 318 | 102,527(0.31%)#43 | 10,767,104(0.00%)#2,571 |
| 44. | Bellmawr Borough | 303 | 102,527(0.30%)#44 | 10,767,104(0.00%)#2,653 |
| 45. | Leisure Village | 295 | 102,527(0.29%)#45 | 10,767,104(0.00%)#2,700 |
| 46. | Kendall Park | 294 | 102,527(0.29%)#46 | 10,767,104(0.00%)#2,705 |
| 47. | Westwood Borough | 288 | 102,527(0.28%)#47 | 10,767,104(0.00%)#2,750 |
| 48. | Swedesboro Borough | 280 | 102,527(0.27%)#48 | 10,767,104(0.00%)#2,790 |
| 49. | Echelon | 275 | 102,527(0.27%)#49 | 10,767,104(0.00%)#2,813 |
| 50. | Prospect Park Borough | 272 | 102,527(0.27%)#50 | 10,767,104(0.00%)#2,839 |
| 51. | Millville | 270 | 102,527(0.26%)#51 | 10,767,104(0.00%)#2,847 |
| 52. | Somerville Borough | 253 | 102,527(0.25%)#52 | 10,767,104(0.00%)#2,955 |
| 53. | Hackensack | 252 | 102,527(0.25%)#53 | 10,767,104(0.00%)#2,958 |
| 54. | Highland Park Borough | 252 | 102,527(0.25%)#54 | 10,767,104(0.00%)#2,960 |
| 55. | Ocean City | 247 | 102,527(0.24%)#55 | 10,767,104(0.00%)#2,989 |
| 56. | Summit | 244 | 102,527(0.24%)#56 | 10,767,104(0.00%)#3,009 |
| 57. | Bradley Beach Borough | 235 | 102,527(0.23%)#57 | 10,767,104(0.00%)#3,059 |
| 58. | Gloucester City | 231 | 102,527(0.23%)#58 | 10,767,104(0.00%)#3,084 |
| 59. | Montvale Borough | 226 | 102,527(0.22%)#59 | 10,767,104(0.00%)#3,123 |
| 60. | Eatontown Borough | 220 | 102,527(0.21%)#60 | 10,767,104(0.00%)#3,161 |
| 61. | South Bound Brook Borough | 213 | 102,527(0.21%)#61 | 10,767,104(0.00%)#3,212 |
| 62. | Lodi Borough | 211 | 102,527(0.21%)#62 | 10,767,104(0.00%)#3,229 |
| 63. | Hoboken | 209 | 102,527(0.20%)#63 | 10,767,104(0.00%)#3,238 |
| 64. | East Rutherford Borough | 209 | 102,527(0.20%)#64 | 10,767,104(0.00%)#3,242 |
| 65. | Harrison | 204 | 102,527(0.20%)#65 | 10,767,104(0.00%)#3,290 |
| 66. | Flemington Borough | 204 | 102,527(0.20%)#66 | 10,767,104(0.00%)#3,293 |
| 67. | Woodland Park Borough | 194 | 102,527(0.19%)#67 | 10,767,104(0.00%)#3,387 |
| 68. | Bergenfield Borough | 192 | 102,527(0.19%)#68 | 10,767,104(0.00%)#3,408 |
| 69. | Fort Dix | 190 | 102,527(0.19%)#69 | 10,767,104(0.00%)#3,429 |
| 70. | Ventnor City | 186 | 102,527(0.18%)#70 | 10,767,104(0.00%)#3,483 |
| 71. | Jamesburg Borough | 186 | 102,527(0.18%)#71 | 10,767,104(0.00%)#3,484 |
| 72. | Keansburg Borough | 181 | 102,527(0.18%)#72 | 10,767,104(0.00%)#3,546 |
| 73. | Port Reading | 179 | 102,527(0.17%)#73 | 10,767,104(0.00%)#3,572 |
| 74. | Westmont | 177 | 102,527(0.17%)#74 | 10,767,104(0.00%)#3,595 |
| 75. | West Freehold | 176 | 102,527(0.17%)#75 | 10,767,104(0.00%)#3,604 |
| 76. | Madison Borough | 171 | 102,527(0.17%)#76 | 10,767,104(0.00%)#3,661 |
| 77. | Carneys Point | 171 | 102,527(0.17%)#77 | 10,767,104(0.00%)#3,664 |
| 78. | Morristown | 170 | 102,527(0.17%)#78 | 10,767,104(0.00%)#3,673 |
| 79. | Haledon Borough | 170 | 102,527(0.17%)#79 | 10,767,104(0.00%)#3,678 |
| 80. | Belmar Borough | 169 | 102,527(0.16%)#80 | 10,767,104(0.00%)#3,689 |
| 81. | Secaucus | 166 | 102,527(0.16%)#81 | 10,767,104(0.00%)#3,722 |
| 82. | Dumont Borough | 163 | 102,527(0.16%)#82 | 10,767,104(0.00%)#3,761 |
| 83. | Woodlynne Borough | 152 | 102,527(0.15%)#83 | 10,767,104(0.00%)#3,906 |
| 84. | Butler Borough | 148 | 102,527(0.14%)#84 | 10,767,104(0.00%)#3,961 |
| 85. | Princeton | 145 | 102,527(0.14%)#85 | 10,767,104(0.00%)#4,000 |
| 86. | Phillipsburg | 141 | 102,527(0.14%)#86 | 10,767,104(0.00%)#4,060 |
| 87. | Palmyra Borough | 136 | 102,527(0.13%)#87 | 10,767,104(0.00%)#4,120 |
| 88. | Buena Borough | 131 | 102,527(0.13%)#88 | 10,767,104(0.00%)#4,191 |
| 89. | Ramsey Borough | 125 | 102,527(0.12%)#89 | 10,767,104(0.00%)#4,280 |
| 90. | Cliffwood Beach | 124 | 102,527(0.12%)#90 | 10,767,104(0.00%)#4,309 |
| 91. | Three Bridges | 124 | 102,527(0.12%)#91 | 10,767,104(0.00%)#4,317 |
| 92. | Dunellen Borough | 123 | 102,527(0.12%)#92 | 10,767,104(0.00%)#4,323 |
| 93. | Pomona | 120 | 102,527(0.12%)#93 | 10,767,104(0.00%)#4,375 |
| 94. | Park Ridge Borough | 119 | 102,527(0.12%)#94 | 10,767,104(0.00%)#4,389 |
| 95. | Hillsborough | 118 | 102,527(0.12%)#95 | 10,767,104(0.00%)#4,405 |
| 96. | White Horse | 118 | 102,527(0.12%)#96 | 10,767,104(0.00%)#4,408 |
| 97. | Franklin Center | 114 | 102,527(0.11%)#97 | 10,767,104(0.00%)#4,474 |
| 98. | Pompton Lakes Borough | 108 | 102,527(0.11%)#98 | 10,767,104(0.00%)#4,582 |
| 99. | Twin Rivers | 108 | 102,527(0.11%)#99 | 10,767,104(0.00%)#4,585 |
| 100. | Sayreville Borough | 107 | 102,527(0.10%)#100 | 10,767,104(0.00%)#4,600 |
Common Questions
What are the Top 10 Cities with the Most Immigrants from Mexico in New Jersey?
Top 10 Cities with the Most Immigrants from Mexico in New Jersey are:
#1
10,038
#2
5,987
#3
4,085
#4
3,777
#5
2,821
#6
2,751
#7
2,655
#8
2,494
#9
2,383
#10
2,266
What city has the Most Immigrants from Mexico in New Jersey?
Passaic has the Most Immigrants from Mexico in New Jersey with 10,038.
What is the Total Immigrants from Mexico in the State of New Jersey?
Total Immigrants from Mexico in New Jersey is 102,527.
What is the Total Immigrants from Mexico in the United States?
Total Immigrants from Mexico in the United States is 10,767,104.