Cities with the Highest Percentage of Immigrants from Central America in New Jersey
RELATED REPORTS & OPTIONS
Central America
New Jersey
Compare Cities
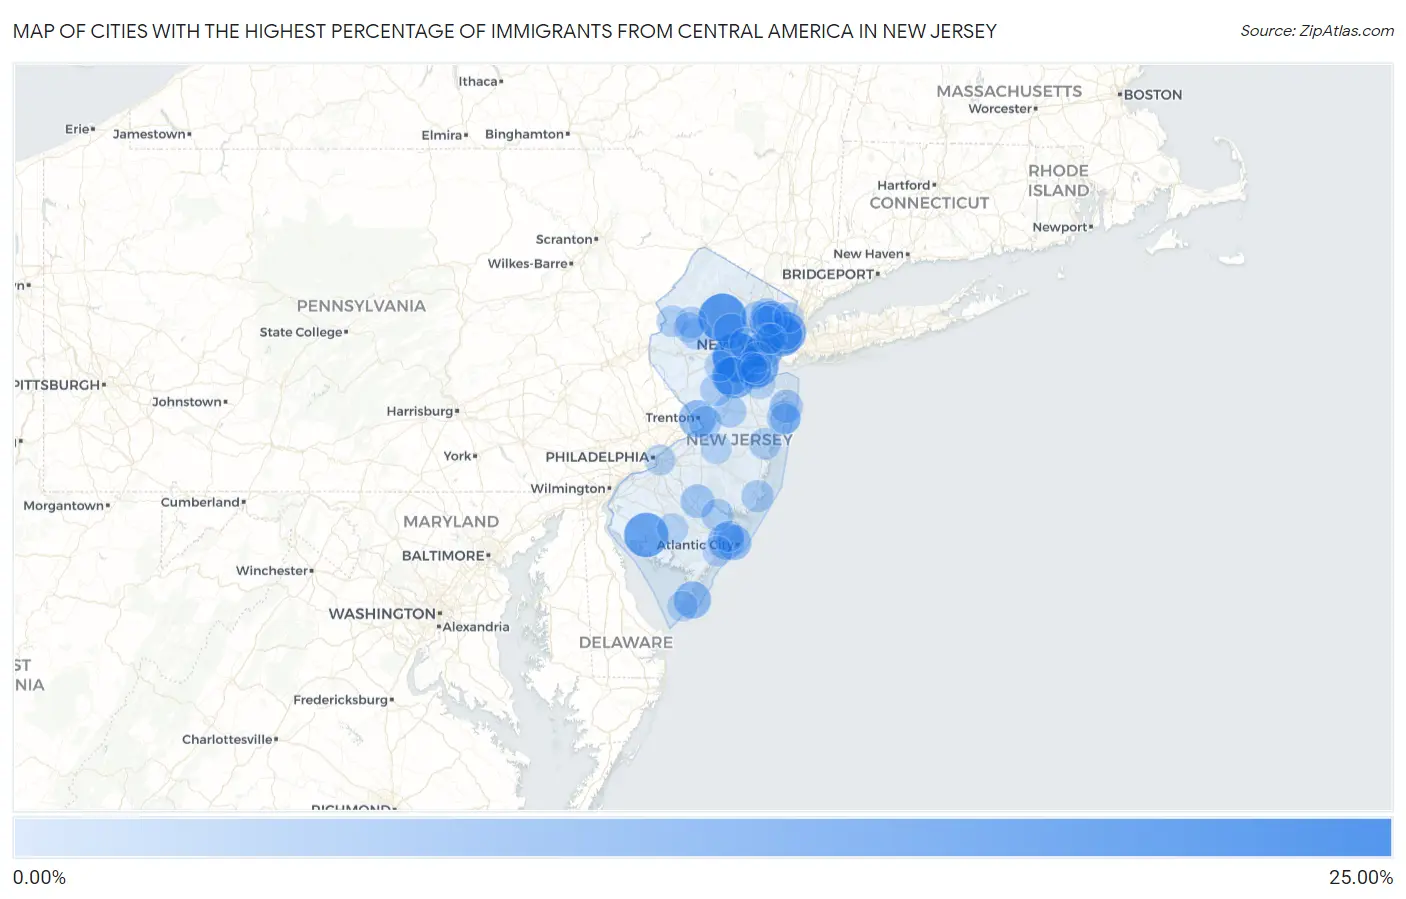
Map of Cities with the Highest Percentage of Immigrants from Central America in New Jersey
0.00%
25.00%
Cities with the Highest Percentage of Immigrants from Central America in New Jersey
| City | Central America | vs State | vs National | |
| 1. | Plainfield | 23.58% | 2.82%(+20.8)#33 | 4.37%(+19.2)#217 |
| 2. | Three Bridges | 21.79% | 2.82%(+19.0)#34 | 4.37%(+17.4)#218 |
| 3. | Dover | 21.74% | 2.82%(+18.9)#35 | 4.37%(+17.4)#219 |
| 4. | Millstone Borough | 20.03% | 2.82%(+17.2)#36 | 4.37%(+15.7)#220 |
| 5. | Bound Brook Borough | 18.33% | 2.82%(+15.5)#37 | 4.37%(+14.0)#221 |
| 6. | Bridgeton | 17.99% | 2.82%(+15.2)#38 | 4.37%(+13.6)#222 |
| 7. | Freehold Borough | 17.67% | 2.82%(+14.9)#39 | 4.37%(+13.3)#223 |
| 8. | Swedesboro Borough | 17.15% | 2.82%(+14.3)#40 | 4.37%(+12.8)#224 |
| 9. | Passaic | 16.59% | 2.82%(+13.8)#41 | 4.37%(+12.2)#296 |
| 10. | Fairview Borough | 16.51% | 2.82%(+13.7)#42 | 4.37%(+12.1)#297 |
| 11. | Roadstown | 16.46% | 2.82%(+13.6)#43 | 4.37%(+12.1)#298 |
| 12. | West Berlin | 15.97% | 2.82%(+13.1)#44 | 4.37%(+11.6)#299 |
| 13. | Victory Gardens Borough | 15.96% | 2.82%(+13.1)#45 | 4.37%(+11.6)#300 |
| 14. | West New York | 15.82% | 2.82%(+13.0)#46 | 4.37%(+11.5)#301 |
| 15. | Port Reading | 15.72% | 2.82%(+12.9)#47 | 4.37%(+11.3)#302 |
| 16. | Teterboro Borough | 15.38% | 2.82%(+12.6)#48 | 4.37%(+11.0)#303 |
| 17. | New Brunswick | 15.11% | 2.82%(+12.3)#49 | 4.37%(+10.7)#304 |
| 18. | North Plainfield Borough | 14.61% | 2.82%(+11.8)#50 | 4.37%(+10.2)#305 |
| 19. | Flemington Borough | 14.39% | 2.82%(+11.6)#51 | 4.37%(+10.0)#306 |
| 20. | Harrisonville | 14.01% | 2.82%(+11.2)#52 | 4.37%(+9.64)#307 |
| 21. | Union City | 13.59% | 2.82%(+10.8)#53 | 4.37%(+9.22)#308 |
| 22. | East Franklin | 12.00% | 2.82%(+9.17)#54 | 4.37%(+7.63)#309 |
| 23. | Red Bank Borough | 11.19% | 2.82%(+8.37)#55 | 4.37%(+6.82)#310 |
| 24. | Elizabeth | 10.92% | 2.82%(+8.09)#56 | 4.37%(+6.55)#311 |
| 25. | Trenton | 10.75% | 2.82%(+7.93)#57 | 4.37%(+6.38)#312 |
| 26. | Wildwood | 10.52% | 2.82%(+7.69)#58 | 4.37%(+6.15)#313 |
| 27. | Pleasantville | 10.13% | 2.82%(+7.30)#59 | 4.37%(+5.76)#314 |
| 28. | South River Borough | 10.02% | 2.82%(+7.20)#60 | 4.37%(+5.65)#315 |
| 29. | Lindenwold Borough | 9.58% | 2.82%(+6.76)#61 | 4.37%(+5.21)#316 |
| 30. | Gillette | 9.37% | 2.82%(+6.54)#62 | 4.37%(+5.00)#317 |
| 31. | Deal Borough | 9.15% | 2.82%(+6.32)#63 | 4.37%(+4.78)#318 |
| 32. | South Bound Brook Borough | 8.95% | 2.82%(+6.13)#64 | 4.37%(+4.58)#319 |
| 33. | Morristown | 8.64% | 2.82%(+5.82)#65 | 4.37%(+4.27)#320 |
| 34. | Atlantic City | 8.62% | 2.82%(+5.79)#66 | 4.37%(+4.25)#321 |
| 35. | Point Pleasant Beach Borough | 8.23% | 2.82%(+5.41)#67 | 4.37%(+3.86)#322 |
| 36. | Shiloh Borough | 8.20% | 2.82%(+5.37)#68 | 4.37%(+3.83)#323 |
| 37. | Netcong Borough | 8.09% | 2.82%(+5.27)#69 | 4.37%(+3.72)#324 |
| 38. | Guttenberg | 8.01% | 2.82%(+5.18)#70 | 4.37%(+3.64)#325 |
| 39. | Dunellen Borough | 7.41% | 2.82%(+4.59)#71 | 4.37%(+3.04)#326 |
| 40. | Prospect Park Borough | 7.24% | 2.82%(+4.41)#72 | 4.37%(+2.87)#327 |
| 41. | Lake Como Borough | 7.19% | 2.82%(+4.37)#73 | 4.37%(+2.82)#328 |
| 42. | Absecon Highlands | 7.00% | 2.82%(+4.18)#74 | 4.37%(+2.63)#329 |
| 43. | Hammonton | 6.92% | 2.82%(+4.10)#75 | 4.37%(+2.55)#330 |
| 44. | Asbury Park | 6.91% | 2.82%(+4.09)#76 | 4.37%(+2.54)#331 |
| 45. | Cliffside Park Borough | 6.67% | 2.82%(+3.85)#77 | 4.37%(+2.30)#332 |
| 46. | Woodlynne Borough | 6.61% | 2.82%(+3.79)#78 | 4.37%(+2.24)#333 |
| 47. | Perth Amboy | 6.48% | 2.82%(+3.66)#79 | 4.37%(+2.11)#334 |
| 48. | Long Branch | 6.39% | 2.82%(+3.56)#80 | 4.37%(+2.02)#335 |
| 49. | Bradley Beach Borough | 6.30% | 2.82%(+3.48)#81 | 4.37%(+1.93)#336 |
| 50. | White Horse | 5.90% | 2.82%(+3.08)#82 | 4.37%(+1.53)#337 |
| 51. | Twin Rivers | 5.84% | 2.82%(+3.02)#83 | 4.37%(+1.47)#338 |
| 52. | Belmar Borough | 5.60% | 2.82%(+2.77)#84 | 4.37%(+1.23)#339 |
| 53. | Cedar Knolls | 5.52% | 2.82%(+2.70)#85 | 4.37%(+1.15)#340 |
| 54. | Manahawkin | 5.51% | 2.82%(+2.68)#86 | 4.37%(+1.14)#341 |
| 55. | Roosevelt Borough | 5.50% | 2.82%(+2.67)#87 | 4.37%(+1.13)#342 |
| 56. | Singac | 5.48% | 2.82%(+2.65)#88 | 4.37%(+1.11)#343 |
| 57. | Palisades Park Borough | 5.40% | 2.82%(+2.57)#89 | 4.37%(+1.03)#344 |
| 58. | Egg Harbor City | 5.39% | 2.82%(+2.57)#90 | 4.37%(+1.02)#345 |
| 59. | East Rocky Hill | 5.35% | 2.82%(+2.53)#91 | 4.37%(+0.983)#346 |
| 60. | Leisure Village | 5.03% | 2.82%(+2.20)#92 | 4.37%(+0.659)#347 |
| 61. | Chester Borough | 5.00% | 2.82%(+2.18)#93 | 4.37%(+0.630)#348 |
| 62. | Summit | 4.94% | 2.82%(+2.12)#94 | 4.37%(+0.573)#349 |
| 63. | Long Valley | 4.79% | 2.82%(+1.97)#95 | 4.37%(+0.420)#350 |
| 64. | Mountain Lake | 4.79% | 2.82%(+1.96)#96 | 4.37%(+0.418)#351 |
| 65. | Hackettstown | 4.69% | 2.82%(+1.86)#97 | 4.37%(+0.318)#352 |
| 66. | Gouldtown | 4.67% | 2.82%(+1.85)#98 | 4.37%(+0.304)#353 |
| 67. | Englishtown Borough | 4.65% | 2.82%(+1.83)#99 | 4.37%(+0.280)#354 |
| 68. | Roselle Borough | 4.63% | 2.82%(+1.80)#100 | 4.37%(+0.257)#355 |
| 69. | Westwood Borough | 4.57% | 2.82%(+1.75)#101 | 4.37%(+0.203)#356 |
| 70. | Paterson | 4.55% | 2.82%(+1.73)#102 | 4.37%(+0.183)#357 |
| 71. | Absecon | 4.55% | 2.82%(+1.72)#103 | 4.37%(+0.175)#358 |
| 72. | Manville Borough | 4.40% | 2.82%(+1.57)#104 | 4.37%(+0.028)#359 |
| 73. | Vineland | 4.32% | 2.82%(+1.49)#105 | 4.37%(-0.054)#360 |
| 74. | East Newark Borough | 4.16% | 2.82%(+1.33)#106 | 4.37%(-0.213)#361 |
| 75. | Somerville Borough | 4.15% | 2.82%(+1.32)#107 | 4.37%(-0.223)#362 |
| 76. | Camden | 4.13% | 2.82%(+1.30)#108 | 4.37%(-0.242)#363 |
| 77. | Cliffwood Beach | 4.12% | 2.82%(+1.30)#109 | 4.37%(-0.248)#364 |
| 78. | Northvale Borough | 4.11% | 2.82%(+1.29)#110 | 4.37%(-0.260)#365 |
| 79. | Linden | 4.03% | 2.82%(+1.21)#111 | 4.37%(-0.338)#366 |
| 80. | Middlesex Borough | 4.02% | 2.82%(+1.20)#112 | 4.37%(-0.349)#367 |
| 81. | Garfield | 4.01% | 2.82%(+1.19)#113 | 4.37%(-0.357)#368 |
| 82. | Ocean Grove | 3.96% | 2.82%(+1.14)#114 | 4.37%(-0.407)#369 |
| 83. | Cape May | 3.94% | 2.82%(+1.12)#115 | 4.37%(-0.427)#370 |
| 84. | Sewaren | 3.93% | 2.82%(+1.11)#116 | 4.37%(-0.437)#371 |
| 85. | Fort Dix | 3.93% | 2.82%(+1.11)#117 | 4.37%(-0.437)#372 |
| 86. | Clifton | 3.93% | 2.82%(+1.11)#118 | 4.37%(-0.439)#373 |
| 87. | Finderne | 3.84% | 2.82%(+1.02)#119 | 4.37%(-0.527)#374 |
| 88. | Harrison | 3.78% | 2.82%(+0.953)#120 | 4.37%(-0.592)#375 |
| 89. | Englewood | 3.67% | 2.82%(+0.844)#121 | 4.37%(-0.701)#376 |
| 90. | Somers Point | 3.63% | 2.82%(+0.810)#122 | 4.37%(-0.735)#377 |
| 91. | Roselle Park Borough | 3.63% | 2.82%(+0.806)#123 | 4.37%(-0.739)#378 |
| 92. | Raritan Borough | 3.61% | 2.82%(+0.789)#124 | 4.37%(-0.756)#379 |
| 93. | Lodi Borough | 3.55% | 2.82%(+0.726)#125 | 4.37%(-0.820)#380 |
| 94. | Beattystown | 3.53% | 2.82%(+0.707)#126 | 4.37%(-0.838)#381 |
| 95. | Pemberton Borough | 3.51% | 2.82%(+0.688)#127 | 4.37%(-0.857)#382 |
| 96. | Kearny | 3.43% | 2.82%(+0.601)#128 | 4.37%(-0.944)#383 |
| 97. | Hightstown Borough | 3.34% | 2.82%(+0.518)#129 | 4.37%(-1.03)#384 |
| 98. | High Bridge Borough | 3.34% | 2.82%(+0.514)#130 | 4.37%(-1.03)#385 |
| 99. | Woodbridge | 3.33% | 2.82%(+0.501)#131 | 4.37%(-1.04)#386 |
| 100. | Buena Borough | 3.31% | 2.82%(+0.483)#132 | 4.37%(-1.06)#387 |
Common Questions
What are the Top 10 Cities with the Highest Percentage of Immigrants from Central America in New Jersey?
Top 10 Cities with the Highest Percentage of Immigrants from Central America in New Jersey are:
#1
23.58%
#2
21.74%
#3
17.99%
#4
16.59%
#5
15.82%
#6
15.72%
#7
15.11%
#8
13.59%
#9
12.00%
#10
10.92%
What city has the Highest Percentage of Immigrants from Central America in New Jersey?
Plainfield has the Highest Percentage of Immigrants from Central America in New Jersey with 23.58%.
What is the Percentage of Immigrants from Central America in the State of New Jersey?
Percentage of Immigrants from Central America in New Jersey is 2.82%.
What is the Percentage of Immigrants from Central America in the United States?
Percentage of Immigrants from Central America in the United States is 4.37%.