Cities with the Lowest Percentage of Renter-Occupied Units in New Jersey
RELATED REPORTS & OPTIONS
Lowest Renter-Occupied
New Jersey
Compare Cities
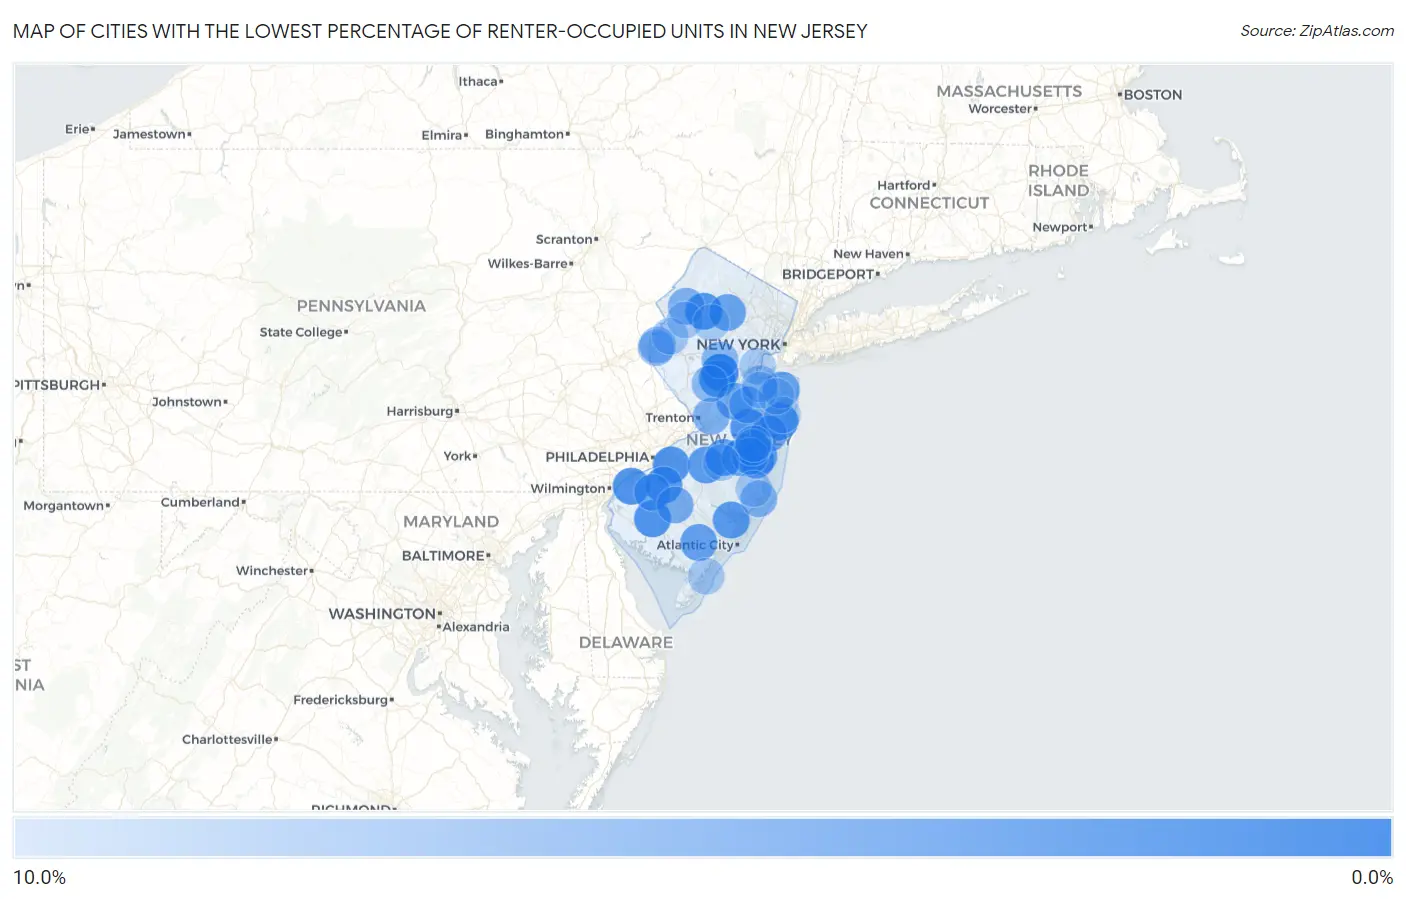
Map of Cities with the Lowest Percentage of Renter-Occupied Units in New Jersey
10.0%
0.0%
Cities with the Lowest Percentage of Renter-Occupied Units in New Jersey
| City | % Renter-Occupied | vs State | vs National | |
| 1. | Weston | 0.58% | 36.1%(-35.6)#1 | 35.2%(-34.6)#19 |
| 2. | Sewell | 0.78% | 36.1%(-35.4)#2 | 35.2%(-34.4)#39 |
| 3. | Mantoloking Borough | 1.2% | 36.1%(-34.9)#3 | 35.2%(-34.0)#81 |
| 4. | Hewitt | 1.6% | 36.1%(-34.5)#4 | 35.2%(-33.6)#148 |
| 5. | Olivet | 2.0% | 36.1%(-34.1)#5 | 35.2%(-33.2)#216 |
| 6. | Stonebridge | 2.1% | 36.1%(-34.1)#6 | 35.2%(-33.1)#229 |
| 7. | Beckett | 2.1% | 36.1%(-34.1)#7 | 35.2%(-33.1)#230 |
| 8. | Shark River Hills | 2.1% | 36.1%(-34.1)#8 | 35.2%(-33.1)#232 |
| 9. | Byram Center | 2.1% | 36.1%(-34.0)#9 | 35.2%(-33.1)#241 |
| 10. | Vista Center | 2.2% | 36.1%(-34.0)#10 | 35.2%(-33.0)#257 |
| 11. | Barclay | 2.2% | 36.1%(-33.9)#11 | 35.2%(-33.0)#262 |
| 12. | Packanack Lake | 2.3% | 36.1%(-33.9)#12 | 35.2%(-32.9)#282 |
| 13. | Mickleton | 2.3% | 36.1%(-33.8)#13 | 35.2%(-32.9)#287 |
| 14. | Harrington Park Borough | 2.4% | 36.1%(-33.8)#14 | 35.2%(-32.8)#302 |
| 15. | Turnersville | 2.5% | 36.1%(-33.7)#15 | 35.2%(-32.7)#342 |
| 16. | Port Republic | 2.5% | 36.1%(-33.6)#16 | 35.2%(-32.6)#373 |
| 17. | North Caldwell Borough | 2.6% | 36.1%(-33.6)#17 | 35.2%(-32.6)#389 |
| 18. | Blackwells Mills | 2.6% | 36.1%(-33.5)#18 | 35.2%(-32.6)#397 |
| 19. | Essex Fells Borough | 2.6% | 36.1%(-33.5)#19 | 35.2%(-32.6)#398 |
| 20. | Auburn | 2.6% | 36.1%(-33.5)#20 | 35.2%(-32.6)#400 |
| 21. | Silver Ridge | 2.7% | 36.1%(-33.4)#21 | 35.2%(-32.5)#419 |
| 22. | Leisuretowne | 2.8% | 36.1%(-33.4)#22 | 35.2%(-32.4)#427 |
| 23. | Country Lake Estates | 2.8% | 36.1%(-33.4)#23 | 35.2%(-32.4)#438 |
| 24. | Cedar Glen Lakes | 2.9% | 36.1%(-33.3)#24 | 35.2%(-32.3)#464 |
| 25. | Estell Manor | 3.3% | 36.1%(-32.8)#25 | 35.2%(-31.8)#624 |
| 26. | Holiday Heights | 3.5% | 36.1%(-32.6)#26 | 35.2%(-31.7)#685 |
| 27. | Avalon Borough | 3.5% | 36.1%(-32.6)#27 | 35.2%(-31.6)#688 |
| 28. | White Meadow Lake | 3.6% | 36.1%(-32.5)#28 | 35.2%(-31.5)#721 |
| 29. | Navesink | 3.7% | 36.1%(-32.4)#29 | 35.2%(-31.5)#749 |
| 30. | Ramtown | 3.7% | 36.1%(-32.4)#30 | 35.2%(-31.5)#755 |
| 31. | Mountain Lakes Borough | 3.8% | 36.1%(-32.4)#31 | 35.2%(-31.4)#775 |
| 32. | Whittingham | 3.8% | 36.1%(-32.4)#32 | 35.2%(-31.4)#776 |
| 33. | Little Silver Borough | 3.8% | 36.1%(-32.3)#33 | 35.2%(-31.4)#793 |
| 34. | Richwood | 4.1% | 36.1%(-32.0)#34 | 35.2%(-31.1)#866 |
| 35. | Centre Grove | 4.3% | 36.1%(-31.9)#35 | 35.2%(-30.9)#925 |
| 36. | Lyons | 4.3% | 36.1%(-31.8)#36 | 35.2%(-30.9)#939 |
| 37. | Pine Beach Borough | 4.4% | 36.1%(-31.8)#37 | 35.2%(-30.8)#954 |
| 38. | Victory Lakes | 4.4% | 36.1%(-31.7)#38 | 35.2%(-30.8)#975 |
| 39. | Layton | 4.5% | 36.1%(-31.6)#39 | 35.2%(-30.7)#1,000 |
| 40. | Brookside | 4.5% | 36.1%(-31.6)#40 | 35.2%(-30.7)#1,004 |
| 41. | Yorketown | 4.6% | 36.1%(-31.5)#41 | 35.2%(-30.6)#1,060 |
| 42. | Glen Ridge Borough | 4.7% | 36.1%(-31.4)#42 | 35.2%(-30.5)#1,103 |
| 43. | East Vineland | 4.9% | 36.1%(-31.3)#43 | 35.2%(-30.3)#1,170 |
| 44. | Woodbury Heights Borough | 4.9% | 36.1%(-31.3)#44 | 35.2%(-30.3)#1,179 |
| 45. | Hamilton Square | 4.9% | 36.1%(-31.2)#45 | 35.2%(-30.3)#1,183 |
| 46. | Johnsonburg | 4.9% | 36.1%(-31.2)#46 | 35.2%(-30.3)#1,194 |
| 47. | Palermo | 5.0% | 36.1%(-31.1)#47 | 35.2%(-30.2)#1,213 |
| 48. | Gillette | 5.0% | 36.1%(-31.1)#48 | 35.2%(-30.2)#1,215 |
| 49. | Cookstown | 5.0% | 36.1%(-31.1)#49 | 35.2%(-30.2)#1,232 |
| 50. | Towaco | 5.1% | 36.1%(-31.1)#50 | 35.2%(-30.1)#1,250 |
| 51. | Ringwood Borough | 5.1% | 36.1%(-31.0)#51 | 35.2%(-30.1)#1,264 |
| 52. | Regency At Monroe | 5.2% | 36.1%(-31.0)#52 | 35.2%(-30.0)#1,278 |
| 53. | Pine Ridge At Crestwood | 5.2% | 36.1%(-31.0)#53 | 35.2%(-30.0)#1,288 |
| 54. | Mount Tabor | 5.3% | 36.1%(-30.9)#54 | 35.2%(-29.9)#1,319 |
| 55. | Interlaken Borough | 5.3% | 36.1%(-30.8)#55 | 35.2%(-29.9)#1,356 |
| 56. | Beach Haven West | 5.3% | 36.1%(-30.8)#56 | 35.2%(-29.8)#1,363 |
| 57. | Troy Hills | 5.4% | 36.1%(-30.8)#57 | 35.2%(-29.8)#1,365 |
| 58. | Martinsville | 5.5% | 36.1%(-30.6)#58 | 35.2%(-29.7)#1,437 |
| 59. | North Haledon Borough | 5.6% | 36.1%(-30.6)#59 | 35.2%(-29.6)#1,477 |
| 60. | Upper Stewartsville | 5.7% | 36.1%(-30.4)#60 | 35.2%(-29.5)#1,518 |
| 61. | Harlingen | 5.7% | 36.1%(-30.4)#61 | 35.2%(-29.5)#1,524 |
| 62. | Folsom Borough | 5.8% | 36.1%(-30.4)#62 | 35.2%(-29.4)#1,549 |
| 63. | Washington Crossing | 6.1% | 36.1%(-30.1)#63 | 35.2%(-29.1)#1,666 |
| 64. | Medford Lakes Borough | 6.1% | 36.1%(-30.1)#64 | 35.2%(-29.1)#1,679 |
| 65. | Harvey Cedars Borough | 6.2% | 36.1%(-29.9)#65 | 35.2%(-29.0)#1,723 |
| 66. | Brielle Borough | 6.2% | 36.1%(-29.9)#66 | 35.2%(-29.0)#1,726 |
| 67. | Greenwich | 6.4% | 36.1%(-29.8)#67 | 35.2%(-28.8)#1,784 |
| 68. | Barnegat Light Borough | 6.5% | 36.1%(-29.7)#68 | 35.2%(-28.7)#1,836 |
| 69. | Millington | 6.7% | 36.1%(-29.4)#69 | 35.2%(-28.5)#1,931 |
| 70. | Menlo Park Terrace | 6.7% | 36.1%(-29.4)#70 | 35.2%(-28.5)#1,933 |
| 71. | Newfield Borough | 6.8% | 36.1%(-29.4)#71 | 35.2%(-28.4)#1,944 |
| 72. | Cliffwood Beach | 6.8% | 36.1%(-29.4)#72 | 35.2%(-28.4)#1,957 |
| 73. | Alpine Borough | 6.8% | 36.1%(-29.3)#73 | 35.2%(-28.4)#1,965 |
| 74. | Leisure Knoll | 6.9% | 36.1%(-29.2)#74 | 35.2%(-28.3)#1,999 |
| 75. | Brass Castle | 6.9% | 36.1%(-29.2)#75 | 35.2%(-28.3)#2,011 |
| 76. | Bargaintown | 6.9% | 36.1%(-29.2)#76 | 35.2%(-28.2)#2,027 |
| 77. | Bridgewater Center | 7.1% | 36.1%(-29.1)#77 | 35.2%(-28.1)#2,093 |
| 78. | Ocean Acres | 7.1% | 36.1%(-29.0)#78 | 35.2%(-28.1)#2,111 |
| 79. | Haworth Borough | 7.1% | 36.1%(-29.0)#79 | 35.2%(-28.1)#2,114 |
| 80. | Cedar Glen West | 7.1% | 36.1%(-29.0)#80 | 35.2%(-28.1)#2,117 |
| 81. | Vienna | 7.2% | 36.1%(-29.0)#81 | 35.2%(-28.0)#2,155 |
| 82. | Sea Isle City | 7.2% | 36.1%(-28.9)#82 | 35.2%(-28.0)#2,157 |
| 83. | Fair Haven Borough | 7.2% | 36.1%(-28.9)#83 | 35.2%(-28.0)#2,170 |
| 84. | Port Reading | 7.2% | 36.1%(-28.9)#84 | 35.2%(-28.0)#2,171 |
| 85. | Rumson Borough | 7.3% | 36.1%(-28.9)#85 | 35.2%(-27.9)#2,183 |
| 86. | Ogdensburg Borough | 7.3% | 36.1%(-28.9)#86 | 35.2%(-27.9)#2,186 |
| 87. | Ocean View | 7.3% | 36.1%(-28.9)#87 | 35.2%(-27.9)#2,191 |
| 88. | Presidential Lakes Estates | 7.3% | 36.1%(-28.9)#88 | 35.2%(-27.9)#2,192 |
| 89. | Seaville | 7.3% | 36.1%(-28.8)#89 | 35.2%(-27.9)#2,220 |
| 90. | Oceanport Borough | 7.4% | 36.1%(-28.7)#90 | 35.2%(-27.8)#2,246 |
| 91. | Marlboro | 7.4% | 36.1%(-28.7)#91 | 35.2%(-27.8)#2,262 |
| 92. | Succasunna | 7.5% | 36.1%(-28.7)#92 | 35.2%(-27.7)#2,281 |
| 93. | Wanamassa | 7.7% | 36.1%(-28.4)#93 | 35.2%(-27.4)#2,429 |
| 94. | Strathmore | 7.8% | 36.1%(-28.4)#94 | 35.2%(-27.4)#2,439 |
| 95. | Ho Ho Kus Borough | 7.8% | 36.1%(-28.3)#95 | 35.2%(-27.4)#2,461 |
| 96. | Kinnelon Borough | 7.9% | 36.1%(-28.3)#96 | 35.2%(-27.3)#2,482 |
| 97. | Silver Lake Cdp Warren County | 8.0% | 36.1%(-28.2)#97 | 35.2%(-27.2)#2,525 |
| 98. | Beesleys Point | 8.0% | 36.1%(-28.1)#98 | 35.2%(-27.1)#2,561 |
| 99. | Union Beach Borough | 8.1% | 36.1%(-28.0)#99 | 35.2%(-27.1)#2,587 |
| 100. | Fairview | 8.1% | 36.1%(-28.0)#100 | 35.2%(-27.1)#2,603 |
Common Questions
What are the Top 10 Cities with the Lowest Percentage of Renter-Occupied Units in New Jersey?
Top 10 Cities with the Lowest Percentage of Renter-Occupied Units in New Jersey are:
#1
0.58%
#2
2.0%
#3
2.1%
#4
2.1%
#5
2.1%
#6
2.2%
#7
2.2%
#8
2.5%
#9
2.5%
#10
2.6%
What city has the Lowest Percentage of Renter-Occupied Units in New Jersey?
Weston has the Lowest Percentage of Renter-Occupied Units in New Jersey with 0.58%.
What is the Percentage of Renter-Occupied Units in the State of New Jersey?
Percentage of Renter-Occupied Units in New Jersey is 36.1%.
What is the Percentage of Renter-Occupied Units in the United States?
Percentage of Renter-Occupied Units in the United States is 35.2%.