Country Lake Estates, NJ Map & Demographics
Country Lake Estates Map
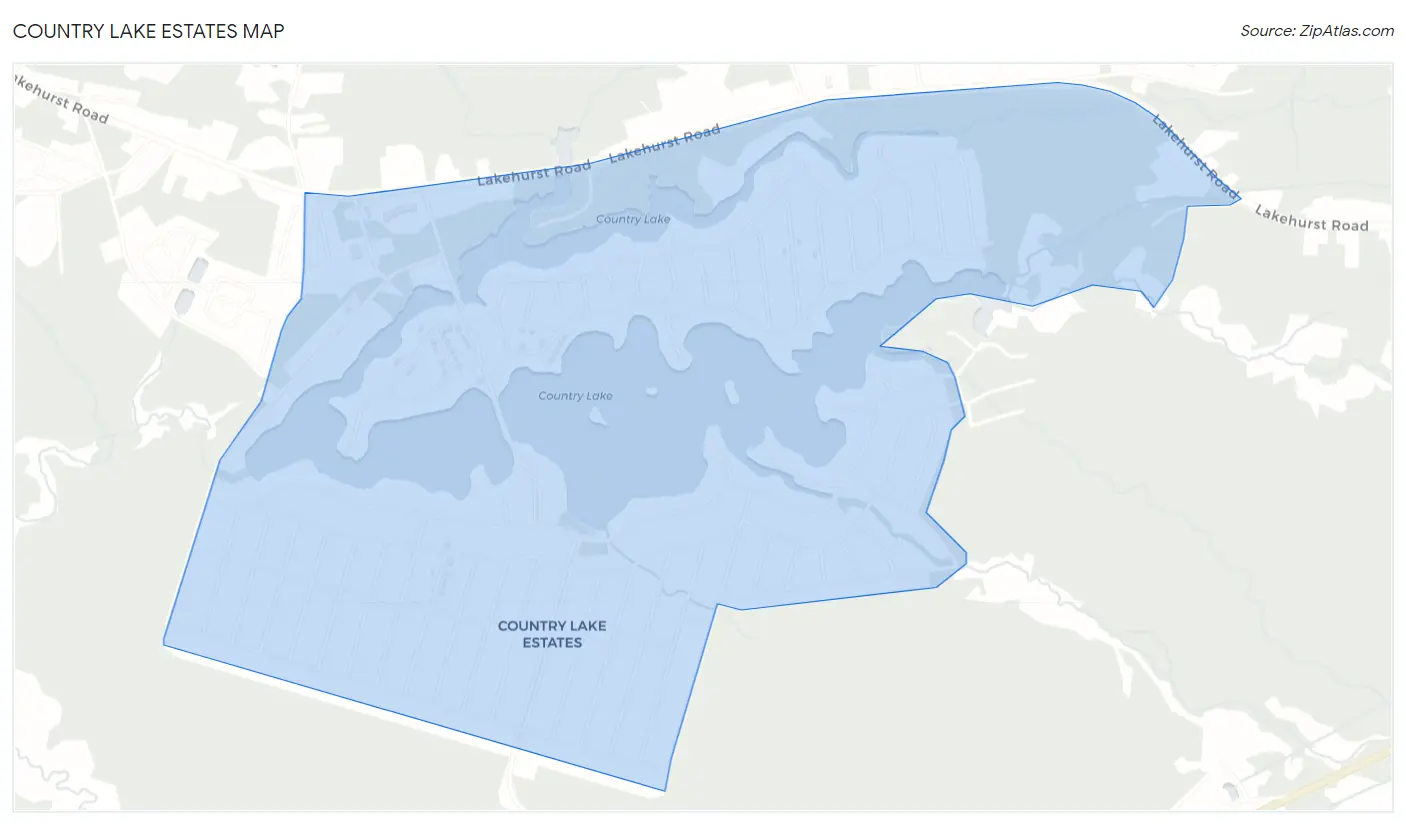
Country Lake Estates Overview
$42,749
PER CAPITA INCOME
$116,793
AVG FAMILY INCOME
$114,914
AVG HOUSEHOLD INCOME
60.6%
WAGE / INCOME GAP [ % ]
39.4¢/ $1
WAGE / INCOME GAP [ $ ]
0.35
INEQUALITY / GINI INDEX
4,179
TOTAL POPULATION
1,616
MALE POPULATION
2,563
FEMALE POPULATION
63.05
MALES / 100 FEMALES
158.60
FEMALES / 100 MALES
36.8
MEDIAN AGE
3.4
AVG FAMILY SIZE
3.2
AVG HOUSEHOLD SIZE
2,511
LABOR FORCE [ PEOPLE ]
75.2%
PERCENT IN LABOR FORCE
2.9%
UNEMPLOYMENT RATE
Income in Country Lake Estates
Income Overview in Country Lake Estates
Per Capita Income in Country Lake Estates is $42,749, while median incomes of families and households are $116,793 and $114,914 respectively.
| Characteristic | Number | Measure |
| Per Capita Income | 4,179 | $42,749 |
| Median Family Income | 1,085 | $116,793 |
| Mean Family Income | 1,085 | $132,050 |
| Median Household Income | 1,294 | $114,914 |
| Mean Household Income | 1,294 | $139,686 |
| Income Deficit | 1,085 | $0 |
| Wage / Income Gap (%) | 4,179 | 60.59% |
| Wage / Income Gap ($) | 4,179 | 39.41¢ per $1 |
| Gini / Inequality Index | 4,179 | 0.35 |
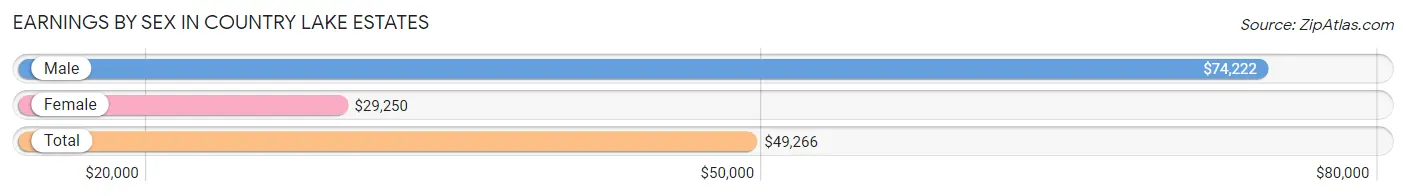
Earnings by Sex in Country Lake Estates
Average Earnings in Country Lake Estates are $49,266, $74,222 for men and $29,250 for women, a difference of 60.6%.
| Sex | Number | Average Earnings |
| Male | 974 (37.9%) | $74,222 |
| Female | 1,593 (62.1%) | $29,250 |
| Total | 2,567 (100.0%) | $49,266 |
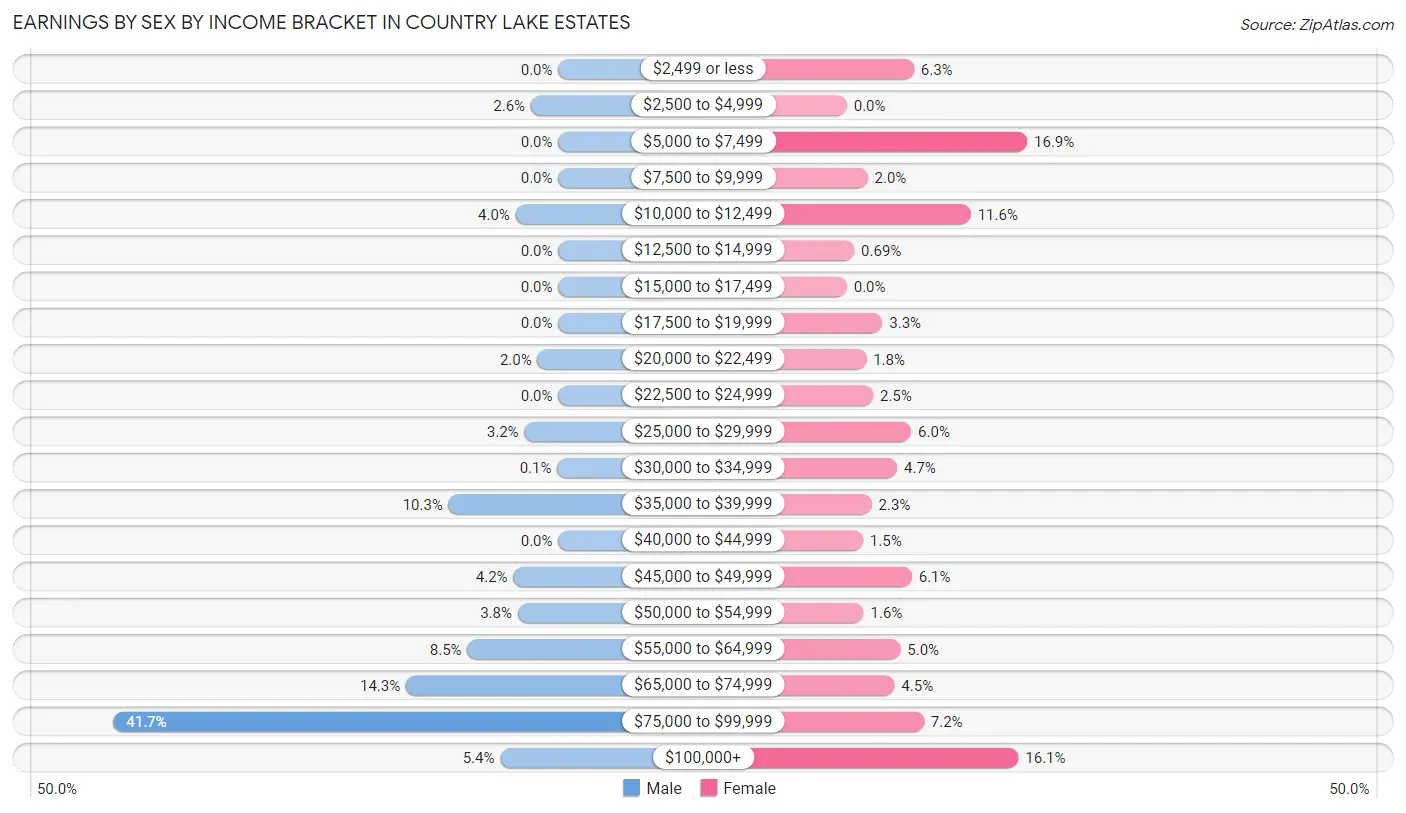
Earnings by Sex by Income Bracket in Country Lake Estates
The most common earnings brackets in Country Lake Estates are $75,000 to $99,999 for men (406 | 41.7%) and $5,000 to $7,499 for women (269 | 16.9%).
| Income | Male | Female |
| $2,499 or less | 0 (0.0%) | 100 (6.3%) |
| $2,500 to $4,999 | 25 (2.6%) | 0 (0.0%) |
| $5,000 to $7,499 | 0 (0.0%) | 269 (16.9%) |
| $7,500 to $9,999 | 0 (0.0%) | 31 (1.9%) |
| $10,000 to $12,499 | 39 (4.0%) | 185 (11.6%) |
| $12,500 to $14,999 | 0 (0.0%) | 11 (0.7%) |
| $15,000 to $17,499 | 0 (0.0%) | 0 (0.0%) |
| $17,500 to $19,999 | 0 (0.0%) | 53 (3.3%) |
| $20,000 to $22,499 | 19 (1.9%) | 29 (1.8%) |
| $22,500 to $24,999 | 0 (0.0%) | 39 (2.5%) |
| $25,000 to $29,999 | 31 (3.2%) | 96 (6.0%) |
| $30,000 to $34,999 | 1 (0.1%) | 75 (4.7%) |
| $35,000 to $39,999 | 100 (10.3%) | 37 (2.3%) |
| $40,000 to $44,999 | 0 (0.0%) | 24 (1.5%) |
| $45,000 to $49,999 | 41 (4.2%) | 97 (6.1%) |
| $50,000 to $54,999 | 37 (3.8%) | 25 (1.6%) |
| $55,000 to $64,999 | 83 (8.5%) | 80 (5.0%) |
| $65,000 to $74,999 | 139 (14.3%) | 71 (4.5%) |
| $75,000 to $99,999 | 406 (41.7%) | 115 (7.2%) |
| $100,000+ | 53 (5.4%) | 256 (16.1%) |
| Total | 974 (100.0%) | 1,593 (100.0%) |
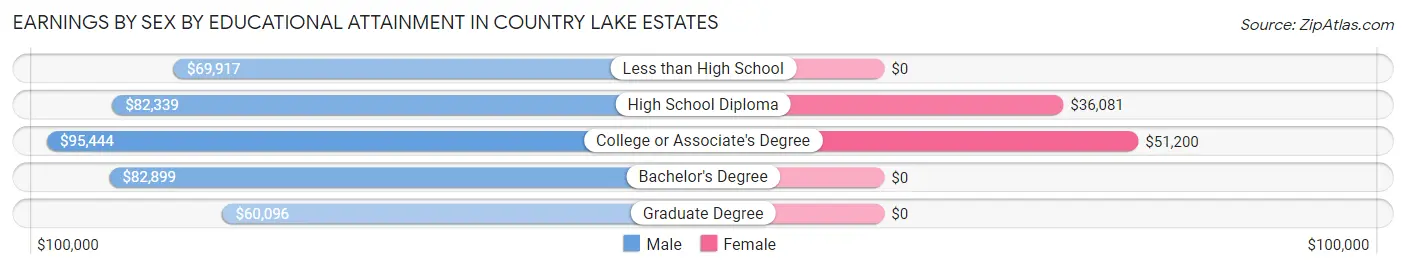
Earnings by Sex by Educational Attainment in Country Lake Estates
Average earnings in Country Lake Estates are $77,368 for men and $52,050 for women, a difference of 32.7%. Men with an educational attainment of college or associate's degree enjoy the highest average annual earnings of $95,444, while those with graduate degree education earn the least with $60,096. Women with an educational attainment of college or associate's degree earn the most with the average annual earnings of $51,200, while those with high school diploma education have the smallest earnings of $36,081.
| Educational Attainment | Male Income | Female Income |
| Less than High School | $69,917 | $0 |
| High School Diploma | $82,339 | $36,081 |
| College or Associate's Degree | $95,444 | $51,200 |
| Bachelor's Degree | $82,899 | $0 |
| Graduate Degree | $60,096 | $0 |
| Total | $77,368 | $52,050 |
Family Income in Country Lake Estates
Family Income Brackets in Country Lake Estates
According to the Country Lake Estates family income data, there are 283 families falling into the $100,000 to $149,999 income range, which is the most common income bracket and makes up 26.1% of all families.
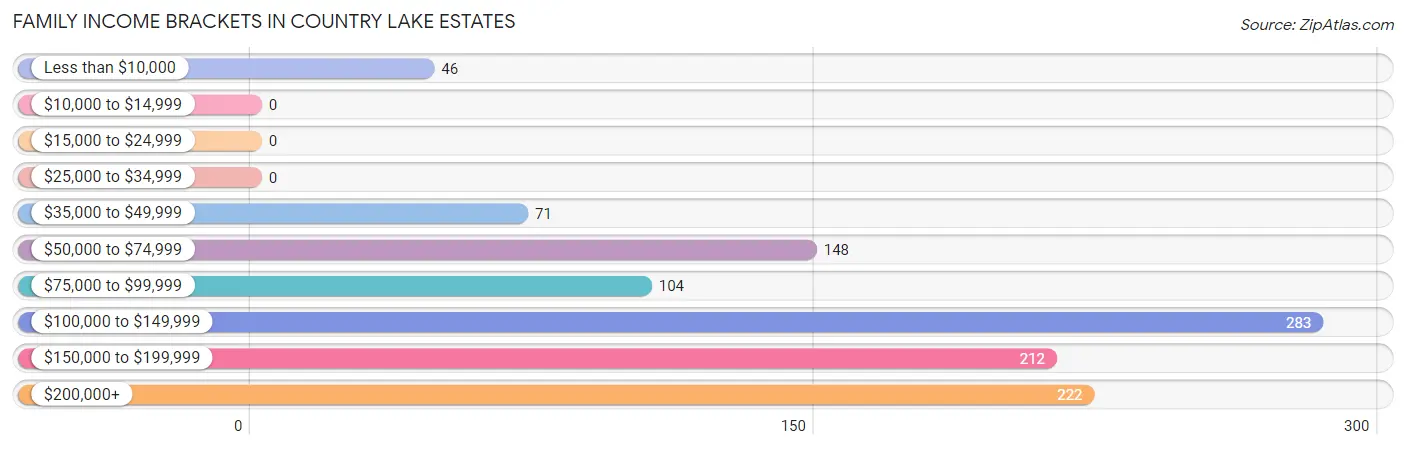
| Income Bracket | # Families | % Families |
| Less than $10,000 | 46 | 4.2% |
| $10,000 to $14,999 | 0 | 0.0% |
| $15,000 to $24,999 | 0 | 0.0% |
| $25,000 to $34,999 | 0 | 0.0% |
| $35,000 to $49,999 | 71 | 6.5% |
| $50,000 to $74,999 | 148 | 13.6% |
| $75,000 to $99,999 | 104 | 9.6% |
| $100,000 to $149,999 | 283 | 26.1% |
| $150,000 to $199,999 | 212 | 19.5% |
| $200,000+ | 222 | 20.5% |
Family Income by Famaliy Size in Country Lake Estates
4-person families (279 | 25.7%) account for the highest median family income in Country Lake Estates with $223,105 per family, while 4-person families (279 | 25.7%) have the highest median income of $55,776 per family member.
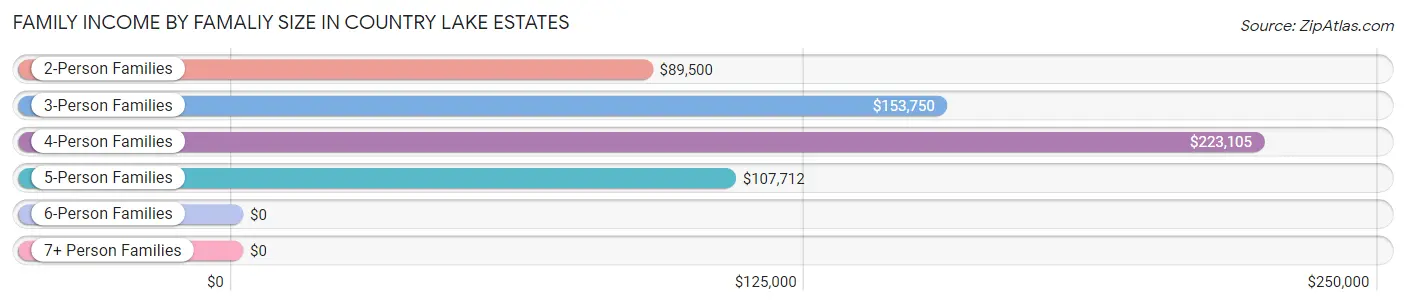
| Income Bracket | # Families | Median Income |
| 2-Person Families | 328 (30.2%) | $89,500 |
| 3-Person Families | 340 (31.3%) | $153,750 |
| 4-Person Families | 279 (25.7%) | $223,105 |
| 5-Person Families | 108 (10.0%) | $107,712 |
| 6-Person Families | 30 (2.8%) | $0 |
| 7+ Person Families | 0 (0.0%) | $0 |
| Total | 1,085 (100.0%) | $116,793 |
Family Income by Number of Earners in Country Lake Estates
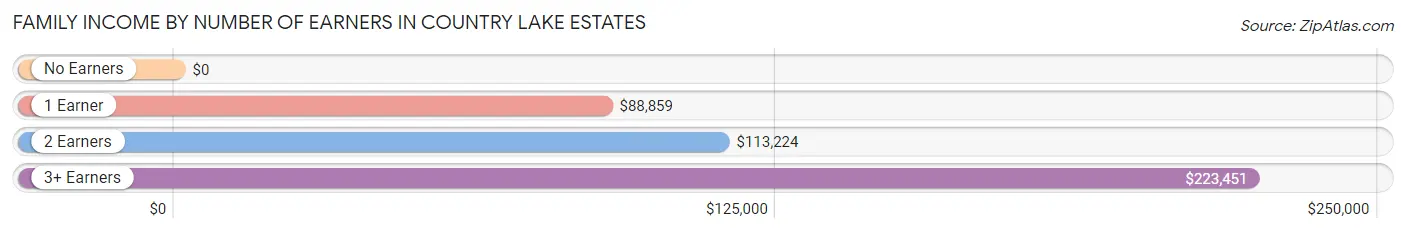
| Number of Earners | # Families | Median Income |
| No Earners | 65 (6.0%) | $0 |
| 1 Earner | 225 (20.7%) | $88,859 |
| 2 Earners | 529 (48.8%) | $113,224 |
| 3+ Earners | 266 (24.5%) | $223,451 |
| Total | 1,085 (100.0%) | $116,793 |
Household Income in Country Lake Estates
Household Income Brackets in Country Lake Estates
With 349 households falling in the category, the $100,000 to $149,999 income range is the most frequent in Country Lake Estates, accounting for 27.0% of all households.
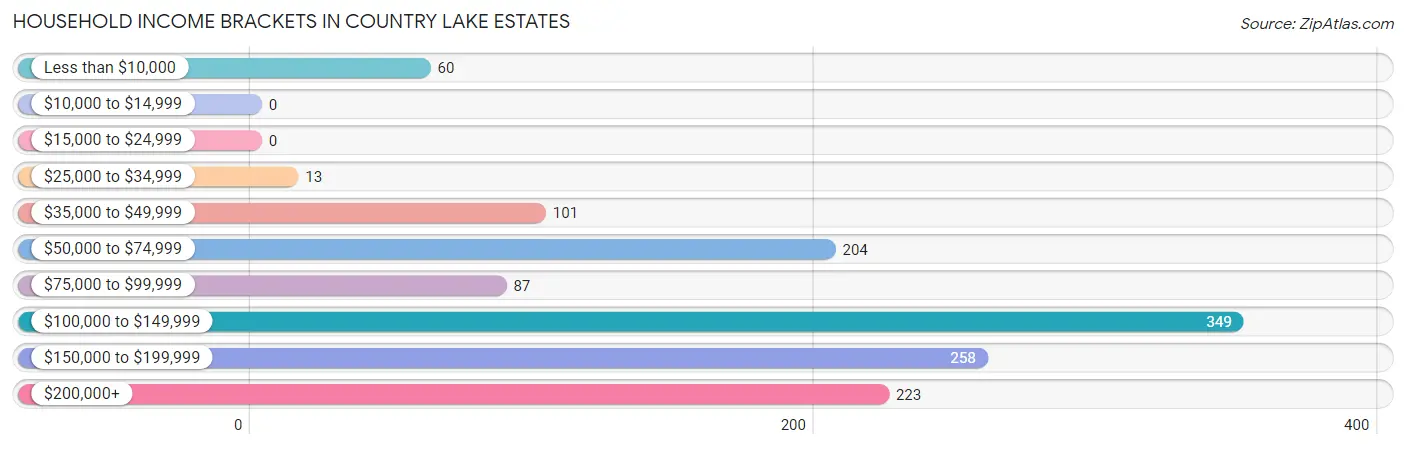
| Income Bracket | # Households | % Households |
| Less than $10,000 | 60 | 4.6% |
| $10,000 to $14,999 | 0 | 0.0% |
| $15,000 to $24,999 | 0 | 0.0% |
| $25,000 to $34,999 | 13 | 1.0% |
| $35,000 to $49,999 | 101 | 7.8% |
| $50,000 to $74,999 | 204 | 15.8% |
| $75,000 to $99,999 | 87 | 6.7% |
| $100,000 to $149,999 | 349 | 27.0% |
| $150,000 to $199,999 | 258 | 19.9% |
| $200,000+ | 223 | 17.2% |
Household Income by Householder Age in Country Lake Estates
The median household income in Country Lake Estates is $114,914, with the highest median household income of $119,866 found in the 45 to 64 years age bracket for the primary householder. A total of 737 households (57.0%) fall into this category.
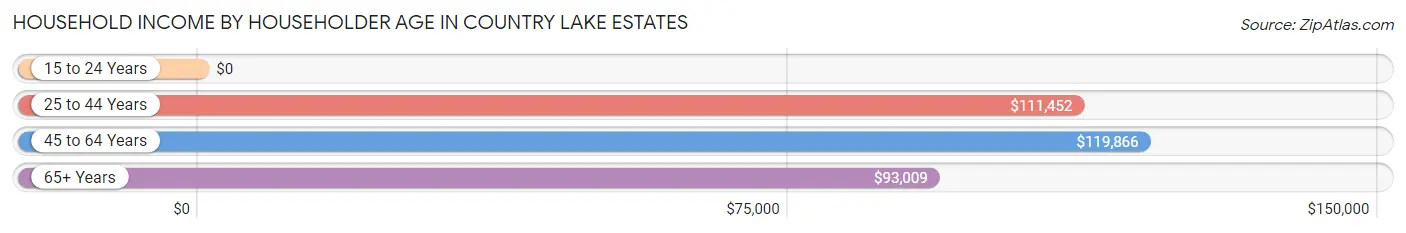
| Income Bracket | # Households | Median Income |
| 15 to 24 Years | 0 (0.0%) | $0 |
| 25 to 44 Years | 322 (24.9%) | $111,452 |
| 45 to 64 Years | 737 (57.0%) | $119,866 |
| 65+ Years | 235 (18.2%) | $93,009 |
| Total | 1,294 (100.0%) | $114,914 |
Poverty in Country Lake Estates
Income Below Poverty by Sex and Age in Country Lake Estates
With 3.7% poverty level for males and 7.0% for females among the residents of Country Lake Estates, 75 year old and over males and 65 to 74 year old females are the most vulnerable to poverty, with 46 males (54.8%) and 97 females (45.3%) in their respective age groups living below the poverty level.
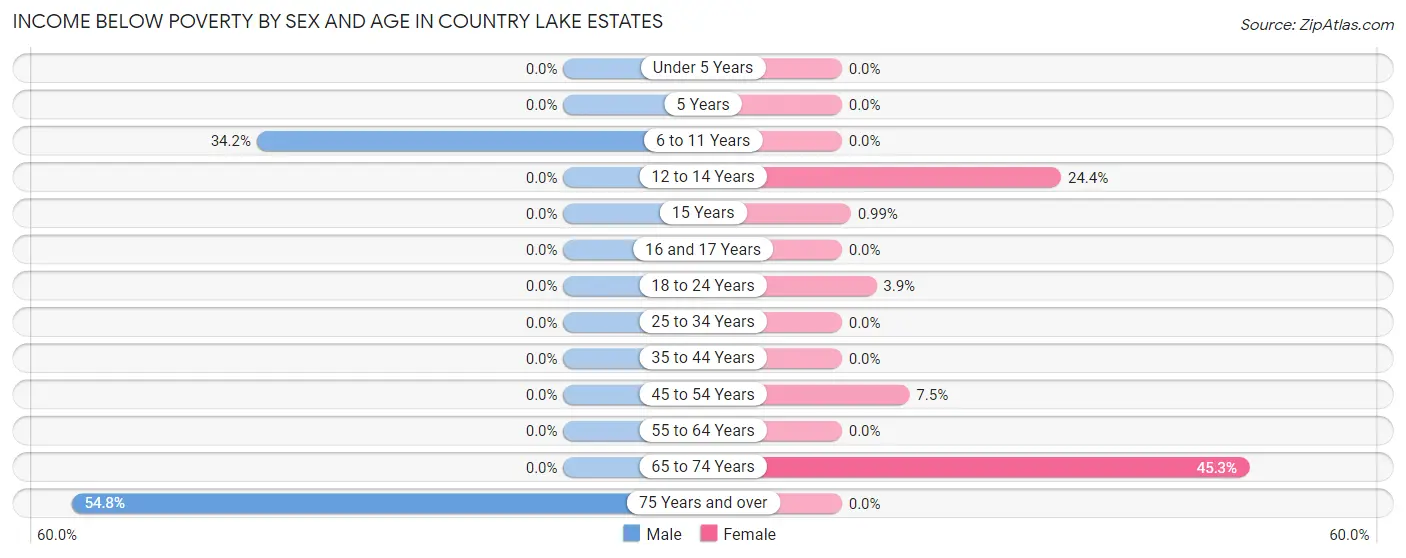
| Age Bracket | Male | Female |
| Under 5 Years | 0 (0.0%) | 0 (0.0%) |
| 5 Years | 0 (0.0%) | 0 (0.0%) |
| 6 to 11 Years | 14 (34.2%) | 0 (0.0%) |
| 12 to 14 Years | 0 (0.0%) | 21 (24.4%) |
| 15 Years | 0 (0.0%) | 2 (1.0%) |
| 16 and 17 Years | 0 (0.0%) | 0 (0.0%) |
| 18 to 24 Years | 0 (0.0%) | 24 (3.8%) |
| 25 to 34 Years | 0 (0.0%) | 0 (0.0%) |
| 35 to 44 Years | 0 (0.0%) | 0 (0.0%) |
| 45 to 54 Years | 0 (0.0%) | 35 (7.5%) |
| 55 to 64 Years | 0 (0.0%) | 0 (0.0%) |
| 65 to 74 Years | 0 (0.0%) | 97 (45.3%) |
| 75 Years and over | 46 (54.8%) | 0 (0.0%) |
| Total | 60 (3.7%) | 179 (7.0%) |
Income Above Poverty by Sex and Age in Country Lake Estates
According to the poverty statistics in Country Lake Estates, males aged under 5 years and females aged under 5 years are the age groups that are most secure financially, with 100.0% of males and 100.0% of females in these age groups living above the poverty line.
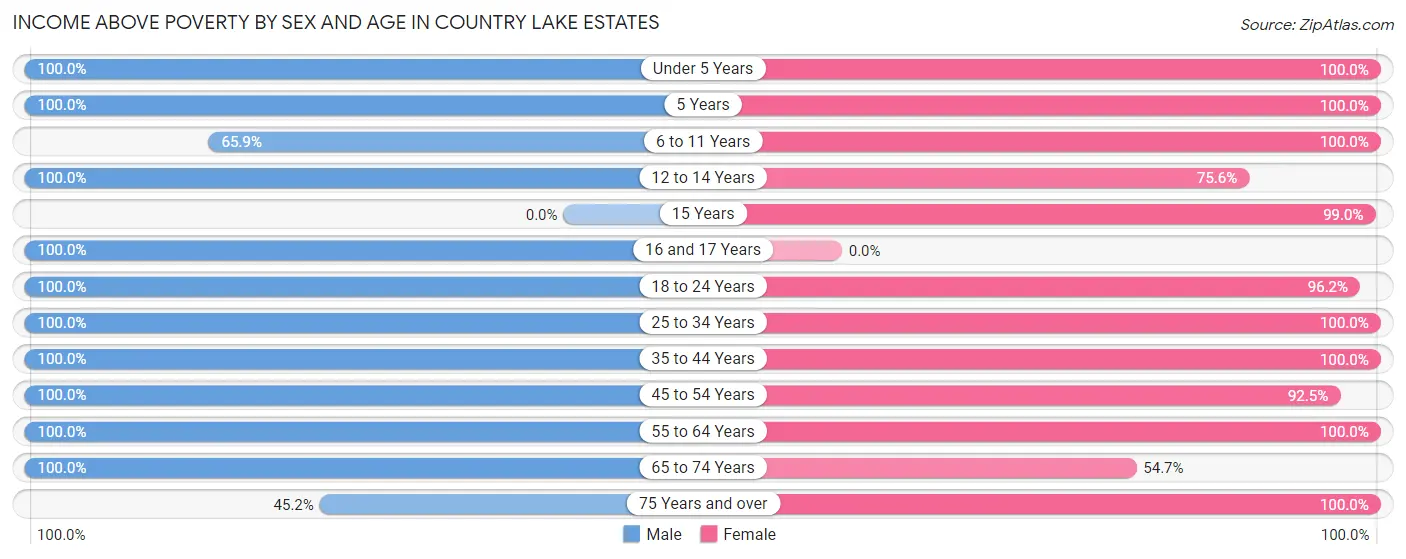
| Age Bracket | Male | Female |
| Under 5 Years | 108 (100.0%) | 178 (100.0%) |
| 5 Years | 34 (100.0%) | 23 (100.0%) |
| 6 to 11 Years | 27 (65.8%) | 105 (100.0%) |
| 12 to 14 Years | 45 (100.0%) | 65 (75.6%) |
| 15 Years | 0 (0.0%) | 200 (99.0%) |
| 16 and 17 Years | 80 (100.0%) | 0 (0.0%) |
| 18 to 24 Years | 203 (100.0%) | 599 (96.2%) |
| 25 to 34 Years | 70 (100.0%) | 177 (100.0%) |
| 35 to 44 Years | 311 (100.0%) | 209 (100.0%) |
| 45 to 54 Years | 280 (100.0%) | 430 (92.5%) |
| 55 to 64 Years | 251 (100.0%) | 227 (100.0%) |
| 65 to 74 Years | 109 (100.0%) | 117 (54.7%) |
| 75 Years and over | 38 (45.2%) | 36 (100.0%) |
| Total | 1,556 (96.3%) | 2,366 (93.0%) |
Income Below Poverty Among Married-Couple Families in Country Lake Estates
The poverty statistics for married-couple families in Country Lake Estates show that 7.1% or 46 of the total 649 families live below the poverty line. Families with no children have the highest poverty rate of 7.8%, comprising of 30 families. On the other hand, families with 3 or 4 children have the lowest poverty rate of 0.0%, which includes 0 families.
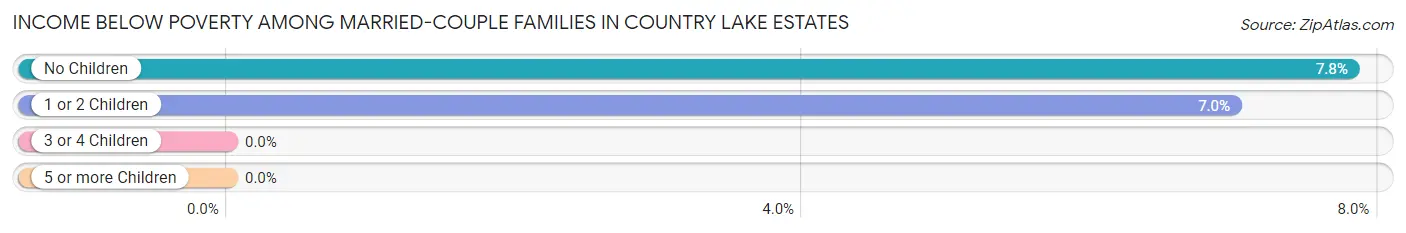
| Children | Above Poverty | Below Poverty |
| No Children | 354 (92.2%) | 30 (7.8%) |
| 1 or 2 Children | 213 (93.0%) | 16 (7.0%) |
| 3 or 4 Children | 36 (100.0%) | 0 (0.0%) |
| 5 or more Children | 0 (0.0%) | 0 (0.0%) |
| Total | 603 (92.9%) | 46 (7.1%) |
Income Below Poverty Among Single-Parent Households in Country Lake Estates
| Children | Single Father | Single Mother |
| No Children | 0 (0.0%) | 0 (0.0%) |
| 1 or 2 Children | 0 (0.0%) | 0 (0.0%) |
| 3 or 4 Children | 0 (0.0%) | 0 (0.0%) |
| 5 or more Children | 0 (0.0%) | 0 (0.0%) |
| Total | 0 (0.0%) | 0 (0.0%) |
Income Below Poverty Among Married-Couple vs Single-Parent Households in Country Lake Estates
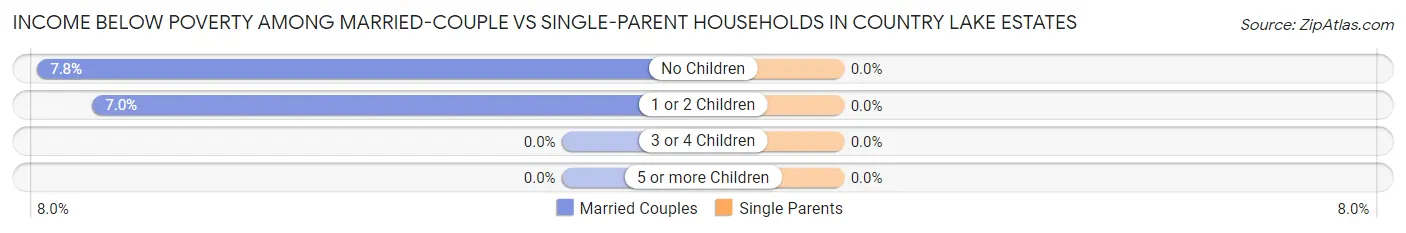
| Children | Married-Couple Families | Single-Parent Households |
| No Children | 30 (7.8%) | 0 (0.0%) |
| 1 or 2 Children | 16 (7.0%) | 0 (0.0%) |
| 3 or 4 Children | 0 (0.0%) | 0 (0.0%) |
| 5 or more Children | 0 (0.0%) | 0 (0.0%) |
| Total | 46 (7.1%) | 0 (0.0%) |
Race in Country Lake Estates
The most populous races in Country Lake Estates are White / Caucasian (2,245 | 53.7%), Black / African American (1,037 | 24.8%), and Two or more Races (608 | 14.5%).
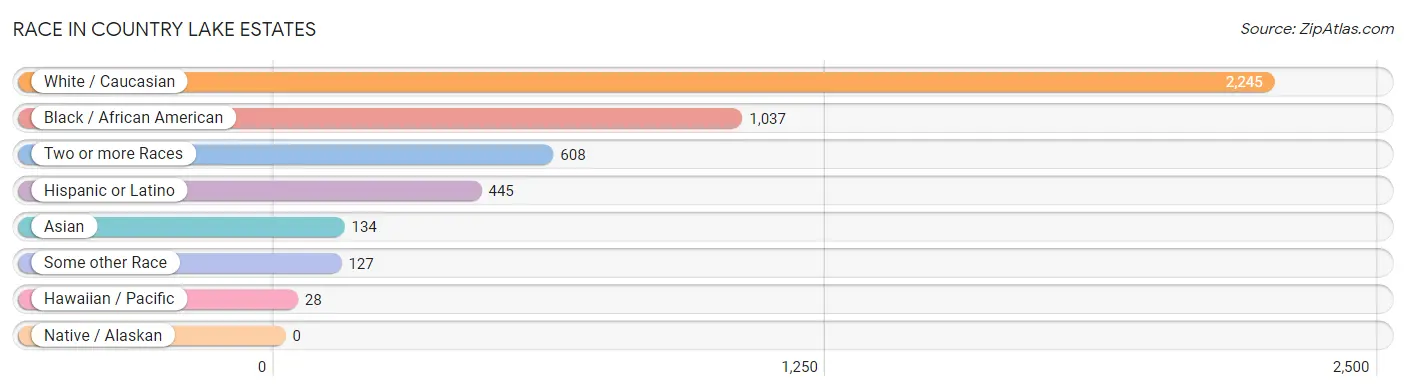
| Race | # Population | % Population |
| Asian | 134 | 3.2% |
| Black / African American | 1,037 | 24.8% |
| Hawaiian / Pacific | 28 | 0.7% |
| Hispanic or Latino | 445 | 10.6% |
| Native / Alaskan | 0 | 0.0% |
| White / Caucasian | 2,245 | 53.7% |
| Two or more Races | 608 | 14.5% |
| Some other Race | 127 | 3.0% |
| Total | 4,179 | 100.0% |
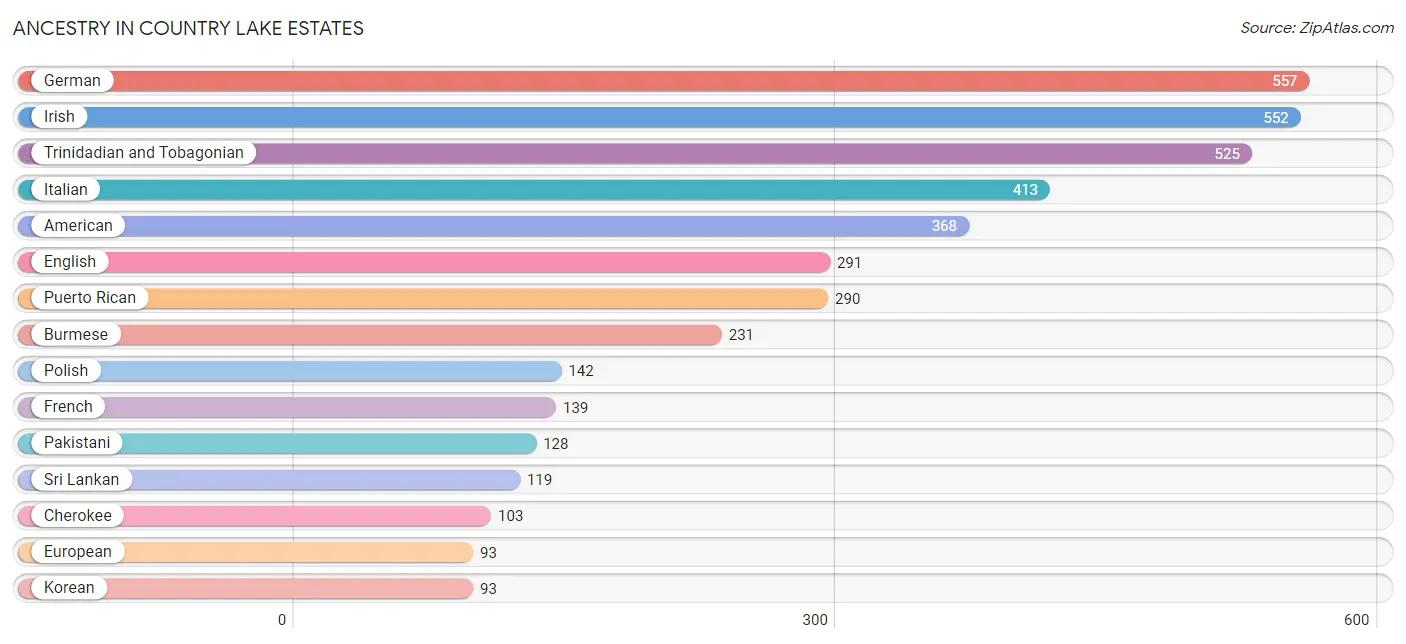
Ancestry in Country Lake Estates
The most populous ancestries reported in Country Lake Estates are German (557 | 13.3%), Irish (552 | 13.2%), Trinidadian and Tobagonian (525 | 12.6%), Italian (413 | 9.9%), and American (368 | 8.8%), together accounting for 57.8% of all Country Lake Estates residents.
| Ancestry | # Population | % Population |
| American | 368 | 8.8% |
| Bhutanese | 78 | 1.9% |
| Burmese | 231 | 5.5% |
| Canadian | 19 | 0.4% |
| Central American | 34 | 0.8% |
| Cherokee | 103 | 2.5% |
| Czech | 12 | 0.3% |
| English | 291 | 7.0% |
| European | 93 | 2.2% |
| French | 139 | 3.3% |
| German | 557 | 13.3% |
| Honduran | 34 | 0.8% |
| Hungarian | 13 | 0.3% |
| Irish | 552 | 13.2% |
| Italian | 413 | 9.9% |
| Korean | 93 | 2.2% |
| Malaysian | 21 | 0.5% |
| Mexican | 93 | 2.2% |
| Native Hawaiian | 72 | 1.7% |
| Pakistani | 128 | 3.1% |
| Polish | 142 | 3.4% |
| Puerto Rican | 290 | 6.9% |
| Scotch-Irish | 51 | 1.2% |
| Scottish | 13 | 0.3% |
| Spanish | 28 | 0.7% |
| Sri Lankan | 119 | 2.9% |
| Thai | 35 | 0.8% |
| Trinidadian and Tobagonian | 525 | 12.6% | View All 28 Rows |
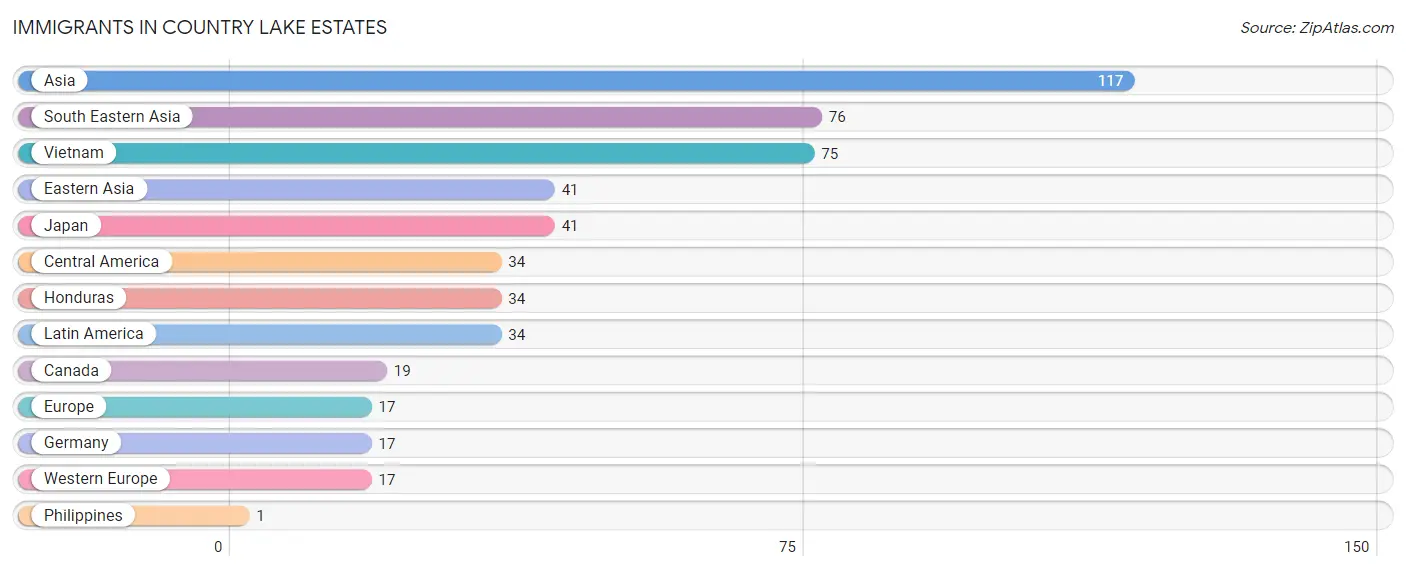
Immigrants in Country Lake Estates
The most numerous immigrant groups reported in Country Lake Estates came from Asia (117 | 2.8%), South Eastern Asia (76 | 1.8%), Vietnam (75 | 1.8%), Eastern Asia (41 | 1.0%), and Japan (41 | 1.0%), together accounting for 8.4% of all Country Lake Estates residents.
| Immigration Origin | # Population | % Population |
| Asia | 117 | 2.8% |
| Canada | 19 | 0.4% |
| Central America | 34 | 0.8% |
| Eastern Asia | 41 | 1.0% |
| Europe | 17 | 0.4% |
| Germany | 17 | 0.4% |
| Honduras | 34 | 0.8% |
| Japan | 41 | 1.0% |
| Latin America | 34 | 0.8% |
| Philippines | 1 | 0.0% |
| South Eastern Asia | 76 | 1.8% |
| Vietnam | 75 | 1.8% |
| Western Europe | 17 | 0.4% | View All 13 Rows |
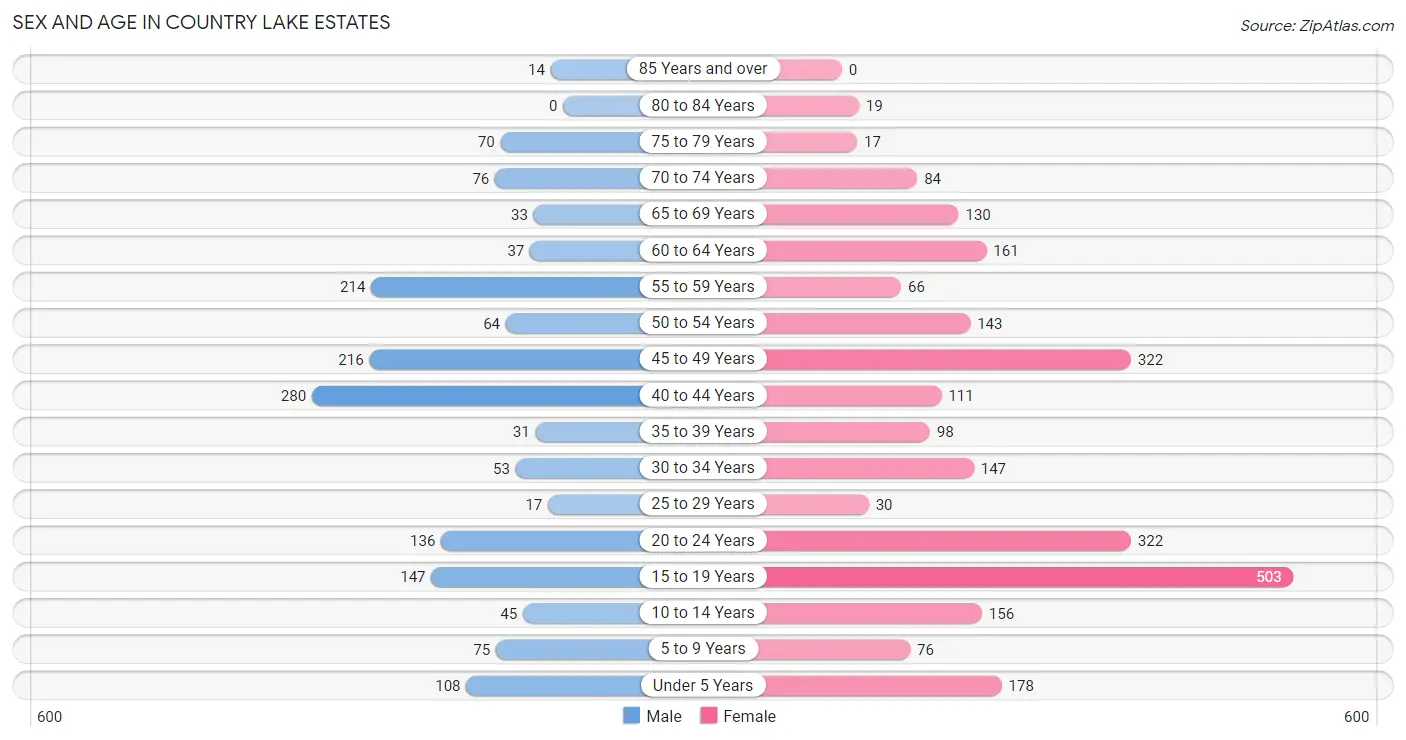
Sex and Age in Country Lake Estates
Sex and Age in Country Lake Estates
The most populous age groups in Country Lake Estates are 40 to 44 Years (280 | 17.3%) for men and 15 to 19 Years (503 | 19.6%) for women.
| Age Bracket | Male | Female |
| Under 5 Years | 108 (6.7%) | 178 (6.9%) |
| 5 to 9 Years | 75 (4.6%) | 76 (3.0%) |
| 10 to 14 Years | 45 (2.8%) | 156 (6.1%) |
| 15 to 19 Years | 147 (9.1%) | 503 (19.6%) |
| 20 to 24 Years | 136 (8.4%) | 322 (12.6%) |
| 25 to 29 Years | 17 (1.1%) | 30 (1.2%) |
| 30 to 34 Years | 53 (3.3%) | 147 (5.7%) |
| 35 to 39 Years | 31 (1.9%) | 98 (3.8%) |
| 40 to 44 Years | 280 (17.3%) | 111 (4.3%) |
| 45 to 49 Years | 216 (13.4%) | 322 (12.6%) |
| 50 to 54 Years | 64 (4.0%) | 143 (5.6%) |
| 55 to 59 Years | 214 (13.2%) | 66 (2.6%) |
| 60 to 64 Years | 37 (2.3%) | 161 (6.3%) |
| 65 to 69 Years | 33 (2.0%) | 130 (5.1%) |
| 70 to 74 Years | 76 (4.7%) | 84 (3.3%) |
| 75 to 79 Years | 70 (4.3%) | 17 (0.7%) |
| 80 to 84 Years | 0 (0.0%) | 19 (0.7%) |
| 85 Years and over | 14 (0.9%) | 0 (0.0%) |
| Total | 1,616 (100.0%) | 2,563 (100.0%) |
Families and Households in Country Lake Estates
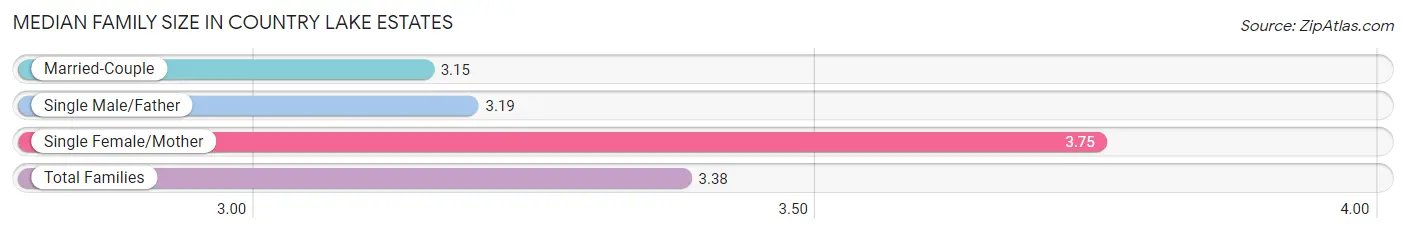
Median Family Size in Country Lake Estates
The median family size in Country Lake Estates is 3.38 persons per family, with single female/mother families (420 | 38.7%) accounting for the largest median family size of 3.75 persons per family. On the other hand, married-couple families (649 | 59.8%) represent the smallest median family size with 3.15 persons per family.
| Family Type | # Families | Family Size |
| Married-Couple | 649 (59.8%) | 3.15 |
| Single Male/Father | 16 (1.5%) | 3.19 |
| Single Female/Mother | 420 (38.7%) | 3.75 |
| Total Families | 1,085 (100.0%) | 3.38 |
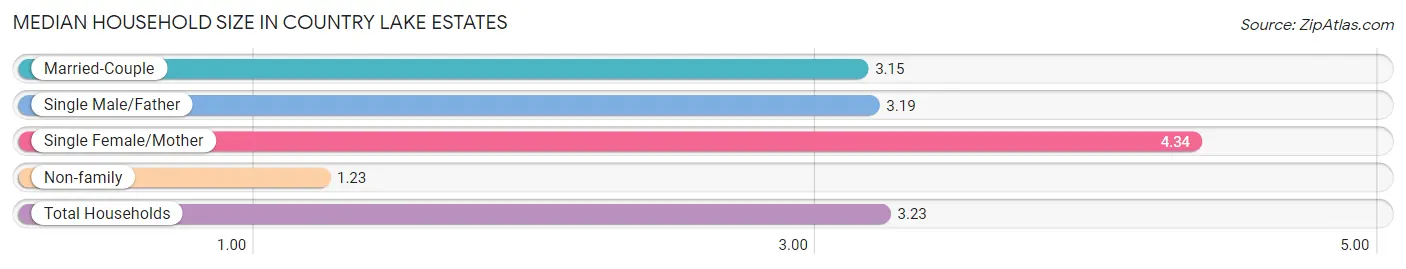
Median Household Size in Country Lake Estates
The median household size in Country Lake Estates is 3.23 persons per household, with single female/mother households (420 | 32.5%) accounting for the largest median household size of 4.34 persons per household. non-family households (209 | 16.2%) represent the smallest median household size with 1.23 persons per household.
| Household Type | # Households | Household Size |
| Married-Couple | 649 (50.1%) | 3.15 |
| Single Male/Father | 16 (1.2%) | 3.19 |
| Single Female/Mother | 420 (32.5%) | 4.34 |
| Non-family | 209 (16.2%) | 1.23 |
| Total Households | 1,294 (100.0%) | 3.23 |
Household Size by Marriage Status in Country Lake Estates
Out of a total of 1,294 households in Country Lake Estates, 1,085 (83.9%) are family households, while 209 (16.2%) are nonfamily households. The most numerous type of family households are 2-person households, comprising 311, and the most common type of nonfamily households are 1-person households, comprising 165.
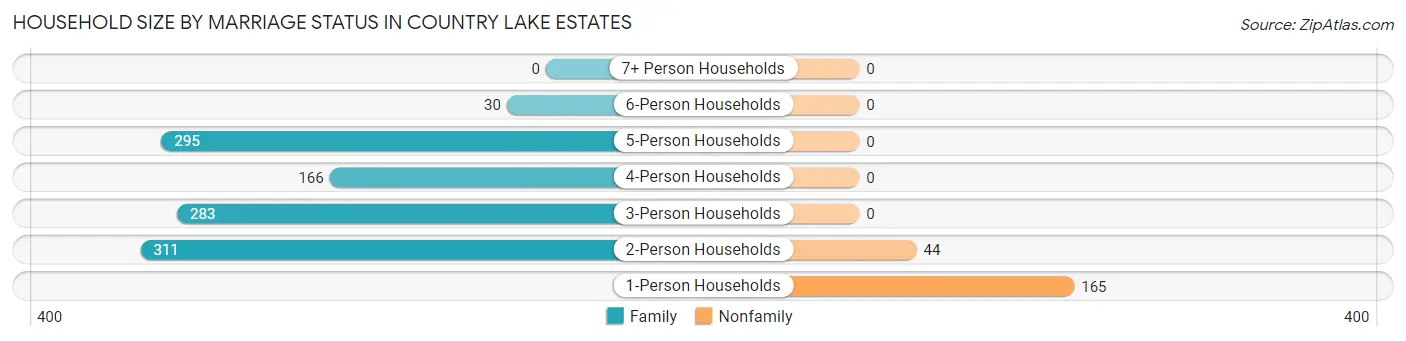
| Household Size | Family Households | Nonfamily Households |
| 1-Person Households | - | 165 (12.8%) |
| 2-Person Households | 311 (24.0%) | 44 (3.4%) |
| 3-Person Households | 283 (21.9%) | 0 (0.0%) |
| 4-Person Households | 166 (12.8%) | 0 (0.0%) |
| 5-Person Households | 295 (22.8%) | 0 (0.0%) |
| 6-Person Households | 30 (2.3%) | 0 (0.0%) |
| 7+ Person Households | 0 (0.0%) | 0 (0.0%) |
| Total | 1,085 (83.9%) | 209 (16.2%) |
Female Fertility in Country Lake Estates
Fertility by Age in Country Lake Estates
Average fertility rate in Country Lake Estates is 37.0 births per 1,000 women. Women in the age bracket of 20 to 34 years have the highest fertility rate with 118.0 births per 1,000 women. Women in the age bracket of 20 to 34 years acount for 100.0% of all women with births.
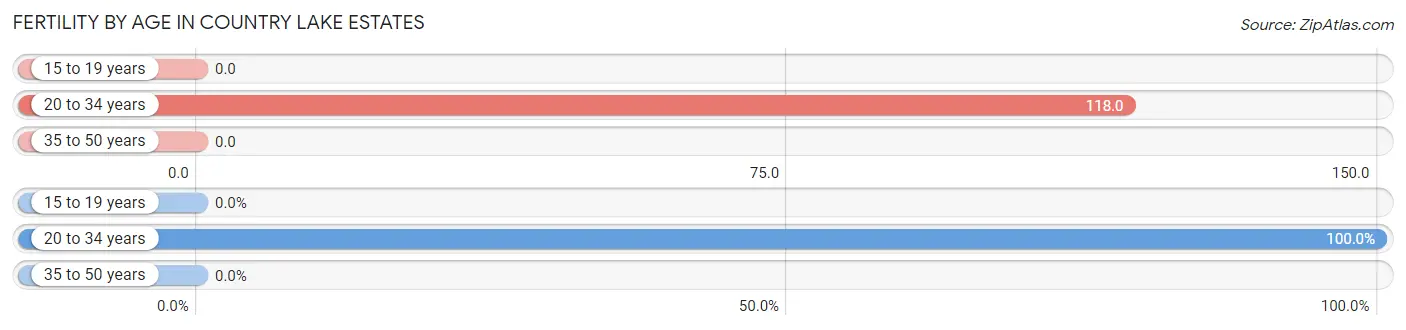
| Age Bracket | Women with Births | Births / 1,000 Women |
| 15 to 19 years | 0 (0.0%) | 0.0 |
| 20 to 34 years | 59 (100.0%) | 118.0 |
| 35 to 50 years | 0 (0.0%) | 0.0 |
| Total | 59 (100.0%) | 37.0 |
Fertility by Age by Marriage Status in Country Lake Estates
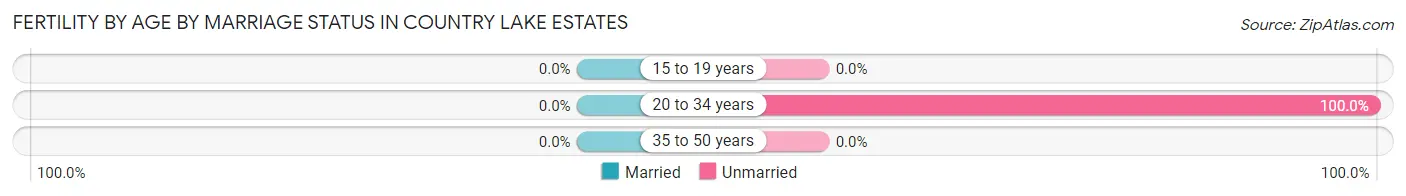
| Age Bracket | Married | Unmarried |
| 15 to 19 years | 0 (0.0%) | 0 (0.0%) |
| 20 to 34 years | 0 (0.0%) | 59 (100.0%) |
| 35 to 50 years | 0 (0.0%) | 0 (0.0%) |
| Total | 0 (0.0%) | 59 (100.0%) |
Fertility by Education in Country Lake Estates
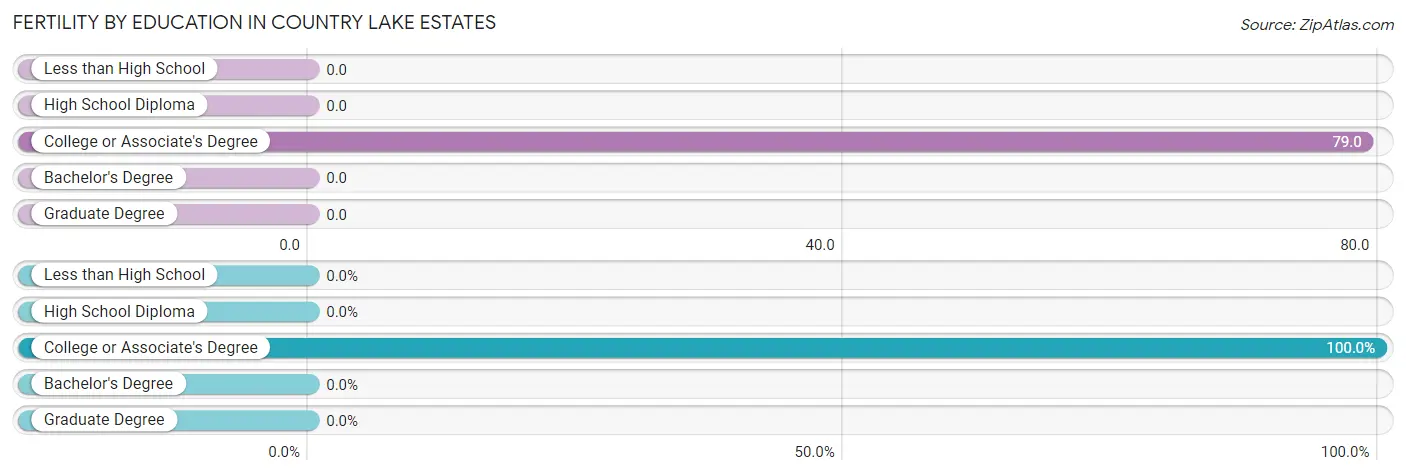
| Educational Attainment | Women with Births | Births / 1,000 Women |
| Less than High School | 0 (0.0%) | 0.0 |
| High School Diploma | 0 (0.0%) | 0.0 |
| College or Associate's Degree | 59 (100.0%) | 79.0 |
| Bachelor's Degree | 0 (0.0%) | 0.0 |
| Graduate Degree | 0 (0.0%) | 0.0 |
| Total | 59 (100.0%) | 37.0 |
Fertility by Education by Marriage Status in Country Lake Estates
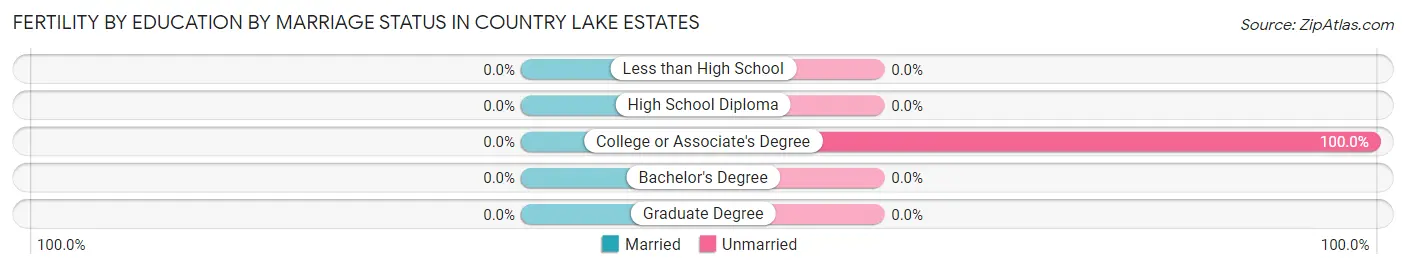
| Educational Attainment | Married | Unmarried |
| Less than High School | 0 (0.0%) | 0 (0.0%) |
| High School Diploma | 0 (0.0%) | 0 (0.0%) |
| College or Associate's Degree | 0 (0.0%) | 59 (100.0%) |
| Bachelor's Degree | 0 (0.0%) | 0 (0.0%) |
| Graduate Degree | 0 (0.0%) | 0 (0.0%) |
| Total | 0 (0.0%) | 59 (100.0%) |
Employment Characteristics in Country Lake Estates
Employment by Class of Employer in Country Lake Estates
Among the 2,411 employed individuals in Country Lake Estates, private company employees (1,383 | 57.4%), local government employees (418 | 17.3%), and federal government employees (302 | 12.5%) make up the most common classes of employment.
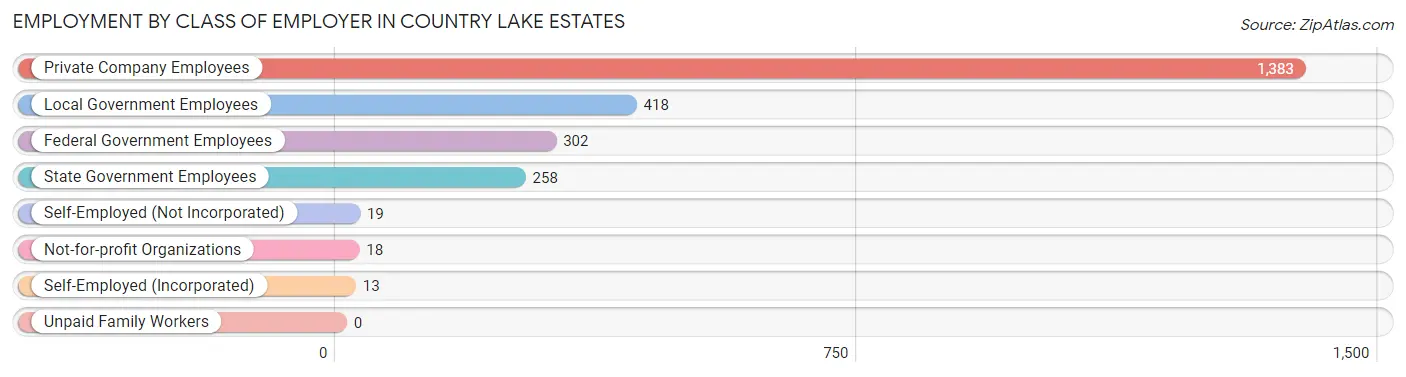
| Employer Class | # Employees | % Employees |
| Private Company Employees | 1,383 | 57.4% |
| Self-Employed (Incorporated) | 13 | 0.5% |
| Self-Employed (Not Incorporated) | 19 | 0.8% |
| Not-for-profit Organizations | 18 | 0.7% |
| Local Government Employees | 418 | 17.3% |
| State Government Employees | 258 | 10.7% |
| Federal Government Employees | 302 | 12.5% |
| Unpaid Family Workers | 0 | 0.0% |
| Total | 2,411 | 100.0% |
Employment Status by Age in Country Lake Estates
According to the labor force statistics for Country Lake Estates, out of the total population over 16 years of age (3,339), 75.2% or 2,511 individuals are in the labor force, with 2.9% or 73 of them unemployed. The age group with the highest labor force participation rate is 25 to 29 years, with 100.0% or 47 individuals in the labor force. Within the labor force, the 16 to 19 years age range has the highest percentage of unemployed individuals, with 10.7% or 31 of them being unemployed.
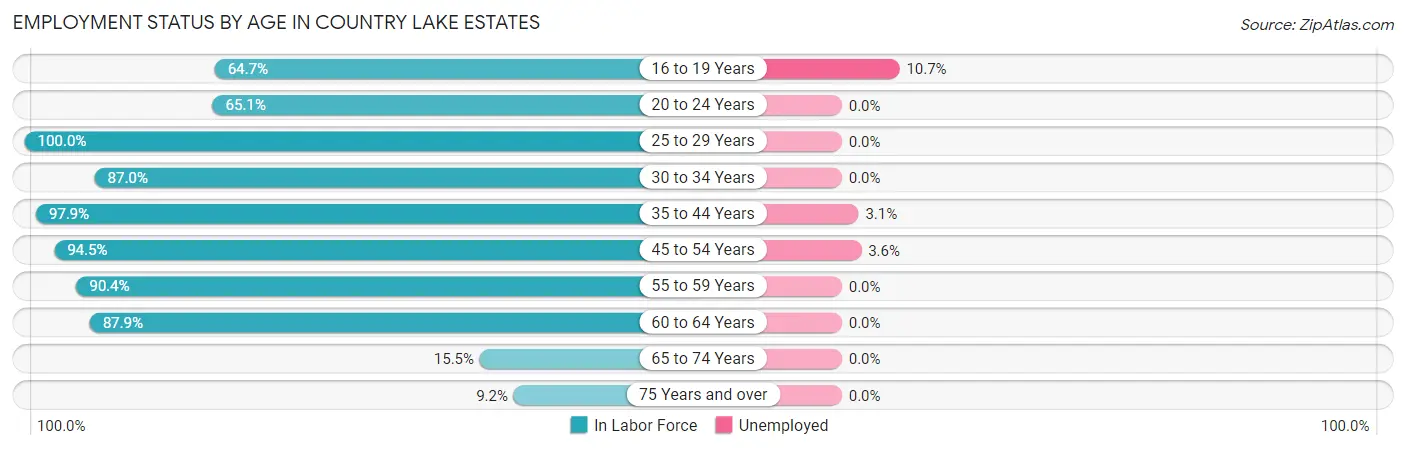
| Age Bracket | In Labor Force | Unemployed |
| 16 to 19 Years | 290 (64.7%) | 31 (10.7%) |
| 20 to 24 Years | 298 (65.1%) | 0 (0.0%) |
| 25 to 29 Years | 47 (100.0%) | 0 (0.0%) |
| 30 to 34 Years | 174 (87.0%) | 0 (0.0%) |
| 35 to 44 Years | 509 (97.9%) | 16 (3.1%) |
| 45 to 54 Years | 704 (94.5%) | 25 (3.6%) |
| 55 to 59 Years | 253 (90.4%) | 0 (0.0%) |
| 60 to 64 Years | 174 (87.9%) | 0 (0.0%) |
| 65 to 74 Years | 50 (15.5%) | 0 (0.0%) |
| 75 Years and over | 11 (9.2%) | 0 (0.0%) |
| Total | 2,511 (75.2%) | 73 (2.9%) |
Employment Status by Educational Attainment in Country Lake Estates
According to labor force statistics for Country Lake Estates, 93.5% of individuals (1,861) out of the total population between 25 and 64 years of age (1,990) are in the labor force, with 2.2% or 41 of them being unemployed. The group with the highest labor force participation rate are those with the educational attainment of high school diploma, with 95.1% or 500 individuals in the labor force. Within the labor force, individuals with less than high school education have the highest percentage of unemployment, with 7.4% or 16 of them being unemployed.
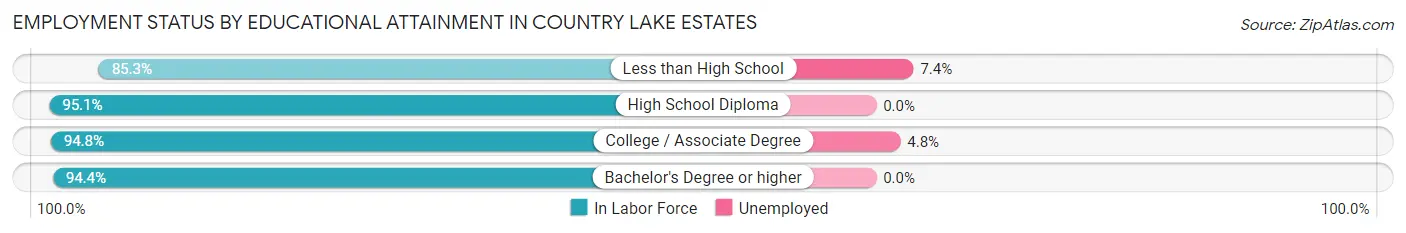
| Educational Attainment | In Labor Force | Unemployed |
| Less than High School | 215 (85.3%) | 19 (7.4%) |
| High School Diploma | 500 (95.1%) | 0 (0.0%) |
| College / Associate Degree | 506 (94.8%) | 26 (4.8%) |
| Bachelor's Degree or higher | 640 (94.4%) | 0 (0.0%) |
| Total | 1,861 (93.5%) | 44 (2.2%) |
Employment Occupations by Sex in Country Lake Estates
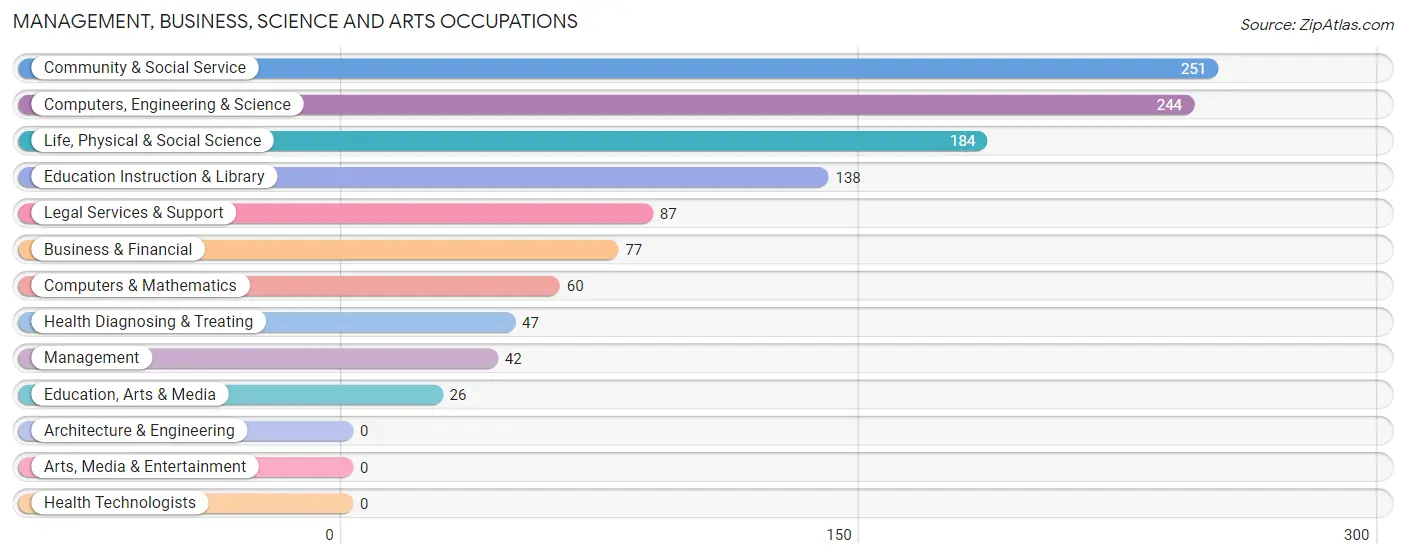
Management, Business, Science and Arts Occupations
The most common Management, Business, Science and Arts occupations in Country Lake Estates are Community & Social Service (251 | 10.8%), Computers, Engineering & Science (244 | 10.5%), Life, Physical & Social Science (184 | 7.9%), Education Instruction & Library (138 | 5.9%), and Legal Services & Support (87 | 3.7%).
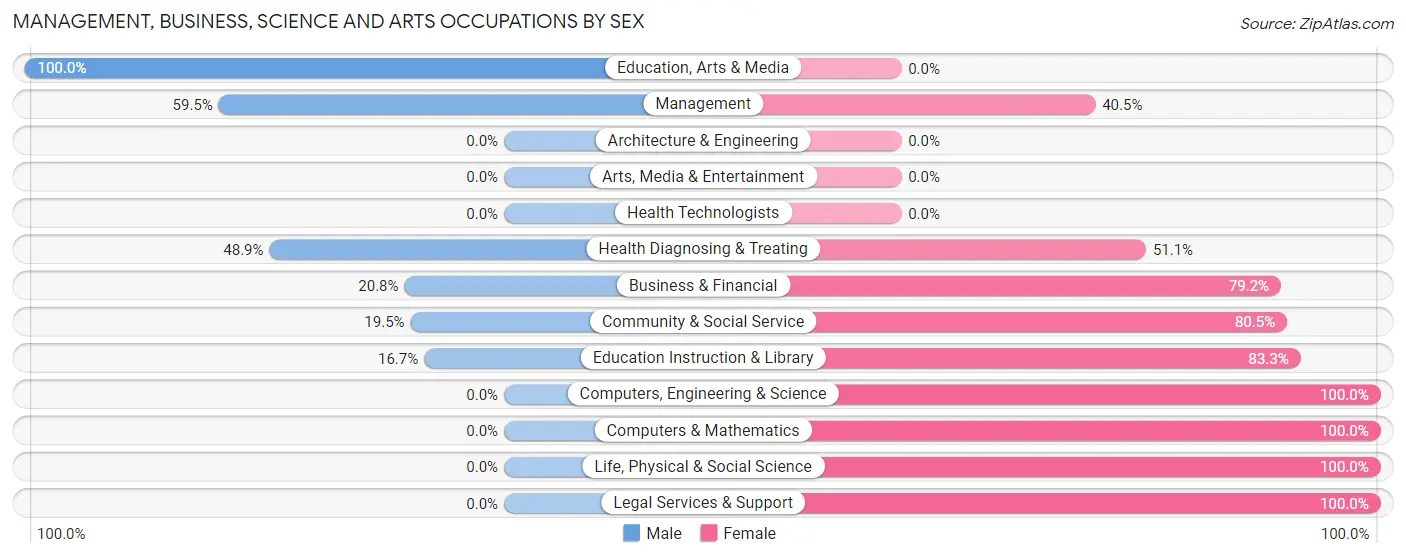
Management, Business, Science and Arts Occupations by Sex
Within the Management, Business, Science and Arts occupations in Country Lake Estates, the most male-oriented occupations are Education, Arts & Media (100.0%), Management (59.5%), and Health Diagnosing & Treating (48.9%), while the most female-oriented occupations are Computers, Engineering & Science (100.0%), Computers & Mathematics (100.0%), and Life, Physical & Social Science (100.0%).
| Occupation | Male | Female |
| Management | 25 (59.5%) | 17 (40.5%) |
| Business & Financial | 16 (20.8%) | 61 (79.2%) |
| Computers, Engineering & Science | 0 (0.0%) | 244 (100.0%) |
| Computers & Mathematics | 0 (0.0%) | 60 (100.0%) |
| Architecture & Engineering | 0 (0.0%) | 0 (0.0%) |
| Life, Physical & Social Science | 0 (0.0%) | 184 (100.0%) |
| Community & Social Service | 49 (19.5%) | 202 (80.5%) |
| Education, Arts & Media | 26 (100.0%) | 0 (0.0%) |
| Legal Services & Support | 0 (0.0%) | 87 (100.0%) |
| Education Instruction & Library | 23 (16.7%) | 115 (83.3%) |
| Arts, Media & Entertainment | 0 (0.0%) | 0 (0.0%) |
| Health Diagnosing & Treating | 23 (48.9%) | 24 (51.1%) |
| Health Technologists | 0 (0.0%) | 0 (0.0%) |
| Total (Category) | 113 (17.1%) | 548 (82.9%) |
| Total (Overall) | 859 (37.0%) | 1,465 (63.0%) |
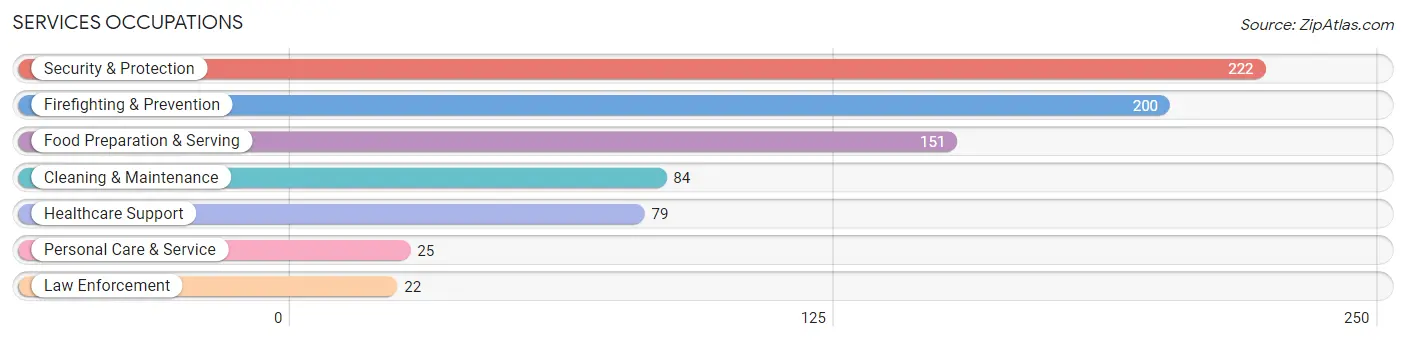
Services Occupations
The most common Services occupations in Country Lake Estates are Security & Protection (222 | 9.6%), Firefighting & Prevention (200 | 8.6%), Food Preparation & Serving (151 | 6.5%), Cleaning & Maintenance (84 | 3.6%), and Healthcare Support (79 | 3.4%).
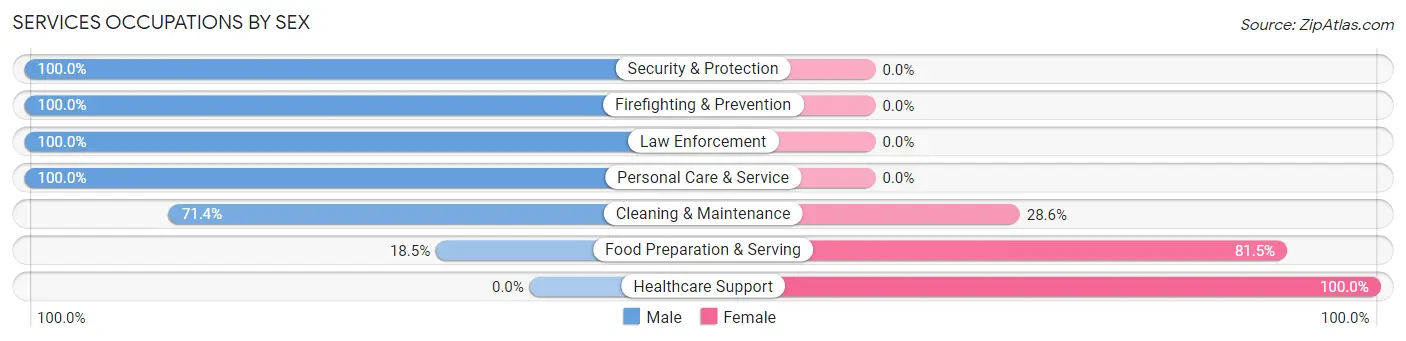
Services Occupations by Sex
Within the Services occupations in Country Lake Estates, the most male-oriented occupations are Security & Protection (100.0%), Firefighting & Prevention (100.0%), and Law Enforcement (100.0%), while the most female-oriented occupations are Healthcare Support (100.0%), Food Preparation & Serving (81.5%), and Cleaning & Maintenance (28.6%).
| Occupation | Male | Female |
| Healthcare Support | 0 (0.0%) | 79 (100.0%) |
| Security & Protection | 222 (100.0%) | 0 (0.0%) |
| Firefighting & Prevention | 200 (100.0%) | 0 (0.0%) |
| Law Enforcement | 22 (100.0%) | 0 (0.0%) |
| Food Preparation & Serving | 28 (18.5%) | 123 (81.5%) |
| Cleaning & Maintenance | 60 (71.4%) | 24 (28.6%) |
| Personal Care & Service | 25 (100.0%) | 0 (0.0%) |
| Total (Category) | 335 (59.7%) | 226 (40.3%) |
| Total (Overall) | 859 (37.0%) | 1,465 (63.0%) |
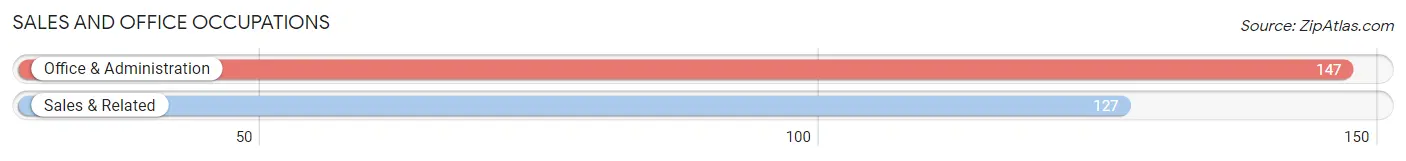
Sales and Office Occupations
The most common Sales and Office occupations in Country Lake Estates are Office & Administration (147 | 6.3%), and Sales & Related (127 | 5.5%).
Sales and Office Occupations by Sex
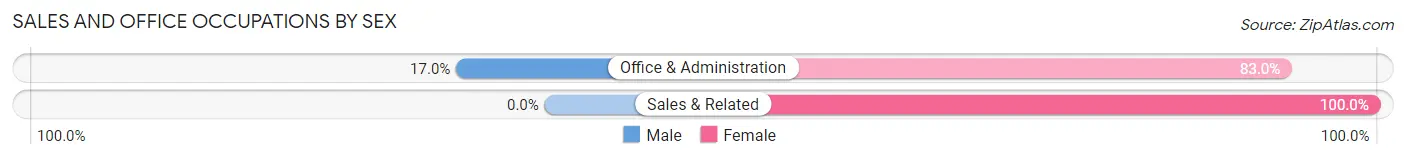
| Occupation | Male | Female |
| Sales & Related | 0 (0.0%) | 127 (100.0%) |
| Office & Administration | 25 (17.0%) | 122 (83.0%) |
| Total (Category) | 25 (9.1%) | 249 (90.9%) |
| Total (Overall) | 859 (37.0%) | 1,465 (63.0%) |
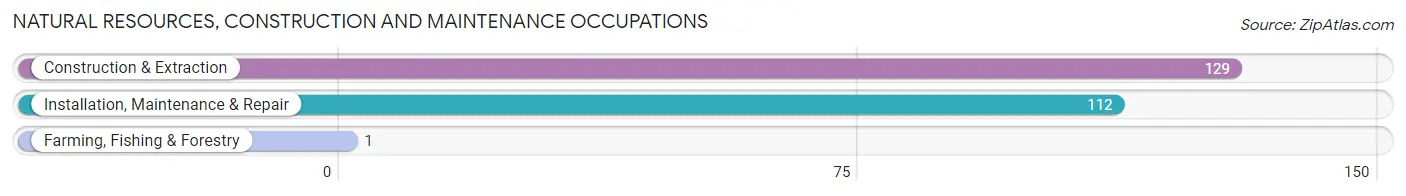
Natural Resources, Construction and Maintenance Occupations
The most common Natural Resources, Construction and Maintenance occupations in Country Lake Estates are Construction & Extraction (129 | 5.6%), Installation, Maintenance & Repair (112 | 4.8%), and Farming, Fishing & Forestry (1 | 0.0%).
Natural Resources, Construction and Maintenance Occupations by Sex
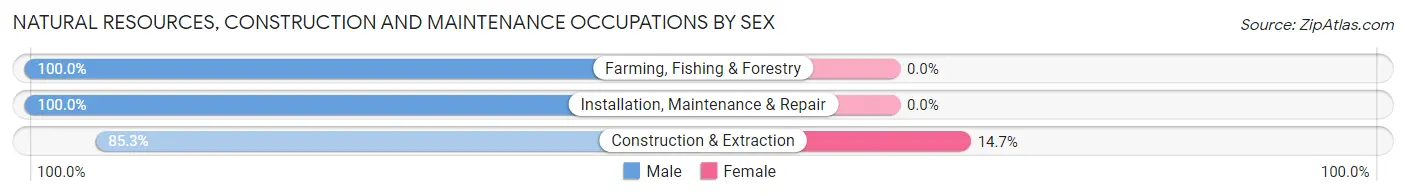
| Occupation | Male | Female |
| Farming, Fishing & Forestry | 1 (100.0%) | 0 (0.0%) |
| Construction & Extraction | 110 (85.3%) | 19 (14.7%) |
| Installation, Maintenance & Repair | 112 (100.0%) | 0 (0.0%) |
| Total (Category) | 223 (92.1%) | 19 (7.9%) |
| Total (Overall) | 859 (37.0%) | 1,465 (63.0%) |
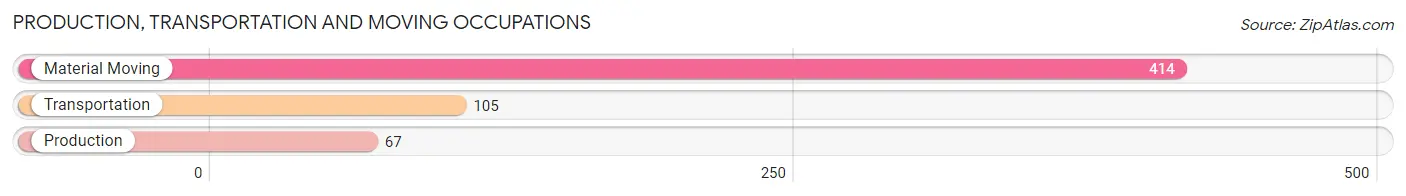
Production, Transportation and Moving Occupations
The most common Production, Transportation and Moving occupations in Country Lake Estates are Material Moving (414 | 17.8%), Transportation (105 | 4.5%), and Production (67 | 2.9%).
Production, Transportation and Moving Occupations by Sex
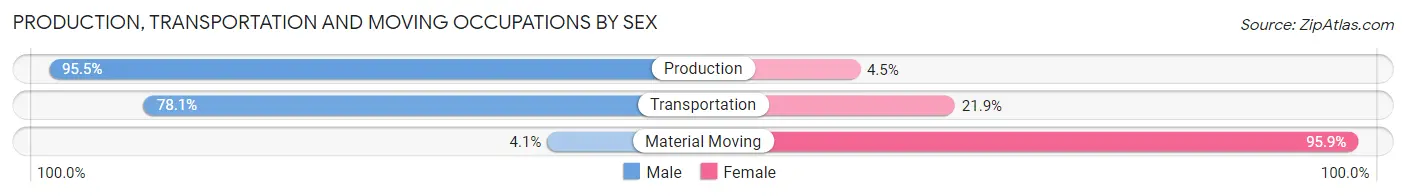
| Occupation | Male | Female |
| Production | 64 (95.5%) | 3 (4.5%) |
| Transportation | 82 (78.1%) | 23 (21.9%) |
| Material Moving | 17 (4.1%) | 397 (95.9%) |
| Total (Category) | 163 (27.8%) | 423 (72.2%) |
| Total (Overall) | 859 (37.0%) | 1,465 (63.0%) |
Employment Industries by Sex in Country Lake Estates
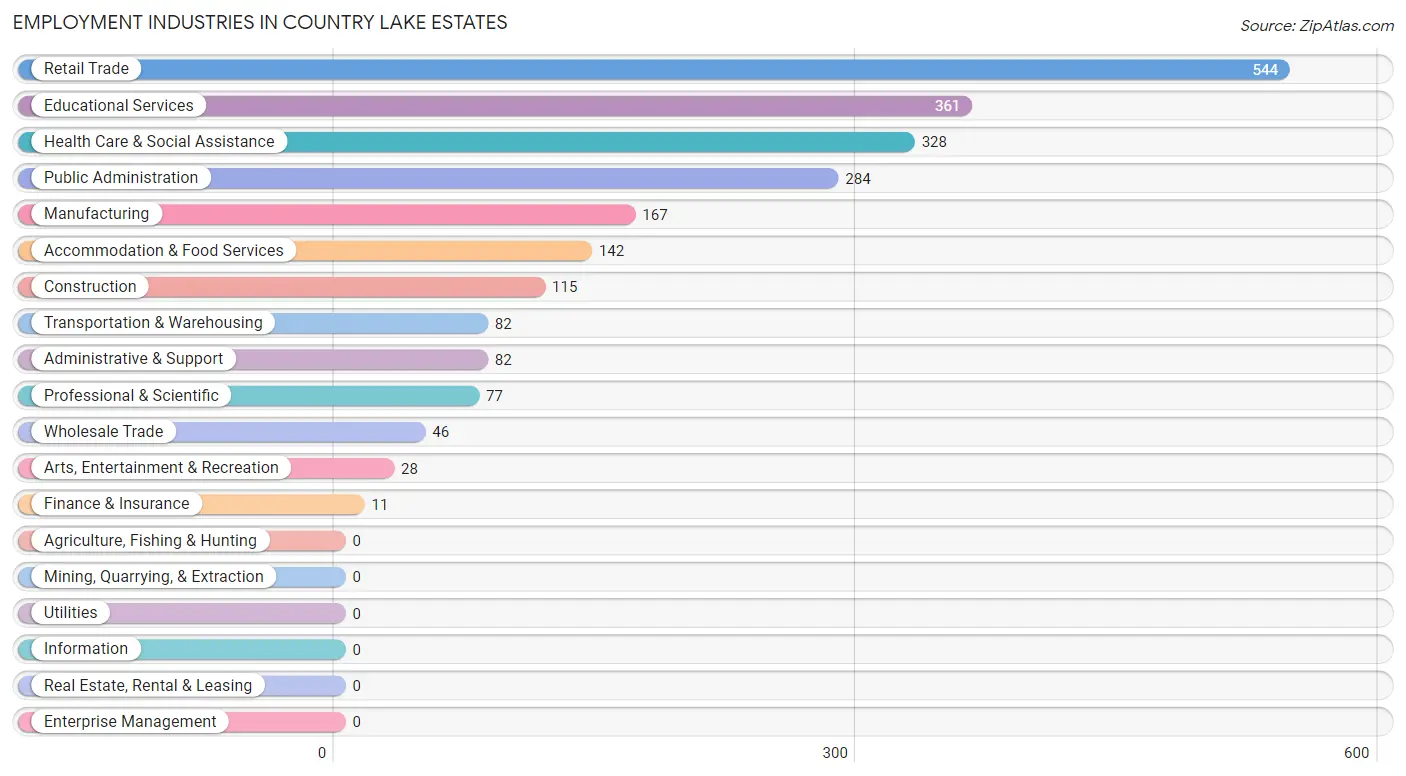
Employment Industries in Country Lake Estates
The major employment industries in Country Lake Estates include Retail Trade (544 | 23.4%), Educational Services (361 | 15.5%), Health Care & Social Assistance (328 | 14.1%), Public Administration (284 | 12.2%), and Manufacturing (167 | 7.2%).
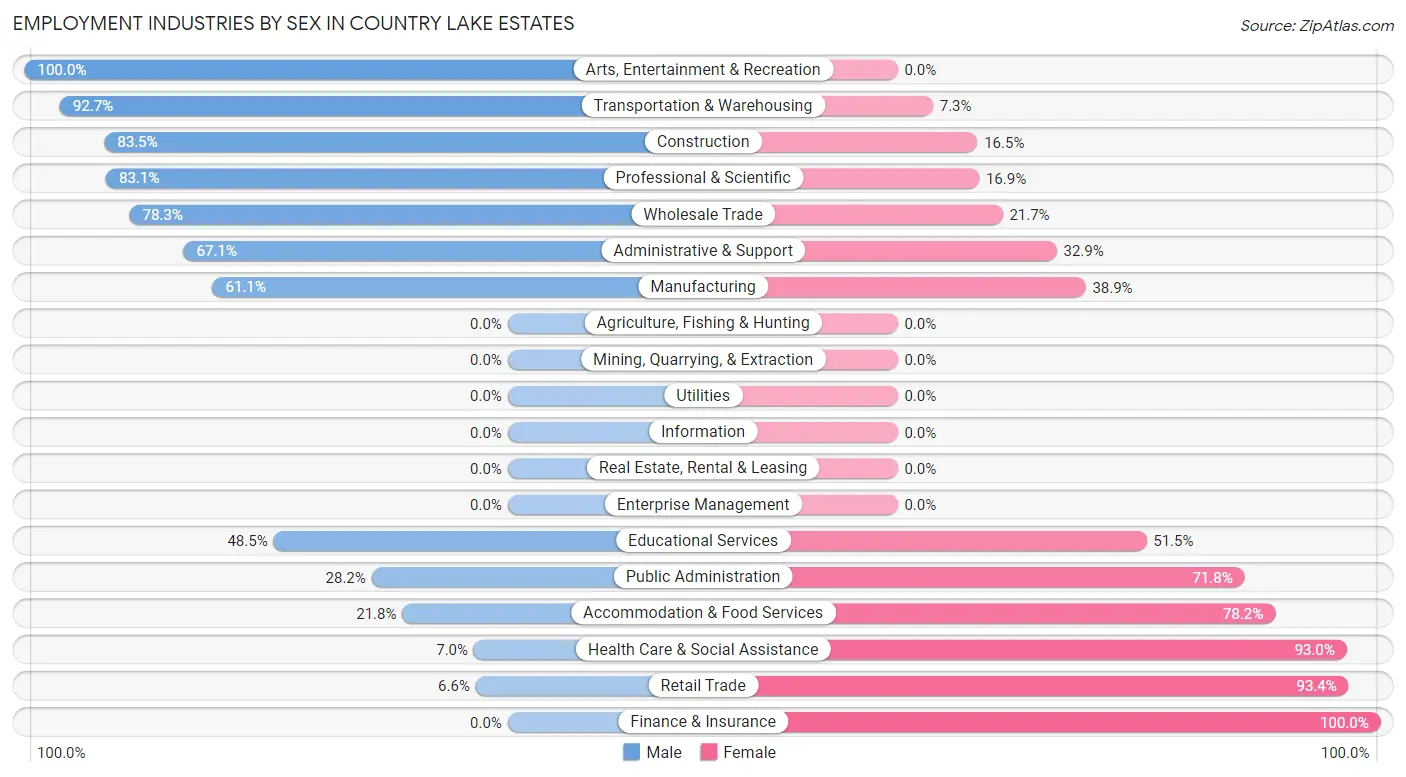
Employment Industries by Sex in Country Lake Estates
The Country Lake Estates industries that see more men than women are Arts, Entertainment & Recreation (100.0%), Transportation & Warehousing (92.7%), and Construction (83.5%), whereas the industries that tend to have a higher number of women are Finance & Insurance (100.0%), Retail Trade (93.4%), and Health Care & Social Assistance (93.0%).
| Industry | Male | Female |
| Agriculture, Fishing & Hunting | 0 (0.0%) | 0 (0.0%) |
| Mining, Quarrying, & Extraction | 0 (0.0%) | 0 (0.0%) |
| Construction | 96 (83.5%) | 19 (16.5%) |
| Manufacturing | 102 (61.1%) | 65 (38.9%) |
| Wholesale Trade | 36 (78.3%) | 10 (21.7%) |
| Retail Trade | 36 (6.6%) | 508 (93.4%) |
| Transportation & Warehousing | 76 (92.7%) | 6 (7.3%) |
| Utilities | 0 (0.0%) | 0 (0.0%) |
| Information | 0 (0.0%) | 0 (0.0%) |
| Finance & Insurance | 0 (0.0%) | 11 (100.0%) |
| Real Estate, Rental & Leasing | 0 (0.0%) | 0 (0.0%) |
| Professional & Scientific | 64 (83.1%) | 13 (16.9%) |
| Enterprise Management | 0 (0.0%) | 0 (0.0%) |
| Administrative & Support | 55 (67.1%) | 27 (32.9%) |
| Educational Services | 175 (48.5%) | 186 (51.5%) |
| Health Care & Social Assistance | 23 (7.0%) | 305 (93.0%) |
| Arts, Entertainment & Recreation | 28 (100.0%) | 0 (0.0%) |
| Accommodation & Food Services | 31 (21.8%) | 111 (78.2%) |
| Public Administration | 80 (28.2%) | 204 (71.8%) |
| Total | 859 (37.0%) | 1,465 (63.0%) |
Education in Country Lake Estates
School Enrollment in Country Lake Estates
The most common levels of schooling among the 1,506 students in Country Lake Estates are college / undergraduate (726 | 48.2%), high school (304 | 20.2%), and middle school (201 | 13.4%).
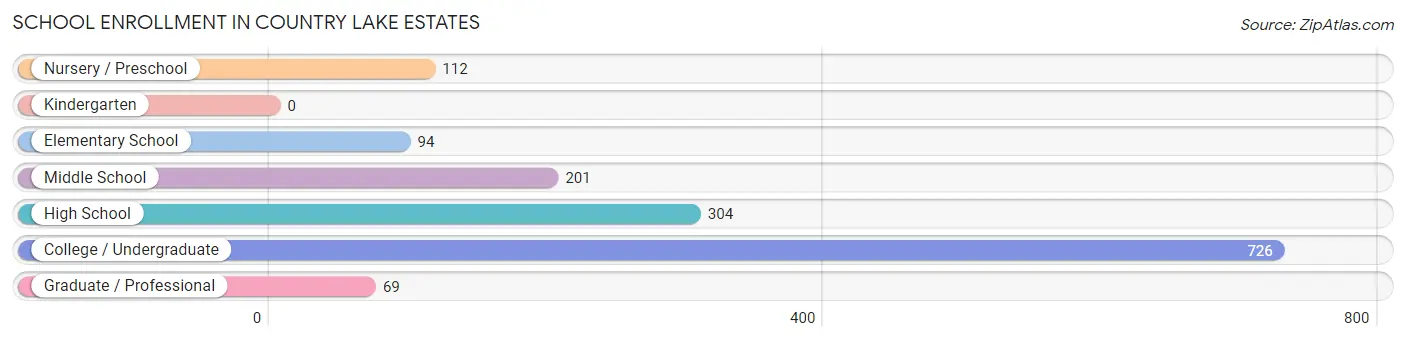
| School Level | # Students | % Students |
| Nursery / Preschool | 112 | 7.4% |
| Kindergarten | 0 | 0.0% |
| Elementary School | 94 | 6.2% |
| Middle School | 201 | 13.4% |
| High School | 304 | 20.2% |
| College / Undergraduate | 726 | 48.2% |
| Graduate / Professional | 69 | 4.6% |
| Total | 1,506 | 100.0% |
School Enrollment by Age by Funding Source in Country Lake Estates
Out of a total of 1,506 students who are enrolled in schools in Country Lake Estates, 206 (13.7%) attend a private institution, while the remaining 1,300 (86.3%) are enrolled in public schools. The age group of 25 to 34 year olds has the highest likelihood of being enrolled in private schools, with 17 (100.0% in the age bracket) enrolled. Conversely, the age group of 10 to 14 year olds has the lowest likelihood of being enrolled in a private school, with 201 (100.0% in the age bracket) attending a public institution.
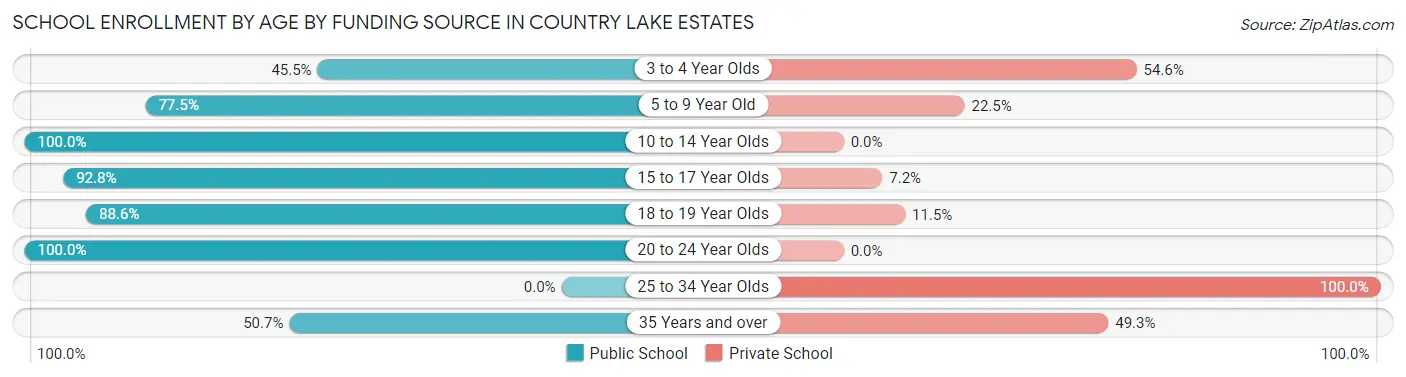
| Age Bracket | Public School | Private School |
| 3 to 4 Year Olds | 25 (45.5%) | 30 (54.5%) |
| 5 to 9 Year Old | 117 (77.5%) | 34 (22.5%) |
| 10 to 14 Year Olds | 201 (100.0%) | 0 (0.0%) |
| 15 to 17 Year Olds | 245 (92.8%) | 19 (7.2%) |
| 18 to 19 Year Olds | 294 (88.5%) | 38 (11.5%) |
| 20 to 24 Year Olds | 346 (100.0%) | 0 (0.0%) |
| 25 to 34 Year Olds | 0 (0.0%) | 17 (100.0%) |
| 35 Years and over | 71 (50.7%) | 69 (49.3%) |
| Total | 1,300 (86.3%) | 206 (13.7%) |
Educational Attainment by Field of Study in Country Lake Estates
Business (266 | 37.9%), psychology (184 | 26.2%), education (123 | 17.5%), social sciences (32 | 4.6%), and literature & languages (25 | 3.6%) are the most common fields of study among 702 individuals in Country Lake Estates who have obtained a bachelor's degree or higher.
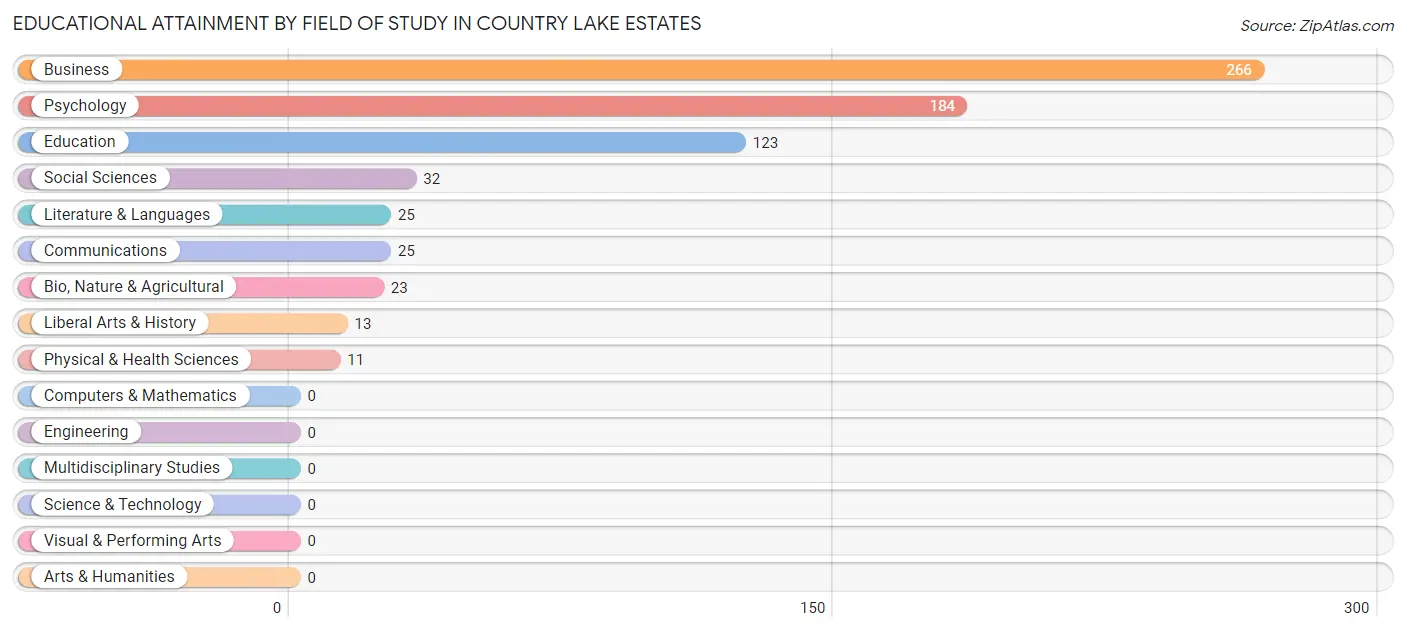
| Field of Study | # Graduates | % Graduates |
| Computers & Mathematics | 0 | 0.0% |
| Bio, Nature & Agricultural | 23 | 3.3% |
| Physical & Health Sciences | 11 | 1.6% |
| Psychology | 184 | 26.2% |
| Social Sciences | 32 | 4.6% |
| Engineering | 0 | 0.0% |
| Multidisciplinary Studies | 0 | 0.0% |
| Science & Technology | 0 | 0.0% |
| Business | 266 | 37.9% |
| Education | 123 | 17.5% |
| Literature & Languages | 25 | 3.6% |
| Liberal Arts & History | 13 | 1.8% |
| Visual & Performing Arts | 0 | 0.0% |
| Communications | 25 | 3.6% |
| Arts & Humanities | 0 | 0.0% |
| Total | 702 | 100.0% |
Transportation & Commute in Country Lake Estates
Vehicle Availability by Sex in Country Lake Estates
The most prevalent vehicle ownership categories in Country Lake Estates are males with 4 vehicles (349, accounting for 37.0%) and females with 4 vehicles (738, making up 23.8%).
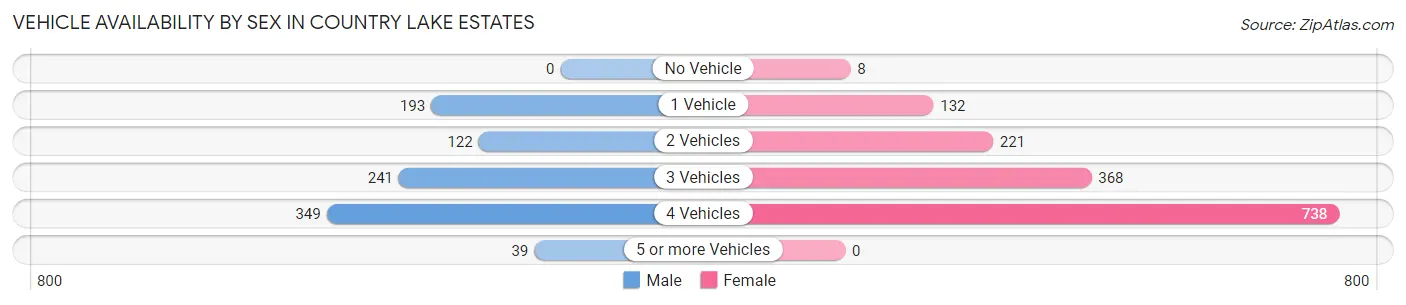
| Vehicles Available | Male | Female |
| No Vehicle | 0 (0.0%) | 8 (0.5%) |
| 1 Vehicle | 193 (20.4%) | 132 (9.0%) |
| 2 Vehicles | 122 (12.9%) | 221 (15.1%) |
| 3 Vehicles | 241 (25.5%) | 368 (25.1%) |
| 4 Vehicles | 349 (37.0%) | 738 (50.3%) |
| 5 or more Vehicles | 39 (4.1%) | 0 (0.0%) |
| Total | 944 (100.0%) | 1,467 (100.0%) |
Commute Time in Country Lake Estates
The most frequently occuring commute durations in Country Lake Estates are 20 to 24 minutes (643 commuters, 27.5%), 15 to 19 minutes (494 commuters, 21.1%), and 30 to 34 minutes (266 commuters, 11.4%).
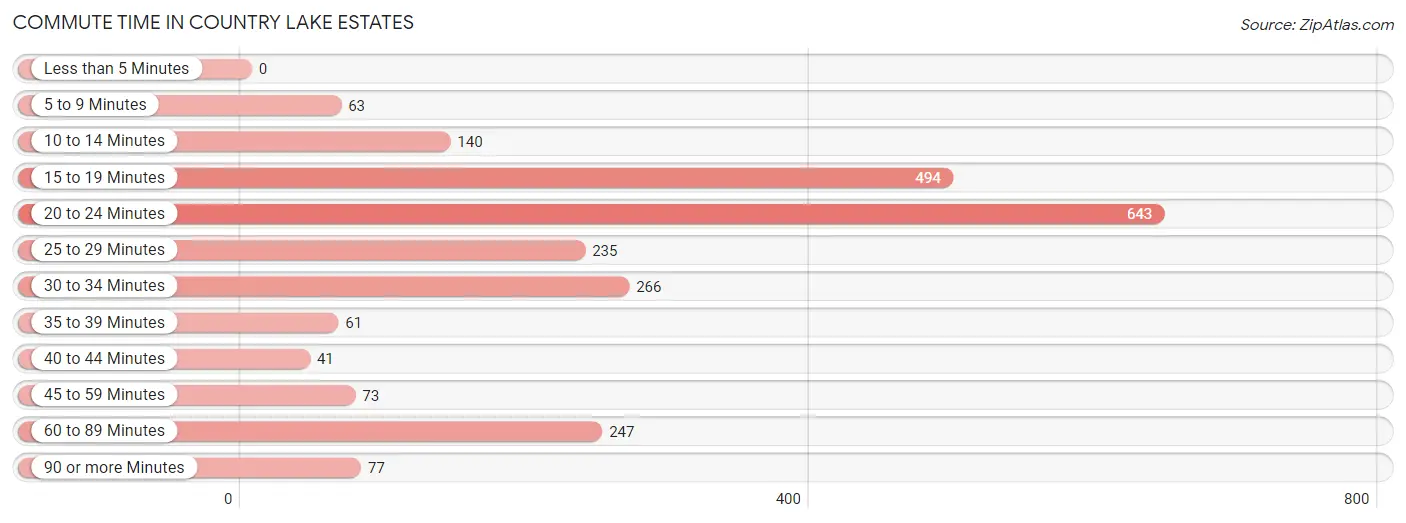
| Commute Time | # Commuters | % Commuters |
| Less than 5 Minutes | 0 | 0.0% |
| 5 to 9 Minutes | 63 | 2.7% |
| 10 to 14 Minutes | 140 | 6.0% |
| 15 to 19 Minutes | 494 | 21.1% |
| 20 to 24 Minutes | 643 | 27.5% |
| 25 to 29 Minutes | 235 | 10.0% |
| 30 to 34 Minutes | 266 | 11.4% |
| 35 to 39 Minutes | 61 | 2.6% |
| 40 to 44 Minutes | 41 | 1.8% |
| 45 to 59 Minutes | 73 | 3.1% |
| 60 to 89 Minutes | 247 | 10.6% |
| 90 or more Minutes | 77 | 3.3% |
Commute Time by Sex in Country Lake Estates
The most common commute times in Country Lake Estates are 20 to 24 minutes (345 commuters, 38.5%) for males and 15 to 19 minutes (398 commuters, 27.6%) for females.
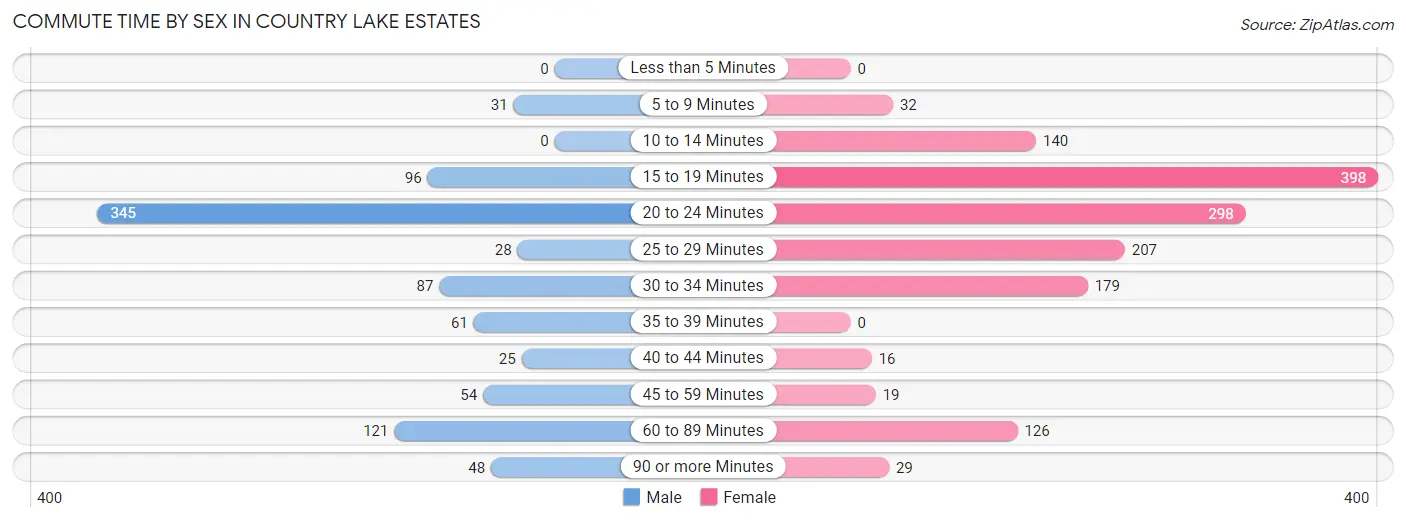
| Commute Time | Male | Female |
| Less than 5 Minutes | 0 (0.0%) | 0 (0.0%) |
| 5 to 9 Minutes | 31 (3.5%) | 32 (2.2%) |
| 10 to 14 Minutes | 0 (0.0%) | 140 (9.7%) |
| 15 to 19 Minutes | 96 (10.7%) | 398 (27.6%) |
| 20 to 24 Minutes | 345 (38.5%) | 298 (20.6%) |
| 25 to 29 Minutes | 28 (3.1%) | 207 (14.3%) |
| 30 to 34 Minutes | 87 (9.7%) | 179 (12.4%) |
| 35 to 39 Minutes | 61 (6.8%) | 0 (0.0%) |
| 40 to 44 Minutes | 25 (2.8%) | 16 (1.1%) |
| 45 to 59 Minutes | 54 (6.0%) | 19 (1.3%) |
| 60 to 89 Minutes | 121 (13.5%) | 126 (8.7%) |
| 90 or more Minutes | 48 (5.4%) | 29 (2.0%) |
Time of Departure to Work by Sex in Country Lake Estates
The most frequent times of departure to work in Country Lake Estates are 6:30 AM to 6:59 AM (324, 36.2%) for males and 6:30 AM to 6:59 AM (333, 23.1%) for females.
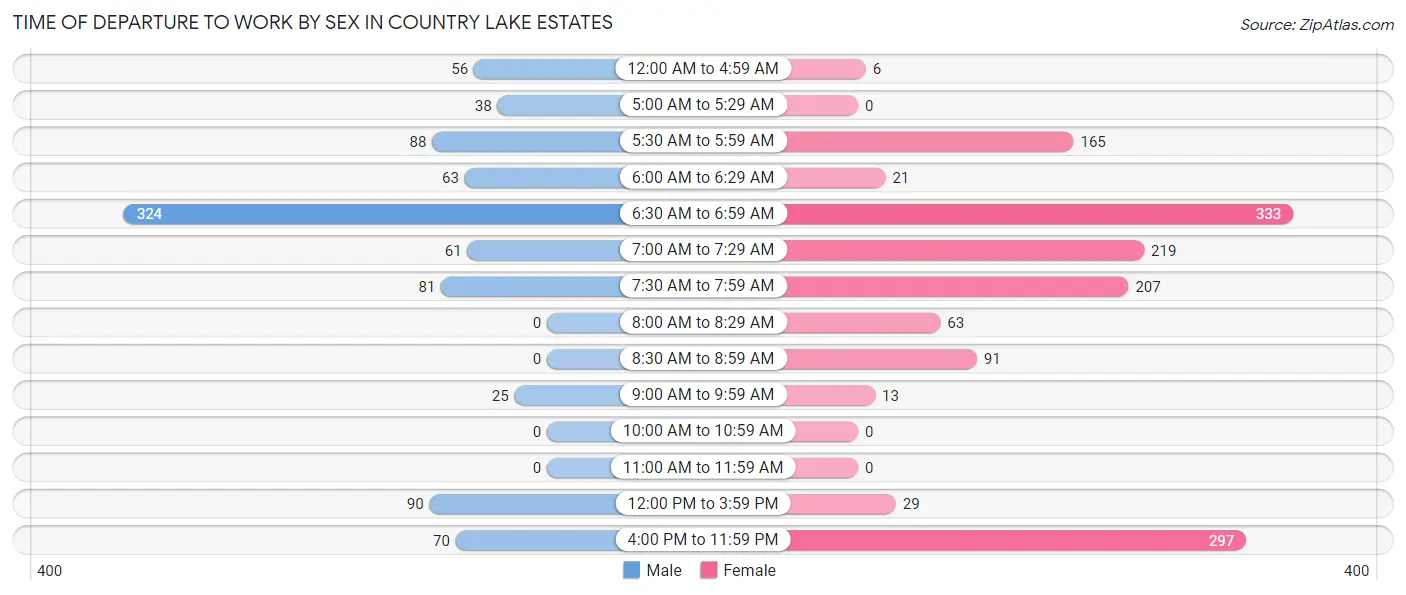
| Time of Departure | Male | Female |
| 12:00 AM to 4:59 AM | 56 (6.2%) | 6 (0.4%) |
| 5:00 AM to 5:29 AM | 38 (4.2%) | 0 (0.0%) |
| 5:30 AM to 5:59 AM | 88 (9.8%) | 165 (11.4%) |
| 6:00 AM to 6:29 AM | 63 (7.0%) | 21 (1.5%) |
| 6:30 AM to 6:59 AM | 324 (36.2%) | 333 (23.1%) |
| 7:00 AM to 7:29 AM | 61 (6.8%) | 219 (15.2%) |
| 7:30 AM to 7:59 AM | 81 (9.0%) | 207 (14.3%) |
| 8:00 AM to 8:29 AM | 0 (0.0%) | 63 (4.4%) |
| 8:30 AM to 8:59 AM | 0 (0.0%) | 91 (6.3%) |
| 9:00 AM to 9:59 AM | 25 (2.8%) | 13 (0.9%) |
| 10:00 AM to 10:59 AM | 0 (0.0%) | 0 (0.0%) |
| 11:00 AM to 11:59 AM | 0 (0.0%) | 0 (0.0%) |
| 12:00 PM to 3:59 PM | 90 (10.0%) | 29 (2.0%) |
| 4:00 PM to 11:59 PM | 70 (7.8%) | 297 (20.6%) |
| Total | 896 (100.0%) | 1,444 (100.0%) |
Housing Occupancy in Country Lake Estates
Occupancy by Ownership in Country Lake Estates
Of the total 1,294 dwellings in Country Lake Estates, owner-occupied units account for 1,258 (97.2%), while renter-occupied units make up 36 (2.8%).
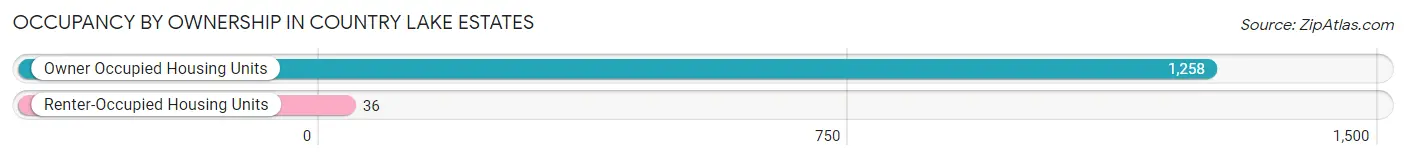
| Occupancy | # Housing Units | % Housing Units |
| Owner Occupied Housing Units | 1,258 | 97.2% |
| Renter-Occupied Housing Units | 36 | 2.8% |
| Total Occupied Housing Units | 1,294 | 100.0% |
Occupancy by Household Size in Country Lake Estates
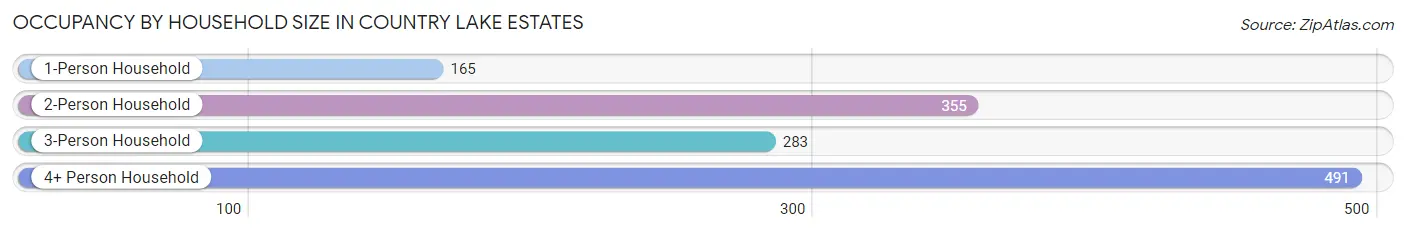
| Household Size | # Housing Units | % Housing Units |
| 1-Person Household | 165 | 12.8% |
| 2-Person Household | 355 | 27.4% |
| 3-Person Household | 283 | 21.9% |
| 4+ Person Household | 491 | 37.9% |
| Total Housing Units | 1,294 | 100.0% |
Occupancy by Ownership by Household Size in Country Lake Estates
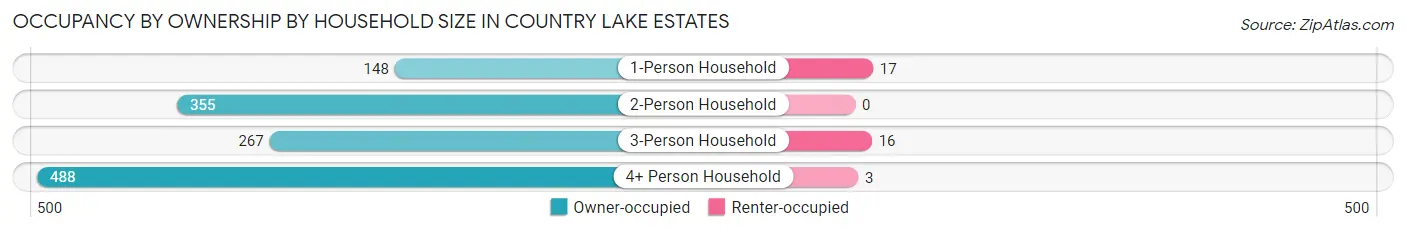
| Household Size | Owner-occupied | Renter-occupied |
| 1-Person Household | 148 (89.7%) | 17 (10.3%) |
| 2-Person Household | 355 (100.0%) | 0 (0.0%) |
| 3-Person Household | 267 (94.4%) | 16 (5.7%) |
| 4+ Person Household | 488 (99.4%) | 3 (0.6%) |
| Total Housing Units | 1,258 (97.2%) | 36 (2.8%) |
Occupancy by Educational Attainment in Country Lake Estates
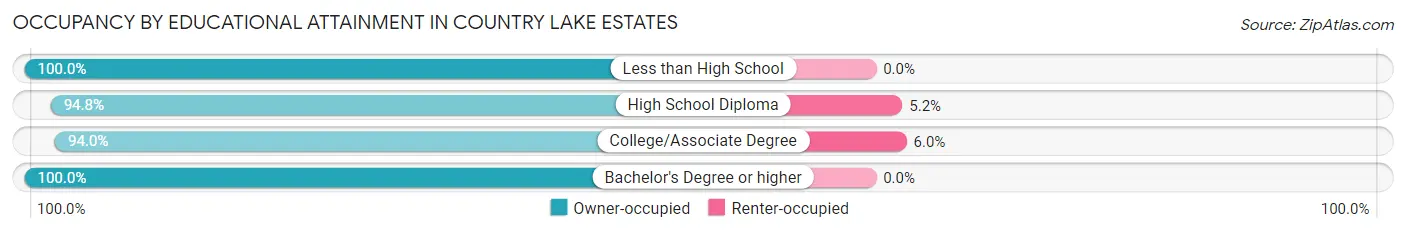
| Household Size | Owner-occupied | Renter-occupied |
| Less than High School | 206 (100.0%) | 0 (0.0%) |
| High School Diploma | 292 (94.8%) | 16 (5.2%) |
| College/Associate Degree | 311 (94.0%) | 20 (6.0%) |
| Bachelor's Degree or higher | 449 (100.0%) | 0 (0.0%) |
Occupancy by Age of Householder in Country Lake Estates
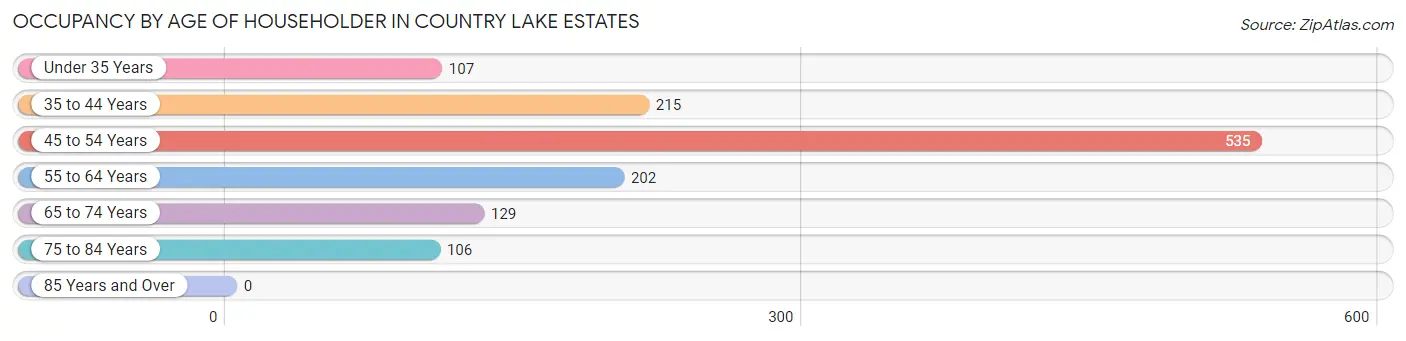
| Age Bracket | # Households | % Households |
| Under 35 Years | 107 | 8.3% |
| 35 to 44 Years | 215 | 16.6% |
| 45 to 54 Years | 535 | 41.3% |
| 55 to 64 Years | 202 | 15.6% |
| 65 to 74 Years | 129 | 10.0% |
| 75 to 84 Years | 106 | 8.2% |
| 85 Years and Over | 0 | 0.0% |
| Total | 1,294 | 100.0% |
Housing Finances in Country Lake Estates
Median Income by Occupancy in Country Lake Estates
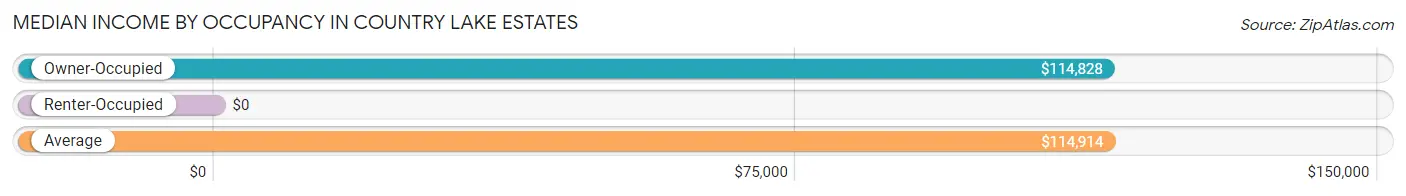
| Occupancy Type | # Households | Median Income |
| Owner-Occupied | 1,258 (97.2%) | $114,828 |
| Renter-Occupied | 36 (2.8%) | $0 |
| Average | 1,294 (100.0%) | $114,914 |
Occupancy by Householder Income Bracket in Country Lake Estates
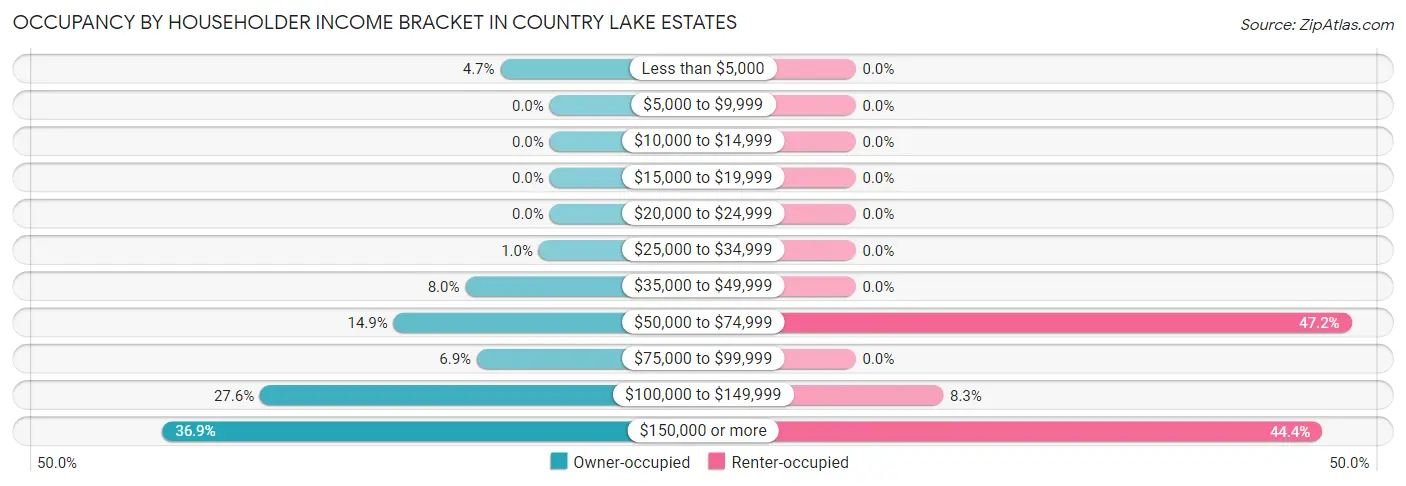
| Income Bracket | Owner-occupied | Renter-occupied |
| Less than $5,000 | 59 (4.7%) | 0 (0.0%) |
| $5,000 to $9,999 | 0 (0.0%) | 0 (0.0%) |
| $10,000 to $14,999 | 0 (0.0%) | 0 (0.0%) |
| $15,000 to $19,999 | 0 (0.0%) | 0 (0.0%) |
| $20,000 to $24,999 | 0 (0.0%) | 0 (0.0%) |
| $25,000 to $34,999 | 13 (1.0%) | 0 (0.0%) |
| $35,000 to $49,999 | 101 (8.0%) | 0 (0.0%) |
| $50,000 to $74,999 | 187 (14.9%) | 17 (47.2%) |
| $75,000 to $99,999 | 87 (6.9%) | 0 (0.0%) |
| $100,000 to $149,999 | 347 (27.6%) | 3 (8.3%) |
| $150,000 or more | 464 (36.9%) | 16 (44.4%) |
| Total | 1,258 (100.0%) | 36 (100.0%) |
Monthly Housing Cost Tiers in Country Lake Estates
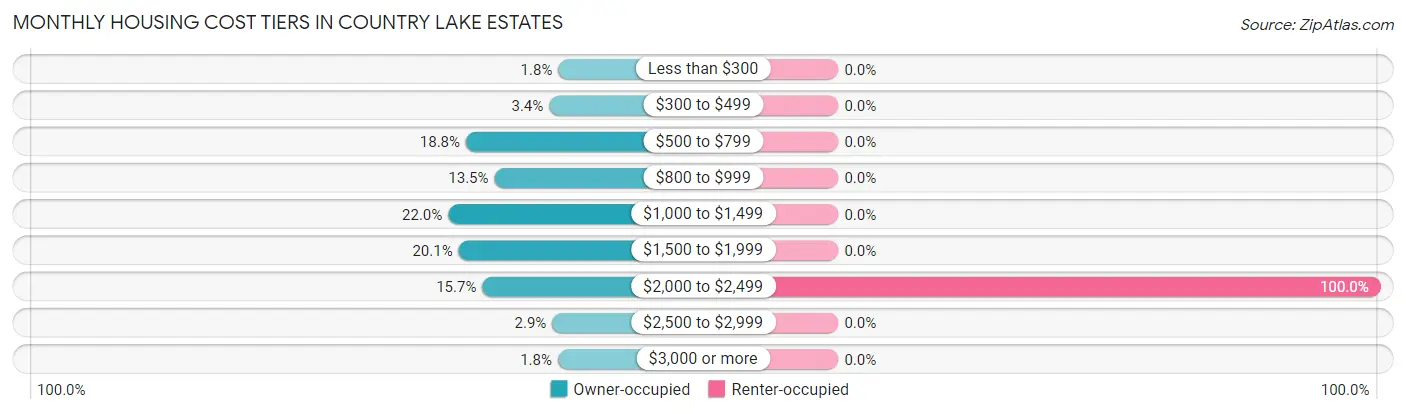
| Monthly Cost | Owner-occupied | Renter-occupied |
| Less than $300 | 22 (1.8%) | 0 (0.0%) |
| $300 to $499 | 43 (3.4%) | 0 (0.0%) |
| $500 to $799 | 236 (18.8%) | 0 (0.0%) |
| $800 to $999 | 170 (13.5%) | 0 (0.0%) |
| $1,000 to $1,499 | 277 (22.0%) | 0 (0.0%) |
| $1,500 to $1,999 | 253 (20.1%) | 0 (0.0%) |
| $2,000 to $2,499 | 198 (15.7%) | 36 (100.0%) |
| $2,500 to $2,999 | 36 (2.9%) | 0 (0.0%) |
| $3,000 or more | 23 (1.8%) | 0 (0.0%) |
| Total | 1,258 (100.0%) | 36 (100.0%) |
Physical Housing Characteristics in Country Lake Estates
Housing Structures in Country Lake Estates
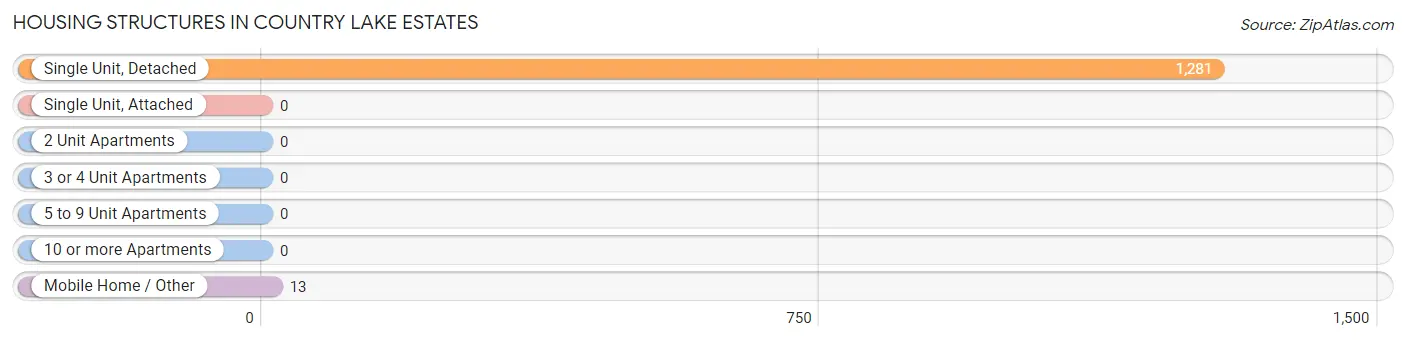
| Structure Type | # Housing Units | % Housing Units |
| Single Unit, Detached | 1,281 | 99.0% |
| Single Unit, Attached | 0 | 0.0% |
| 2 Unit Apartments | 0 | 0.0% |
| 3 or 4 Unit Apartments | 0 | 0.0% |
| 5 to 9 Unit Apartments | 0 | 0.0% |
| 10 or more Apartments | 0 | 0.0% |
| Mobile Home / Other | 13 | 1.0% |
| Total | 1,294 | 100.0% |
Housing Structures by Occupancy in Country Lake Estates
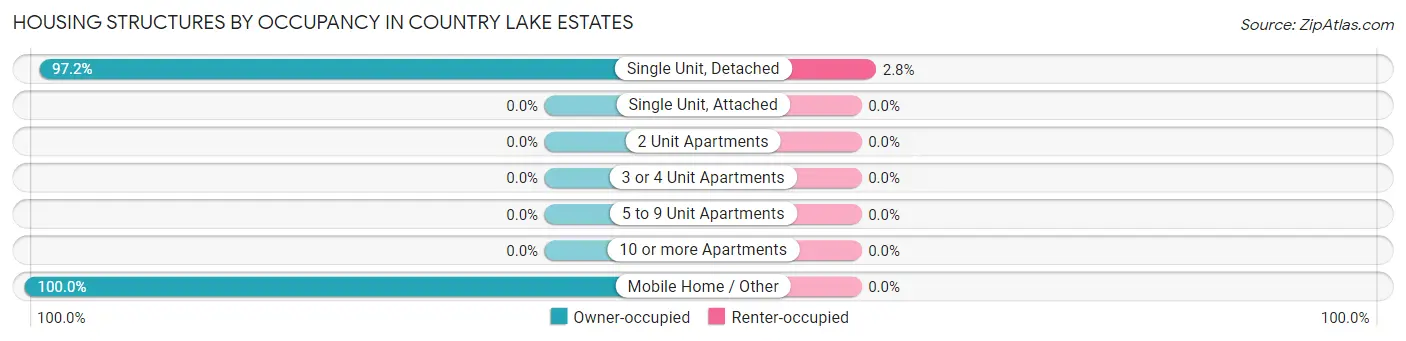
| Structure Type | Owner-occupied | Renter-occupied |
| Single Unit, Detached | 1,245 (97.2%) | 36 (2.8%) |
| Single Unit, Attached | 0 (0.0%) | 0 (0.0%) |
| 2 Unit Apartments | 0 (0.0%) | 0 (0.0%) |
| 3 or 4 Unit Apartments | 0 (0.0%) | 0 (0.0%) |
| 5 to 9 Unit Apartments | 0 (0.0%) | 0 (0.0%) |
| 10 or more Apartments | 0 (0.0%) | 0 (0.0%) |
| Mobile Home / Other | 13 (100.0%) | 0 (0.0%) |
| Total | 1,258 (97.2%) | 36 (2.8%) |
Housing Structures by Number of Rooms in Country Lake Estates
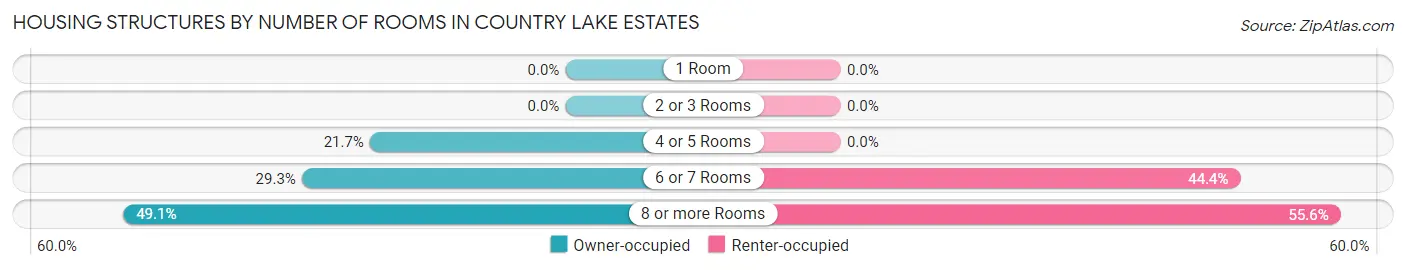
| Number of Rooms | Owner-occupied | Renter-occupied |
| 1 Room | 0 (0.0%) | 0 (0.0%) |
| 2 or 3 Rooms | 0 (0.0%) | 0 (0.0%) |
| 4 or 5 Rooms | 273 (21.7%) | 0 (0.0%) |
| 6 or 7 Rooms | 368 (29.2%) | 16 (44.4%) |
| 8 or more Rooms | 617 (49.0%) | 20 (55.6%) |
| Total | 1,258 (100.0%) | 36 (100.0%) |
Housing Structure by Heating Type in Country Lake Estates
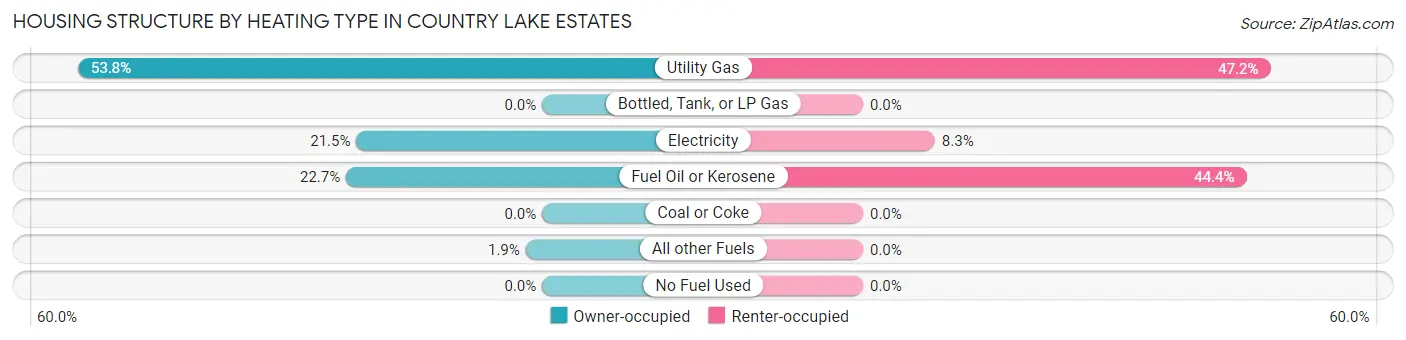
| Heating Type | Owner-occupied | Renter-occupied |
| Utility Gas | 677 (53.8%) | 17 (47.2%) |
| Bottled, Tank, or LP Gas | 0 (0.0%) | 0 (0.0%) |
| Electricity | 271 (21.5%) | 3 (8.3%) |
| Fuel Oil or Kerosene | 286 (22.7%) | 16 (44.4%) |
| Coal or Coke | 0 (0.0%) | 0 (0.0%) |
| All other Fuels | 24 (1.9%) | 0 (0.0%) |
| No Fuel Used | 0 (0.0%) | 0 (0.0%) |
| Total | 1,258 (100.0%) | 36 (100.0%) |
Household Vehicle Usage in Country Lake Estates
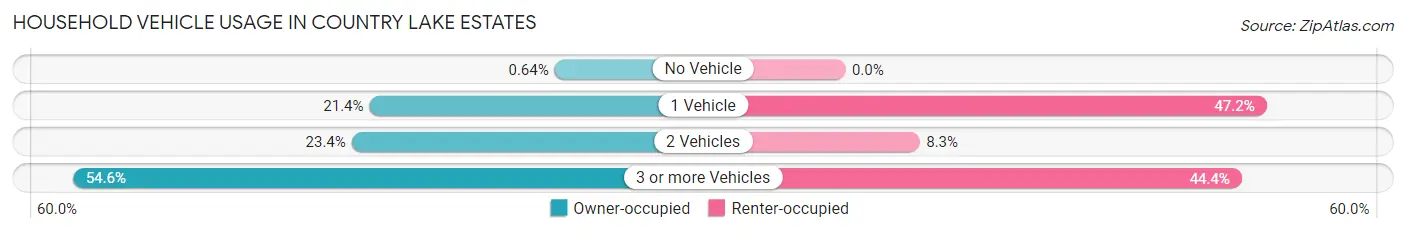
| Vehicles per Household | Owner-occupied | Renter-occupied |
| No Vehicle | 8 (0.6%) | 0 (0.0%) |
| 1 Vehicle | 269 (21.4%) | 17 (47.2%) |
| 2 Vehicles | 294 (23.4%) | 3 (8.3%) |
| 3 or more Vehicles | 687 (54.6%) | 16 (44.4%) |
| Total | 1,258 (100.0%) | 36 (100.0%) |
Real Estate & Mortgages in Country Lake Estates
Real Estate and Mortgage Overview in Country Lake Estates
| Characteristic | Without Mortgage | With Mortgage |
| Housing Units | 535 | 723 |
| Median Property Value | $203,600 | $221,300 |
| Median Household Income | $108,125 | $321 |
| Monthly Housing Costs | $779 | $23 |
| Real Estate Taxes | $4,693 | $28 |
Property Value by Mortgage Status in Country Lake Estates
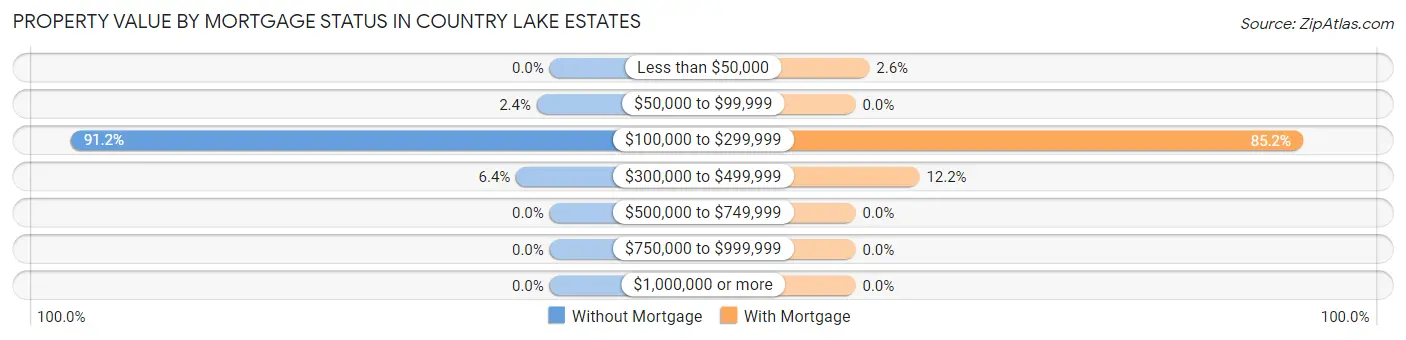
| Property Value | Without Mortgage | With Mortgage |
| Less than $50,000 | 0 (0.0%) | 19 (2.6%) |
| $50,000 to $99,999 | 13 (2.4%) | 0 (0.0%) |
| $100,000 to $299,999 | 488 (91.2%) | 616 (85.2%) |
| $300,000 to $499,999 | 34 (6.4%) | 88 (12.2%) |
| $500,000 to $749,999 | 0 (0.0%) | 0 (0.0%) |
| $750,000 to $999,999 | 0 (0.0%) | 0 (0.0%) |
| $1,000,000 or more | 0 (0.0%) | 0 (0.0%) |
| Total | 535 (100.0%) | 723 (100.0%) |
Household Income by Mortgage Status in Country Lake Estates
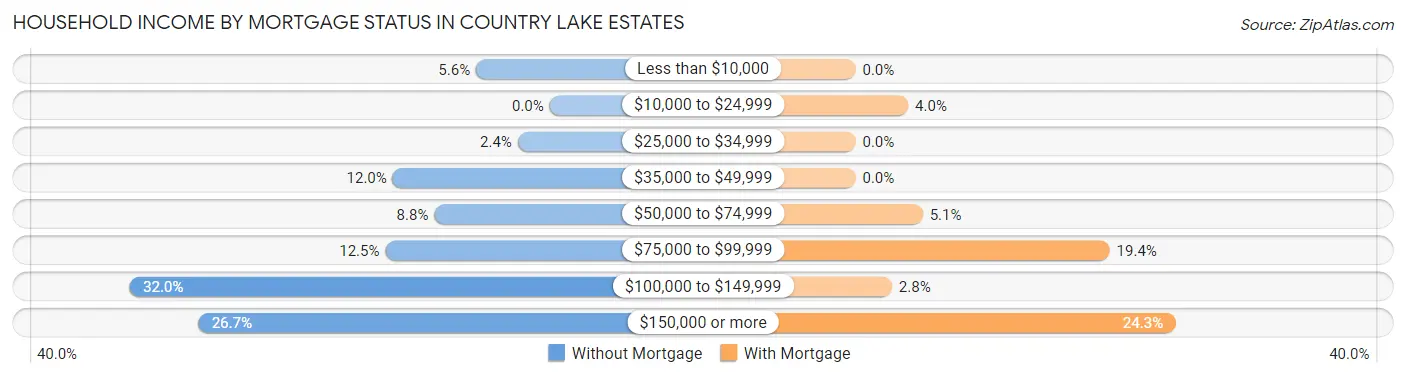
| Household Income | Without Mortgage | With Mortgage |
| Less than $10,000 | 30 (5.6%) | 0 (0.0%) |
| $10,000 to $24,999 | 0 (0.0%) | 29 (4.0%) |
| $25,000 to $34,999 | 13 (2.4%) | 0 (0.0%) |
| $35,000 to $49,999 | 64 (12.0%) | 0 (0.0%) |
| $50,000 to $74,999 | 47 (8.8%) | 37 (5.1%) |
| $75,000 to $99,999 | 67 (12.5%) | 140 (19.4%) |
| $100,000 to $149,999 | 171 (32.0%) | 20 (2.8%) |
| $150,000 or more | 143 (26.7%) | 176 (24.3%) |
| Total | 535 (100.0%) | 723 (100.0%) |
Property Value to Household Income Ratio in Country Lake Estates
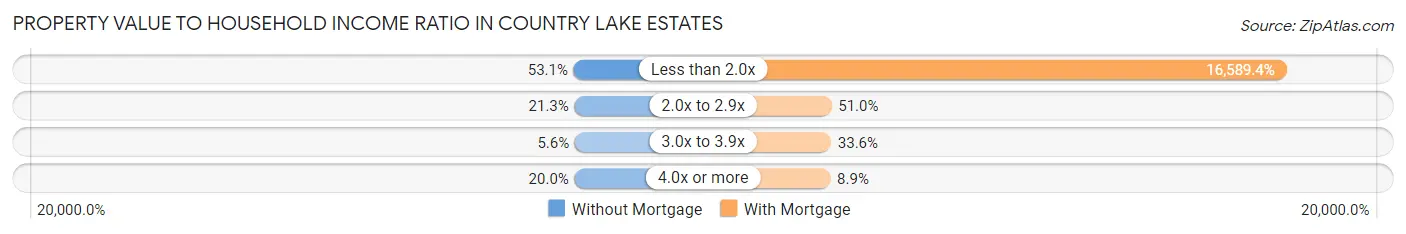
| Value-to-Income Ratio | Without Mortgage | With Mortgage |
| Less than 2.0x | 284 (53.1%) | 119,941 (16,589.3%) |
| 2.0x to 2.9x | 114 (21.3%) | 369 (51.0%) |
| 3.0x to 3.9x | 30 (5.6%) | 243 (33.6%) |
| 4.0x or more | 107 (20.0%) | 64 (8.8%) |
| Total | 535 (100.0%) | 723 (100.0%) |
Real Estate Taxes by Mortgage Status in Country Lake Estates
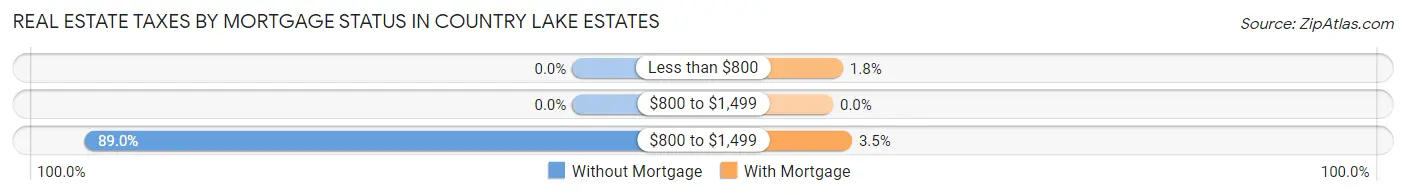
| Property Taxes | Without Mortgage | With Mortgage |
| Less than $800 | 0 (0.0%) | 13 (1.8%) |
| $800 to $1,499 | 0 (0.0%) | 0 (0.0%) |
| $800 to $1,499 | 476 (89.0%) | 25 (3.5%) |
| Total | 535 (100.0%) | 723 (100.0%) |
Health & Disability in Country Lake Estates
Health Insurance Coverage by Age in Country Lake Estates
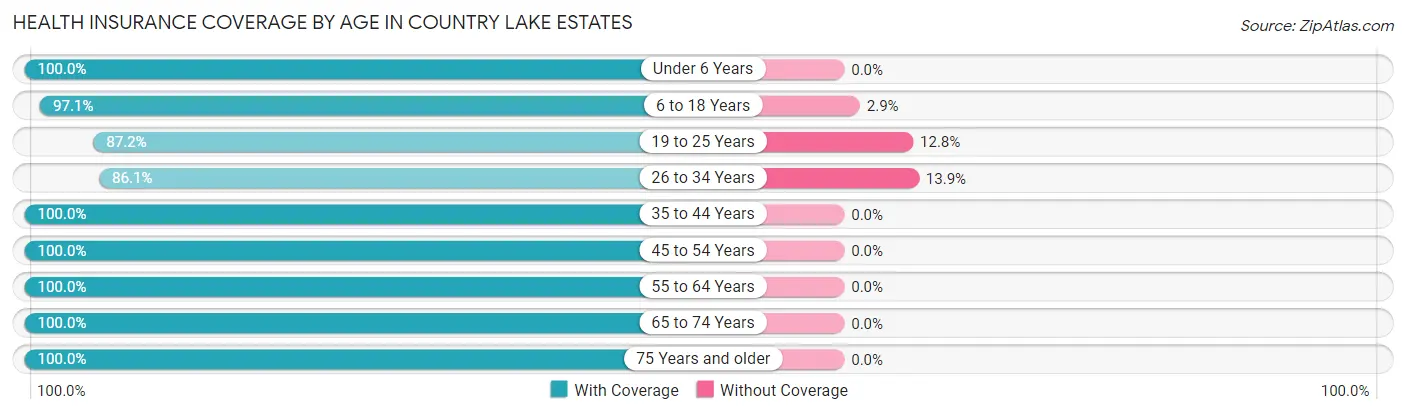
| Age Bracket | With Coverage | Without Coverage |
| Under 6 Years | 343 (100.0%) | 0 (0.0%) |
| 6 to 18 Years | 636 (97.1%) | 19 (2.9%) |
| 19 to 25 Years | 652 (87.2%) | 96 (12.8%) |
| 26 to 34 Years | 198 (86.1%) | 32 (13.9%) |
| 35 to 44 Years | 520 (100.0%) | 0 (0.0%) |
| 45 to 54 Years | 645 (100.0%) | 0 (0.0%) |
| 55 to 64 Years | 478 (100.0%) | 0 (0.0%) |
| 65 to 74 Years | 323 (100.0%) | 0 (0.0%) |
| 75 Years and older | 120 (100.0%) | 0 (0.0%) |
| Total | 3,915 (96.4%) | 147 (3.6%) |
Health Insurance Coverage by Citizenship Status in Country Lake Estates
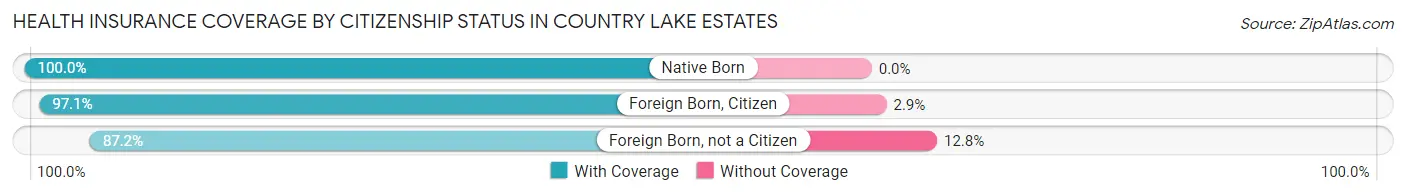
| Citizenship Status | With Coverage | Without Coverage |
| Native Born | 343 (100.0%) | 0 (0.0%) |
| Foreign Born, Citizen | 636 (97.1%) | 19 (2.9%) |
| Foreign Born, not a Citizen | 652 (87.2%) | 96 (12.8%) |
Health Insurance Coverage by Household Income in Country Lake Estates
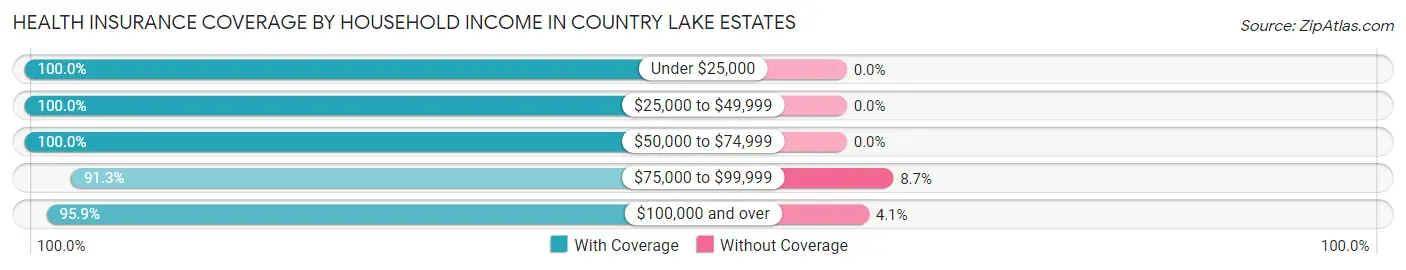
| Household Income | With Coverage | Without Coverage |
| Under $25,000 | 188 (100.0%) | 0 (0.0%) |
| $25,000 to $49,999 | 257 (100.0%) | 0 (0.0%) |
| $50,000 to $74,999 | 378 (100.0%) | 0 (0.0%) |
| $75,000 to $99,999 | 273 (91.3%) | 26 (8.7%) |
| $100,000 and over | 2,818 (95.9%) | 121 (4.1%) |
Public vs Private Health Insurance Coverage by Age in Country Lake Estates
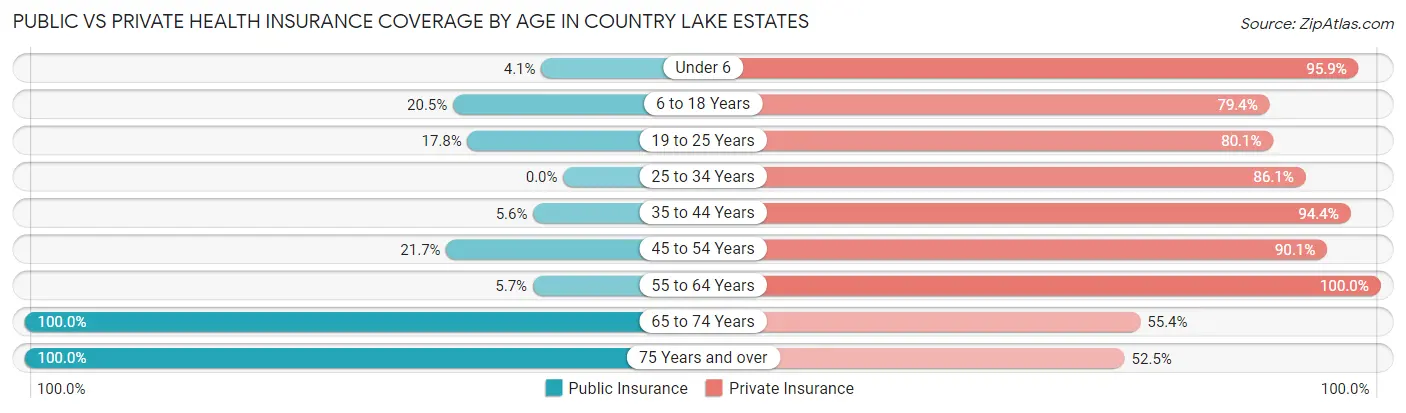
| Age Bracket | Public Insurance | Private Insurance |
| Under 6 | 14 (4.1%) | 329 (95.9%) |
| 6 to 18 Years | 134 (20.5%) | 520 (79.4%) |
| 19 to 25 Years | 133 (17.8%) | 599 (80.1%) |
| 25 to 34 Years | 0 (0.0%) | 198 (86.1%) |
| 35 to 44 Years | 29 (5.6%) | 491 (94.4%) |
| 45 to 54 Years | 140 (21.7%) | 581 (90.1%) |
| 55 to 64 Years | 27 (5.7%) | 478 (100.0%) |
| 65 to 74 Years | 323 (100.0%) | 179 (55.4%) |
| 75 Years and over | 120 (100.0%) | 63 (52.5%) |
| Total | 920 (22.7%) | 3,438 (84.6%) |
Disability Status by Sex by Age in Country Lake Estates
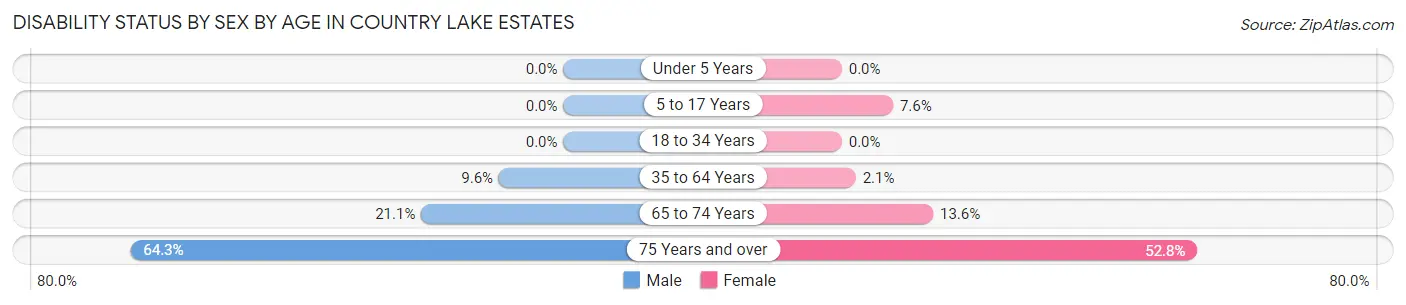
| Age Bracket | Male | Female |
| Under 5 Years | 0 (0.0%) | 0 (0.0%) |
| 5 to 17 Years | 0 (0.0%) | 33 (7.6%) |
| 18 to 34 Years | 0 (0.0%) | 0 (0.0%) |
| 35 to 64 Years | 74 (9.6%) | 18 (2.1%) |
| 65 to 74 Years | 23 (21.1%) | 29 (13.6%) |
| 75 Years and over | 54 (64.3%) | 19 (52.8%) |
Disability Class by Sex by Age in Country Lake Estates
Disability Class: Hearing Difficulty
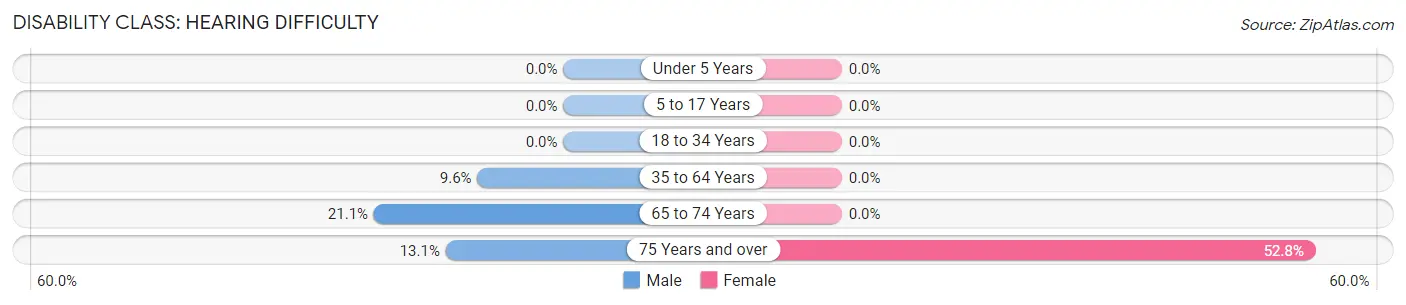
| Age Bracket | Male | Female |
| Under 5 Years | 0 (0.0%) | 0 (0.0%) |
| 5 to 17 Years | 0 (0.0%) | 0 (0.0%) |
| 18 to 34 Years | 0 (0.0%) | 0 (0.0%) |
| 35 to 64 Years | 74 (9.6%) | 0 (0.0%) |
| 65 to 74 Years | 23 (21.1%) | 0 (0.0%) |
| 75 Years and over | 11 (13.1%) | 19 (52.8%) |
Disability Class: Vision Difficulty
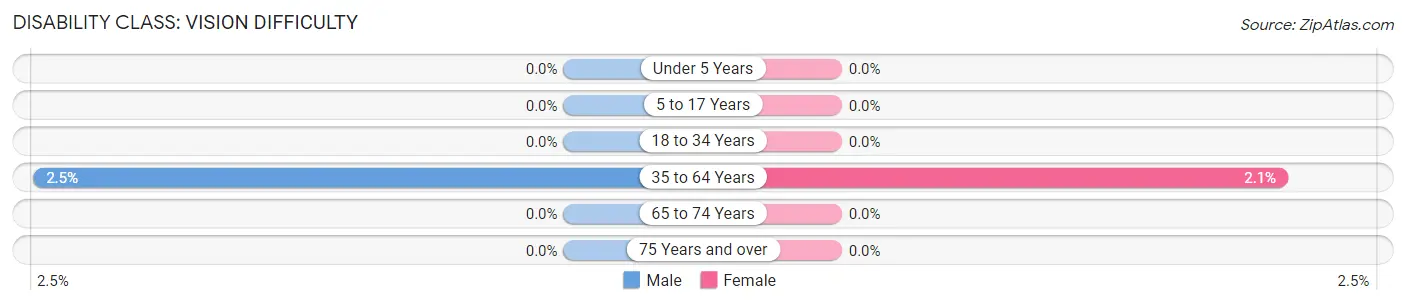
| Age Bracket | Male | Female |
| Under 5 Years | 0 (0.0%) | 0 (0.0%) |
| 5 to 17 Years | 0 (0.0%) | 0 (0.0%) |
| 18 to 34 Years | 0 (0.0%) | 0 (0.0%) |
| 35 to 64 Years | 19 (2.5%) | 18 (2.1%) |
| 65 to 74 Years | 0 (0.0%) | 0 (0.0%) |
| 75 Years and over | 0 (0.0%) | 0 (0.0%) |
Disability Class: Cognitive Difficulty
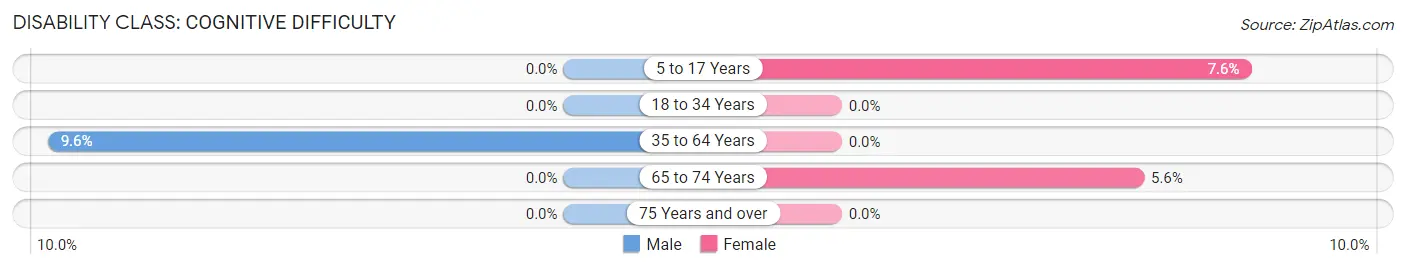
| Age Bracket | Male | Female |
| 5 to 17 Years | 0 (0.0%) | 33 (7.6%) |
| 18 to 34 Years | 0 (0.0%) | 0 (0.0%) |
| 35 to 64 Years | 74 (9.6%) | 0 (0.0%) |
| 65 to 74 Years | 0 (0.0%) | 12 (5.6%) |
| 75 Years and over | 0 (0.0%) | 0 (0.0%) |
Disability Class: Ambulatory Difficulty
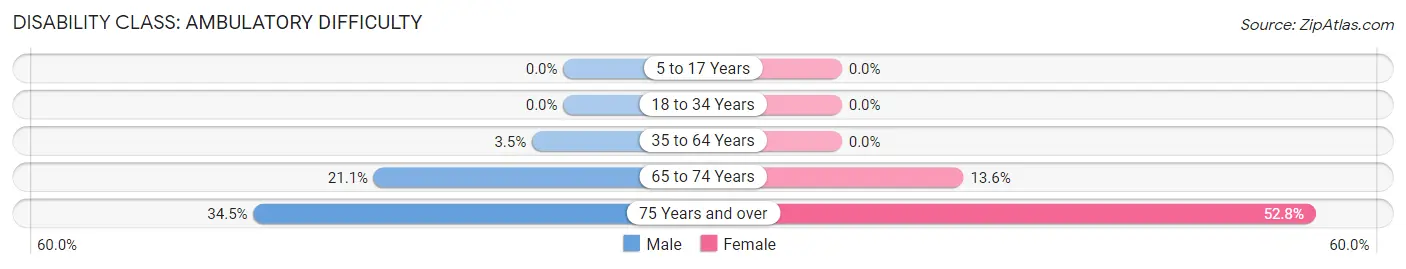
| Age Bracket | Male | Female |
| 5 to 17 Years | 0 (0.0%) | 0 (0.0%) |
| 18 to 34 Years | 0 (0.0%) | 0 (0.0%) |
| 35 to 64 Years | 27 (3.5%) | 0 (0.0%) |
| 65 to 74 Years | 23 (21.1%) | 29 (13.6%) |
| 75 Years and over | 29 (34.5%) | 19 (52.8%) |
Disability Class: Self-Care Difficulty
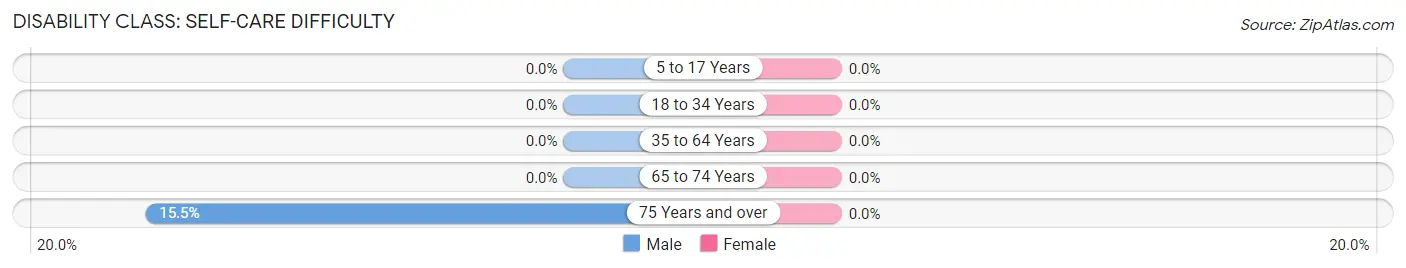
| Age Bracket | Male | Female |
| 5 to 17 Years | 0 (0.0%) | 0 (0.0%) |
| 18 to 34 Years | 0 (0.0%) | 0 (0.0%) |
| 35 to 64 Years | 0 (0.0%) | 0 (0.0%) |
| 65 to 74 Years | 0 (0.0%) | 0 (0.0%) |
| 75 Years and over | 13 (15.5%) | 0 (0.0%) |
Technology Access in Country Lake Estates
Computing Device Access in Country Lake Estates
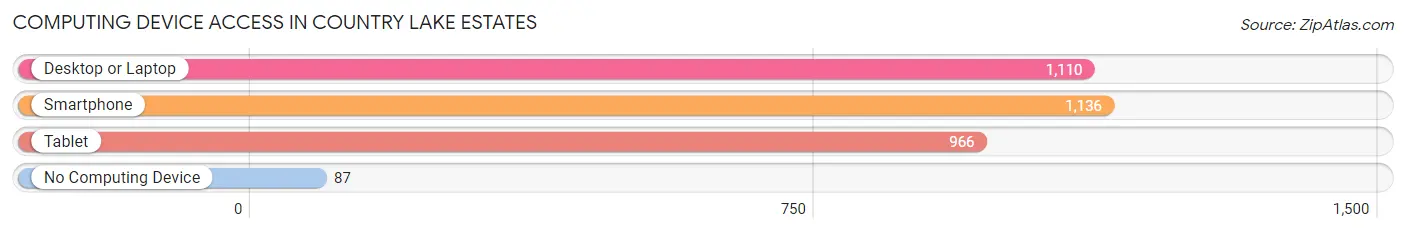
| Device Type | # Households | % Households |
| Desktop or Laptop | 1,110 | 85.8% |
| Smartphone | 1,136 | 87.8% |
| Tablet | 966 | 74.7% |
| No Computing Device | 87 | 6.7% |
| Total | 1,294 | 100.0% |
Internet Access in Country Lake Estates
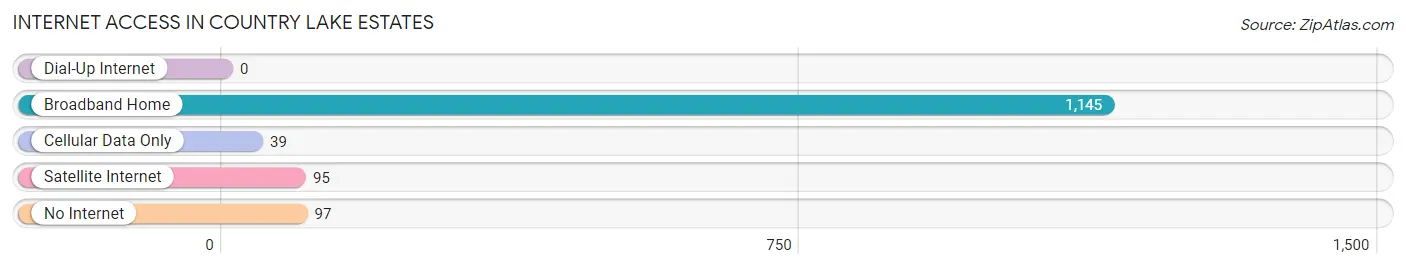
| Internet Type | # Households | % Households |
| Dial-Up Internet | 0 | 0.0% |
| Broadband Home | 1,145 | 88.5% |
| Cellular Data Only | 39 | 3.0% |
| Satellite Internet | 95 | 7.3% |
| No Internet | 97 | 7.5% |
| Total | 1,294 | 100.0% |
Country Lake Estates Summary
Lake Estates, NJ is a small, unincorporated community located in the northern part of the state of New Jersey. It is situated in the heart of the Ramapo Mountains, a range of hills and mountains that stretch from the Hudson River to the Delaware River. The community is bordered by the towns of Mahwah, Oakland, and Ringwood.
History
The area that is now Lake Estates, NJ was first settled in the late 1700s by Dutch and German immigrants. The area was originally known as “The Ramapo Valley” and was home to a number of small farms and homesteads. In the early 1900s, the area began to be developed as a summer resort destination. The area was known for its beautiful lakes and mountain views, and was a popular destination for wealthy New Yorkers looking to escape the hustle and bustle of the city.
In the 1950s, the area began to be developed as a residential community. The area was renamed “Lake Estates” and the first homes were built in the late 1950s. The community has grown steadily since then and now consists of over 500 homes.
Geography
Lake Estates, NJ is located in the northern part of the state of New Jersey. It is situated in the heart of the Ramapo Mountains, a range of hills and mountains that stretch from the Hudson River to the Delaware River. The community is bordered by the towns of Mahwah, Oakland, and Ringwood.
The area is known for its beautiful lakes and mountain views. The community is home to several small lakes, including Lake Estates Lake, Lake Mahwah, and Lake Ringwood. The area is also home to several parks, including Ramapo Valley County Park, Ramapo Mountain State Park, and Ringwood State Park.
Economy
The economy of Lake Estates, NJ is largely based on tourism and recreation. The area is home to several small businesses, including restaurants, shops, and lodging. The area is also home to several golf courses, including the Lake Estates Golf Course and the Mahwah Golf Course.
The area is also home to several corporate headquarters, including the headquarters of the pharmaceutical company Merck & Co. and the telecommunications company Verizon.
Demographics
As of the 2010 census, the population of Lake Estates, NJ was 1,845. The population is largely white (90.2%), with small percentages of African American (3.2%), Asian (2.2%), and Hispanic (2.2%) residents. The median household income is $90,000, and the median home value is $400,000.
The area is home to several schools, including Lake Estates Elementary School, Mahwah High School, and Ramapo College. The area is also home to several churches, including the Lake Estates Presbyterian Church and the Mahwah United Methodist Church.
Conclusion
Lake Estates, NJ is a small, unincorporated community located in the northern part of the state of New Jersey. It is situated in the heart of the Ramapo Mountains, a range of hills and mountains that stretch from the Hudson River to the Delaware River. The community is bordered by the towns of Mahwah, Oakland, and Ringwood. The area is known for its beautiful lakes and mountain views, and is a popular destination for tourists and residents alike. The economy of the area is largely based on tourism and recreation, and the population is largely white. The area is home to several schools, churches, and corporate headquarters, and is a great place to live and visit.
Common Questions
What is Per Capita Income in Country Lake Estates?
Per Capita income in Country Lake Estates is $42,749.
What is the Median Family Income in Country Lake Estates?
Median Family Income in Country Lake Estates is $116,793.
What is the Median Household income in Country Lake Estates?
Median Household Income in Country Lake Estates is $114,914.
What is Income or Wage Gap in Country Lake Estates?
Income or Wage Gap in Country Lake Estates is 60.6%.
Women in Country Lake Estates earn 39.4 cents for every dollar earned by a man.
What is Inequality or Gini Index in Country Lake Estates?
Inequality or Gini Index in Country Lake Estates is 0.35.
What is the Total Population of Country Lake Estates?
Total Population of Country Lake Estates is 4,179.
What is the Total Male Population of Country Lake Estates?
Total Male Population of Country Lake Estates is 1,616.
What is the Total Female Population of Country Lake Estates?
Total Female Population of Country Lake Estates is 2,563.
What is the Ratio of Males per 100 Females in Country Lake Estates?
There are 63.05 Males per 100 Females in Country Lake Estates.
What is the Ratio of Females per 100 Males in Country Lake Estates?
There are 158.60 Females per 100 Males in Country Lake Estates.
What is the Median Population Age in Country Lake Estates?
Median Population Age in Country Lake Estates is 36.8 Years.
What is the Average Family Size in Country Lake Estates
Average Family Size in Country Lake Estates is 3.4 People.
What is the Average Household Size in Country Lake Estates
Average Household Size in Country Lake Estates is 3.2 People.
How Large is the Labor Force in Country Lake Estates?
There are 2,511 People in the Labor Forcein in Country Lake Estates.
What is the Percentage of People in the Labor Force in Country Lake Estates?
75.2% of People are in the Labor Force in Country Lake Estates.
What is the Unemployment Rate in Country Lake Estates?
Unemployment Rate in Country Lake Estates is 2.9%.