Cities with the Highest Percentage of Native Hawaiian Population in New Jersey
RELATED REPORTS & OPTIONS
Native Hawaiian
New Jersey
Compare Cities
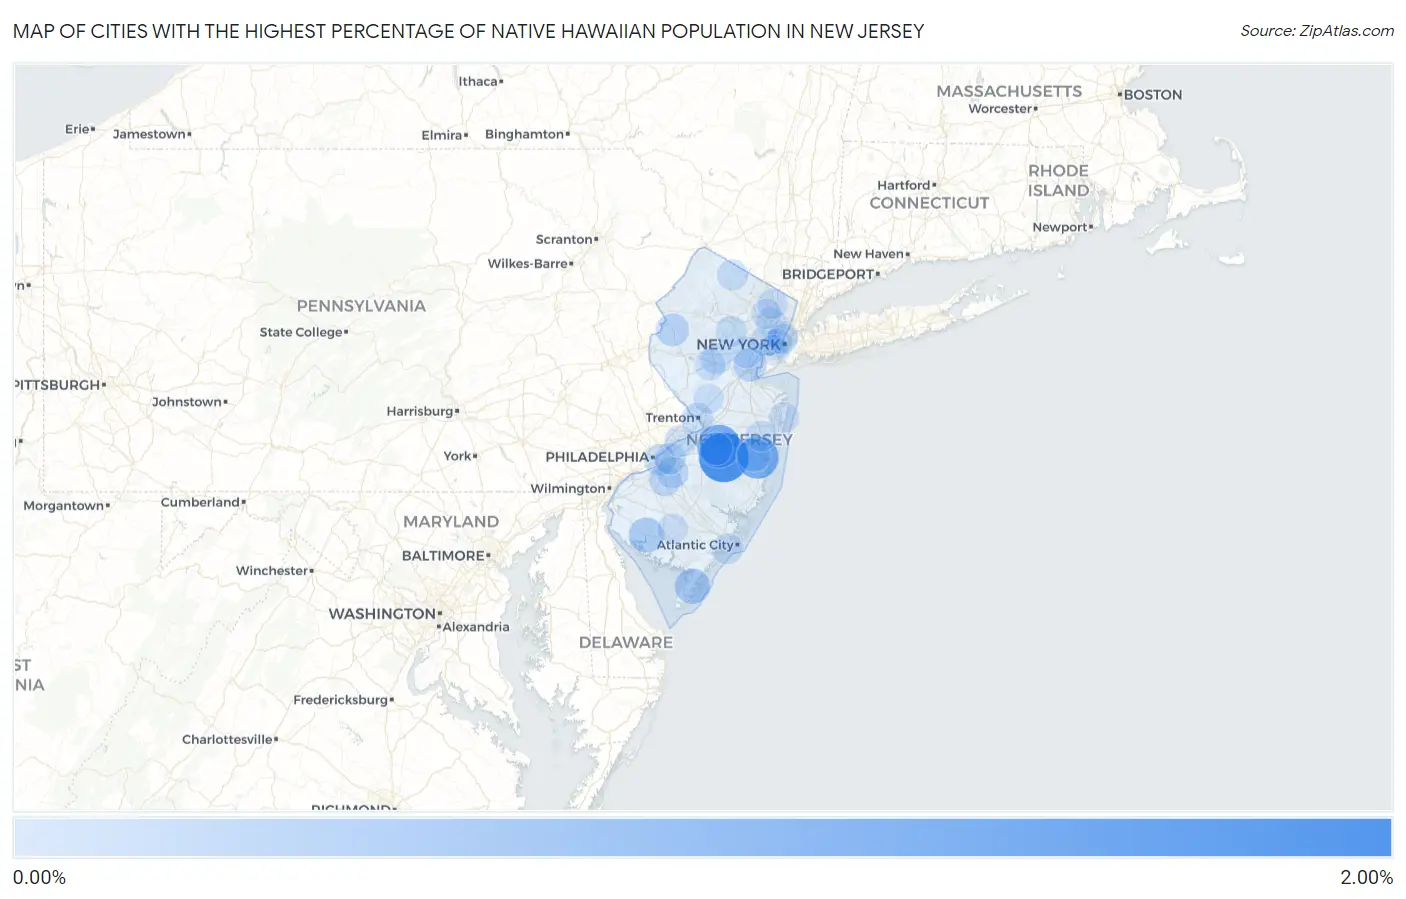
Map of Cities with the Highest Percentage of Native Hawaiian Population in New Jersey
0.00%
2.00%
Cities with the Highest Percentage of Native Hawaiian Population in New Jersey
| City | Native Hawaiian | vs State | vs National | |
| 1. | Country Lake Estates | 1.72% | 0.030%(+1.69)#1 | 0.20%(+1.53)#422 |
| 2. | Somerdale Borough | 1.65% | 0.030%(+1.62)#2 | 0.20%(+1.45)#436 |
| 3. | Mcguire Afb | 1.15% | 0.030%(+1.12)#3 | 0.20%(+0.948)#590 |
| 4. | Holiday City South | 1.07% | 0.030%(+1.04)#4 | 0.20%(+0.868)#629 |
| 5. | Bargaintown | 1.01% | 0.030%(+0.983)#5 | 0.20%(+0.815)#655 |
| 6. | Madison Borough | 0.72% | 0.030%(+0.690)#6 | 0.20%(+0.523)#864 |
| 7. | Bloomingdale Borough | 0.65% | 0.030%(+0.617)#7 | 0.20%(+0.449)#945 |
| 8. | Woodland Park Borough | 0.59% | 0.030%(+0.557)#8 | 0.20%(+0.389)#1,034 |
| 9. | Woodcliff Lake Borough | 0.54% | 0.030%(+0.511)#9 | 0.20%(+0.344)#1,097 |
| 10. | Berlin Borough | 0.53% | 0.030%(+0.504)#10 | 0.20%(+0.336)#1,111 |
| 11. | Cape May Court House | 0.45% | 0.030%(+0.420)#11 | 0.20%(+0.252)#1,255 |
| 12. | Bridgeton | 0.41% | 0.030%(+0.375)#12 | 0.20%(+0.208)#1,358 |
| 13. | Folsom Borough | 0.40% | 0.030%(+0.368)#13 | 0.20%(+0.200)#1,379 |
| 14. | Landing | 0.29% | 0.030%(+0.262)#14 | 0.20%(+0.094)#1,702 |
| 15. | Atco | 0.29% | 0.030%(+0.256)#15 | 0.20%(+0.088)#1,724 |
| 16. | Holiday City Berkeley | 0.28% | 0.030%(+0.255)#16 | 0.20%(+0.087)#1,728 |
| 17. | Iselin | 0.26% | 0.030%(+0.235)#17 | 0.20%(+0.067)#1,816 |
| 18. | The College Of New Jersey | 0.26% | 0.030%(+0.226)#18 | 0.20%(+0.058)#1,848 |
| 19. | Bound Brook Borough | 0.24% | 0.030%(+0.214)#19 | 0.20%(+0.046)#1,905 |
| 20. | Oxford | 0.24% | 0.030%(+0.210)#20 | 0.20%(+0.042)#1,919 |
| 21. | Fort Dix | 0.22% | 0.030%(+0.189)#21 | 0.20%(+0.021)#2,026 |
| 22. | Englewood Cliffs Borough | 0.21% | 0.030%(+0.176)#22 | 0.20%(+0.008)#2,100 |
| 23. | Glen Rock Borough | 0.20% | 0.030%(+0.169)#23 | 0.20%(+0.001)#2,128 |
| 24. | Merchantville Borough | 0.18% | 0.030%(+0.154)#24 | 0.20%(-0.013)#2,198 |
| 25. | Blackwood | 0.15% | 0.030%(+0.123)#25 | 0.20%(-0.045)#2,389 |
| 26. | Pemberton Borough | 0.15% | 0.030%(+0.120)#26 | 0.20%(-0.048)#2,410 |
| 27. | Trenton | 0.15% | 0.030%(+0.118)#27 | 0.20%(-0.050)#2,426 |
| 28. | Echelon | 0.15% | 0.030%(+0.118)#28 | 0.20%(-0.050)#2,429 |
| 29. | Camden | 0.14% | 0.030%(+0.109)#29 | 0.20%(-0.058)#2,497 |
| 30. | Montvale Borough | 0.13% | 0.030%(+0.101)#30 | 0.20%(-0.067)#2,557 |
| 31. | Cherry Hill Mall | 0.12% | 0.030%(+0.093)#31 | 0.20%(-0.075)#2,619 |
| 32. | Westfield | 0.12% | 0.030%(+0.090)#32 | 0.20%(-0.078)#2,636 |
| 33. | Beverly | 0.12% | 0.030%(+0.090)#33 | 0.20%(-0.078)#2,637 |
| 34. | Butler Borough | 0.11% | 0.030%(+0.082)#34 | 0.20%(-0.086)#2,701 |
| 35. | Buena Borough | 0.11% | 0.030%(+0.081)#35 | 0.20%(-0.087)#2,707 |
| 36. | Roselle Borough | 0.11% | 0.030%(+0.077)#36 | 0.20%(-0.091)#2,744 |
| 37. | Beachwood Borough | 0.10% | 0.030%(+0.071)#37 | 0.20%(-0.097)#2,793 |
| 38. | Morristown | 0.094% | 0.030%(+0.065)#38 | 0.20%(-0.103)#2,851 |
| 39. | Manville Borough | 0.092% | 0.030%(+0.062)#39 | 0.20%(-0.106)#2,869 |
| 40. | Green Knoll | 0.090% | 0.030%(+0.061)#40 | 0.20%(-0.107)#2,886 |
| 41. | Fort Lee Borough | 0.075% | 0.030%(+0.046)#41 | 0.20%(-0.122)#3,035 |
| 42. | Margate City | 0.075% | 0.030%(+0.045)#42 | 0.20%(-0.123)#3,037 |
| 43. | Highland Lakes | 0.073% | 0.030%(+0.044)#43 | 0.20%(-0.124)#3,058 |
| 44. | Elmwood Park Borough | 0.071% | 0.030%(+0.041)#44 | 0.20%(-0.127)#3,086 |
| 45. | Bradley Gardens | 0.070% | 0.030%(+0.040)#45 | 0.20%(-0.128)#3,092 |
| 46. | Spotswood Borough | 0.061% | 0.030%(+0.032)#46 | 0.20%(-0.136)#3,172 |
| 47. | Lakewood | 0.060% | 0.030%(+0.030)#47 | 0.20%(-0.138)#3,196 |
| 48. | Lodi Borough | 0.054% | 0.030%(+0.024)#48 | 0.20%(-0.144)#3,265 |
| 49. | Glassboro Borough | 0.043% | 0.030%(+0.014)#49 | 0.20%(-0.154)#3,383 |
| 50. | Passaic | 0.036% | 0.030%(+0.006)#50 | 0.20%(-0.162)#3,473 |
| 51. | Ridgewood | 0.035% | 0.030%(+0.005)#51 | 0.20%(-0.163)#3,486 |
| 52. | Vineland | 0.035% | 0.030%(+0.005)#52 | 0.20%(-0.163)#3,487 |
| 53. | Fair Lawn Borough | 0.034% | 0.030%(+0.004)#53 | 0.20%(-0.163)#3,488 |
| 54. | Bergenfield Borough | 0.032% | 0.030%(+0.002)#54 | 0.20%(-0.166)#3,522 |
| 55. | Asbury Park | 0.026% | 0.030%(-0.004)#55 | 0.20%(-0.171)#3,599 |
| 56. | Newark | 0.022% | 0.030%(-0.008)#56 | 0.20%(-0.176)#3,663 |
| 57. | Union City | 0.019% | 0.030%(-0.011)#57 | 0.20%(-0.178)#3,711 |
| 58. | Sicklerville | 0.017% | 0.030%(-0.012)#58 | 0.20%(-0.180)#3,737 |
| 59. | Hoboken | 0.017% | 0.030%(-0.013)#59 | 0.20%(-0.181)#3,745 |
| 60. | Princeton | 0.016% | 0.030%(-0.013)#60 | 0.20%(-0.181)#3,753 |
| 61. | Jersey City | 0.012% | 0.030%(-0.018)#61 | 0.20%(-0.186)#3,817 |
| 62. | Bayonne | 0.011% | 0.030%(-0.018)#62 | 0.20%(-0.186)#3,824 |
| 63. | Paterson | 0.0063% | 0.030%(-0.024)#63 | 0.20%(-0.191)#3,883 |
| 64. | Palisades Park Borough | 0.0049% | 0.030%(-0.025)#64 | 0.20%(-0.193)#3,899 |
1
2Common Questions
What are the Top 10 Cities with the Highest Percentage of Native Hawaiian Population in New Jersey?
Top 10 Cities with the Highest Percentage of Native Hawaiian Population in New Jersey are:
#1
1.72%
#2
1.15%
#3
1.07%
#4
0.45%
#5
0.41%
#6
0.28%
#7
0.26%
#8
0.24%
#9
0.22%
#10
0.15%
What city has the Highest Percentage of Native Hawaiian Population in New Jersey?
Country Lake Estates has the Highest Percentage of Native Hawaiian Population in New Jersey with 1.72%.
What is the Percentage of Native Hawaiian Population in the State of New Jersey?
Percentage of Native Hawaiian Population in New Jersey is 0.030%.
What is the Percentage of Native Hawaiian Population in the United States?
Percentage of Native Hawaiian Population in the United States is 0.20%.