Cities with the Most Immigrants from Netherlands in New Jersey
RELATED REPORTS & OPTIONS
Netherlands
New Jersey
Compare Cities
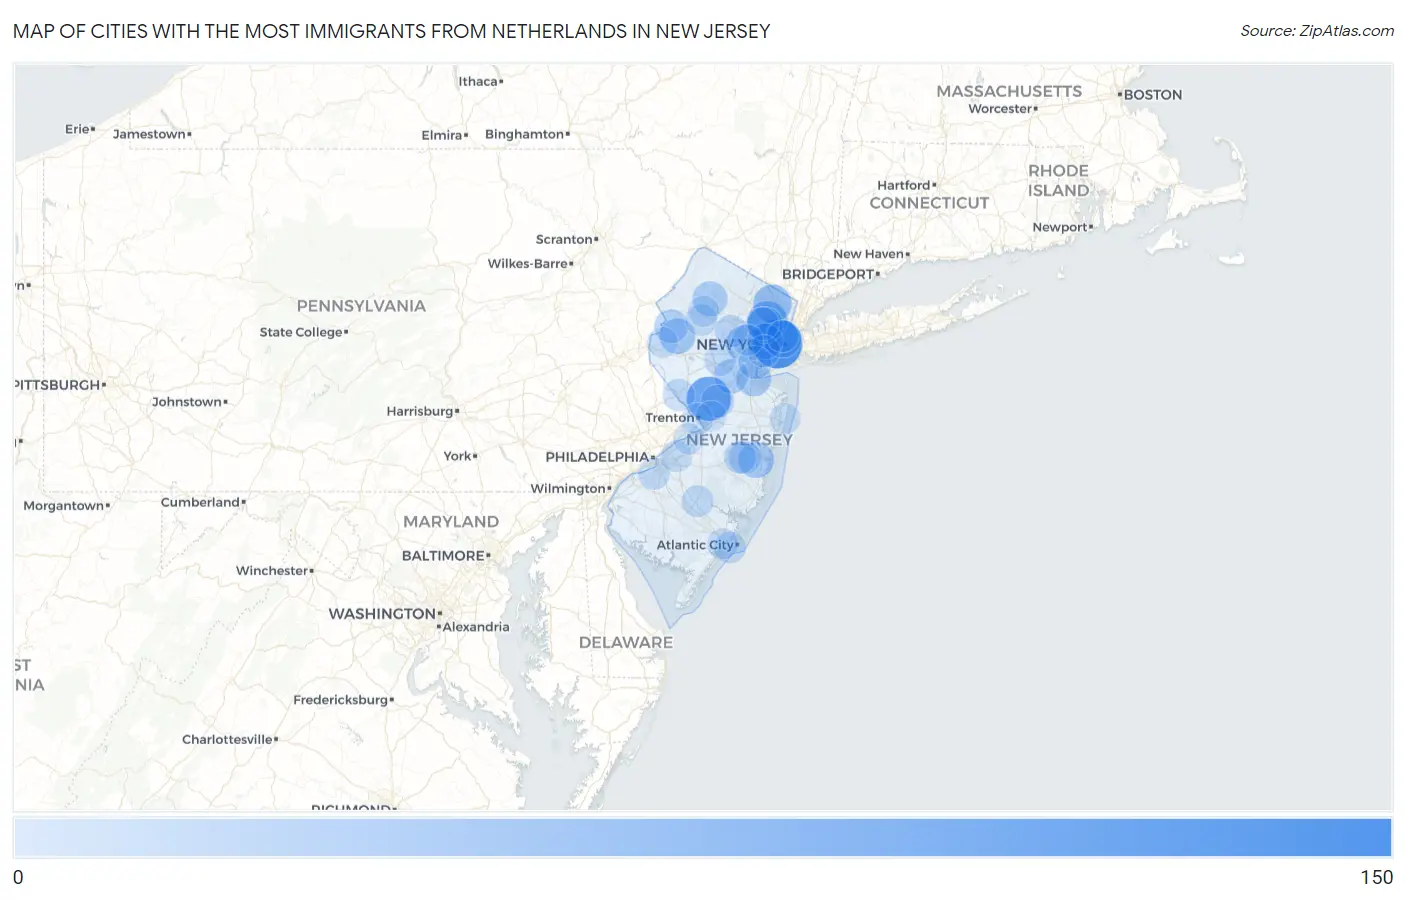
Map of Cities with the Most Immigrants from Netherlands in New Jersey
0
150
Cities with the Most Immigrants from Netherlands in New Jersey
| City | Netherlands | vs State | vs National | |
| 1. | Jersey City | 134 | 2,616(5.12%)#1 | 83,187(0.16%)#58 |
| 2. | Princeton | 96 | 2,616(3.67%)#2 | 83,187(0.12%)#107 |
| 3. | Bernardsville Borough | 86 | 2,616(3.29%)#3 | 83,187(0.10%)#125 |
| 4. | Lyons | 81 | 2,616(3.10%)#4 | 83,187(0.10%)#137 |
| 5. | Clifton | 67 | 2,616(2.56%)#5 | 83,187(0.08%)#187 |
| 6. | Ridgewood | 55 | 2,616(2.10%)#6 | 83,187(0.07%)#248 |
| 7. | Hoboken | 51 | 2,616(1.95%)#7 | 83,187(0.06%)#266 |
| 8. | Woodland Park Borough | 49 | 2,616(1.87%)#8 | 83,187(0.06%)#280 |
| 9. | Summit | 48 | 2,616(1.83%)#9 | 83,187(0.06%)#288 |
| 10. | Brookdale | 40 | 2,616(1.53%)#10 | 83,187(0.05%)#360 |
| 11. | Holiday Heights | 39 | 2,616(1.49%)#11 | 83,187(0.05%)#371 |
| 12. | Port Colden | 37 | 2,616(1.41%)#12 | 83,187(0.04%)#405 |
| 13. | Newark | 36 | 2,616(1.38%)#13 | 83,187(0.04%)#407 |
| 14. | New Providence Borough | 36 | 2,616(1.38%)#14 | 83,187(0.04%)#418 |
| 15. | South Amboy | 34 | 2,616(1.30%)#15 | 83,187(0.04%)#455 |
| 16. | Lake Mohawk | 32 | 2,616(1.22%)#16 | 83,187(0.04%)#486 |
| 17. | East Franklin | 30 | 2,616(1.15%)#17 | 83,187(0.04%)#530 |
| 18. | Brookside | 27 | 2,616(1.03%)#18 | 83,187(0.03%)#587 |
| 19. | Ramsey Borough | 26 | 2,616(0.99%)#19 | 83,187(0.03%)#609 |
| 20. | Lakehurst Borough | 26 | 2,616(0.99%)#20 | 83,187(0.03%)#615 |
| 21. | Red Bank Borough | 25 | 2,616(0.96%)#21 | 83,187(0.03%)#641 |
| 22. | Buttzville | 25 | 2,616(0.96%)#22 | 83,187(0.03%)#645 |
| 23. | Hopatcong Borough | 23 | 2,616(0.88%)#23 | 83,187(0.03%)#684 |
| 24. | Hopelawn | 22 | 2,616(0.84%)#24 | 83,187(0.03%)#715 |
| 25. | Somerville Borough | 21 | 2,616(0.80%)#25 | 83,187(0.03%)#744 |
| 26. | Wood Ridge Borough | 21 | 2,616(0.80%)#26 | 83,187(0.03%)#745 |
| 27. | Avenel | 20 | 2,616(0.76%)#27 | 83,187(0.02%)#786 |
| 28. | Clayton Borough | 19 | 2,616(0.73%)#28 | 83,187(0.02%)#833 |
| 29. | Plainsboro Center | 19 | 2,616(0.73%)#29 | 83,187(0.02%)#840 |
| 30. | Upper Montclair | 18 | 2,616(0.69%)#30 | 83,187(0.02%)#866 |
| 31. | Morristown | 17 | 2,616(0.65%)#31 | 83,187(0.02%)#911 |
| 32. | Crestwood Village | 17 | 2,616(0.65%)#32 | 83,187(0.02%)#924 |
| 33. | Riverton Borough | 16 | 2,616(0.61%)#33 | 83,187(0.02%)#969 |
| 34. | Collingswood Borough | 15 | 2,616(0.57%)#34 | 83,187(0.02%)#1,008 |
| 35. | Cedar Glen Lakes | 15 | 2,616(0.57%)#35 | 83,187(0.02%)#1,027 |
| 36. | Elizabeth | 14 | 2,616(0.54%)#36 | 83,187(0.02%)#1,032 |
| 37. | Lambertville | 14 | 2,616(0.54%)#37 | 83,187(0.02%)#1,078 |
| 38. | Point Pleasant Borough | 13 | 2,616(0.50%)#38 | 83,187(0.02%)#1,117 |
| 39. | Tenafly Borough | 13 | 2,616(0.50%)#39 | 83,187(0.02%)#1,123 |
| 40. | Pompton Plains | 13 | 2,616(0.50%)#40 | 83,187(0.02%)#1,128 |
| 41. | Milltown Borough | 13 | 2,616(0.50%)#41 | 83,187(0.02%)#1,135 |
| 42. | Roselle Park Borough | 12 | 2,616(0.46%)#42 | 83,187(0.01%)#1,190 |
| 43. | Budd Lake | 12 | 2,616(0.46%)#43 | 83,187(0.01%)#1,199 |
| 44. | Woodbury | 12 | 2,616(0.46%)#44 | 83,187(0.01%)#1,200 |
| 45. | Glassboro Borough | 11 | 2,616(0.42%)#45 | 83,187(0.01%)#1,261 |
| 46. | Hammonton | 11 | 2,616(0.42%)#46 | 83,187(0.01%)#1,270 |
| 47. | Ventnor City | 11 | 2,616(0.42%)#47 | 83,187(0.01%)#1,284 |
| 48. | Chatham Borough | 11 | 2,616(0.42%)#48 | 83,187(0.01%)#1,287 |
| 49. | Shrewsbury Borough | 11 | 2,616(0.42%)#49 | 83,187(0.01%)#1,298 |
| 50. | Pines Lake | 11 | 2,616(0.42%)#50 | 83,187(0.01%)#1,306 |
| 51. | Union City | 10 | 2,616(0.38%)#51 | 83,187(0.01%)#1,329 |
| 52. | New Milford Borough | 10 | 2,616(0.38%)#52 | 83,187(0.01%)#1,373 |
| 53. | Moorestown Lenola | 10 | 2,616(0.38%)#53 | 83,187(0.01%)#1,377 |
| 54. | Martinsville | 10 | 2,616(0.38%)#54 | 83,187(0.01%)#1,381 |
| 55. | Glen Rock Borough | 10 | 2,616(0.38%)#55 | 83,187(0.01%)#1,382 |
| 56. | Audubon Borough | 10 | 2,616(0.38%)#56 | 83,187(0.01%)#1,391 |
| 57. | High Bridge Borough | 10 | 2,616(0.38%)#57 | 83,187(0.01%)#1,405 |
| 58. | Freehold Borough | 9 | 2,616(0.34%)#58 | 83,187(0.01%)#1,463 |
| 59. | Ringwood Borough | 9 | 2,616(0.34%)#59 | 83,187(0.01%)#1,465 |
| 60. | Kinnelon Borough | 9 | 2,616(0.34%)#60 | 83,187(0.01%)#1,471 |
| 61. | Pitman Borough | 9 | 2,616(0.34%)#61 | 83,187(0.01%)#1,474 |
| 62. | Basking Ridge | 9 | 2,616(0.34%)#62 | 83,187(0.01%)#1,476 |
| 63. | Old Tappan Borough | 9 | 2,616(0.34%)#63 | 83,187(0.01%)#1,480 |
| 64. | Westville Borough | 9 | 2,616(0.34%)#64 | 83,187(0.01%)#1,485 |
| 65. | Alpha Borough | 9 | 2,616(0.34%)#65 | 83,187(0.01%)#1,495 |
| 66. | Lebanon Borough | 9 | 2,616(0.34%)#66 | 83,187(0.01%)#1,496 |
| 67. | Trenton | 8 | 2,616(0.31%)#67 | 83,187(0.01%)#1,509 |
| 68. | Short Hills | 8 | 2,616(0.31%)#68 | 83,187(0.01%)#1,557 |
| 69. | Lake Hopatcong | 8 | 2,616(0.31%)#69 | 83,187(0.01%)#1,566 |
| 70. | Oradell Borough | 8 | 2,616(0.31%)#70 | 83,187(0.01%)#1,573 |
| 71. | Hightstown Borough | 8 | 2,616(0.31%)#71 | 83,187(0.01%)#1,580 |
| 72. | Netcong Borough | 8 | 2,616(0.31%)#72 | 83,187(0.01%)#1,588 |
| 73. | Ocean Gate Borough | 8 | 2,616(0.31%)#73 | 83,187(0.01%)#1,600 |
| 74. | Far Hills Borough | 8 | 2,616(0.31%)#74 | 83,187(0.01%)#1,605 |
| 75. | Ogdensburg Borough | 7 | 2,616(0.27%)#75 | 83,187(0.01%)#1,688 |
| 76. | Burlington | 6 | 2,616(0.23%)#76 | 83,187(0.01%)#1,743 |
| 77. | Northfield | 6 | 2,616(0.23%)#77 | 83,187(0.01%)#1,749 |
| 78. | The College Of New Jersey | 6 | 2,616(0.23%)#78 | 83,187(0.01%)#1,765 |
| 79. | Ocean Grove | 6 | 2,616(0.23%)#79 | 83,187(0.01%)#1,771 |
| 80. | Pennington Borough | 6 | 2,616(0.23%)#80 | 83,187(0.01%)#1,773 |
| 81. | Byram Center | 6 | 2,616(0.23%)#81 | 83,187(0.01%)#1,785 |
| 82. | Sussex Borough | 6 | 2,616(0.23%)#82 | 83,187(0.01%)#1,787 |
| 83. | Frenchtown Borough | 6 | 2,616(0.23%)#83 | 83,187(0.01%)#1,793 |
| 84. | New Village | 5 | 2,616(0.19%)#84 | 83,187(0.01%)#1,881 |
| 85. | Hamilton Square | 3 | 2,616(0.11%)#85 | 83,187(0.00%)#1,977 |
| 86. | Essex Fells Borough | 3 | 2,616(0.11%)#86 | 83,187(0.00%)#1,992 |
| 87. | Folsom Borough | 3 | 2,616(0.11%)#87 | 83,187(0.00%)#1,999 |
| 88. | Hampton Borough | 3 | 2,616(0.11%)#88 | 83,187(0.00%)#2,027 |
| 89. | Harvey Cedars Borough | 2 | 2,616(0.08%)#89 | 83,187(0.00%)#2,109 |
| 90. | Barnegat Light Borough | 2 | 2,616(0.08%)#90 | 83,187(0.00%)#2,110 |
Common Questions
What are the Top 10 Cities with the Most Immigrants from Netherlands in New Jersey?
Top 10 Cities with the Most Immigrants from Netherlands in New Jersey are:
#1
134
#2
96
#3
67
#4
55
#5
51
#6
48
#7
40
#8
39
#9
37
#10
36
What city has the Most Immigrants from Netherlands in New Jersey?
Jersey City has the Most Immigrants from Netherlands in New Jersey with 134.
What is the Total Immigrants from Netherlands in the State of New Jersey?
Total Immigrants from Netherlands in New Jersey is 2,616.
What is the Total Immigrants from Netherlands in the United States?
Total Immigrants from Netherlands in the United States is 83,187.