Cities with the Most Immigrants from Bolivia in New Jersey
RELATED REPORTS & OPTIONS
Bolivia
New Jersey
Compare Cities
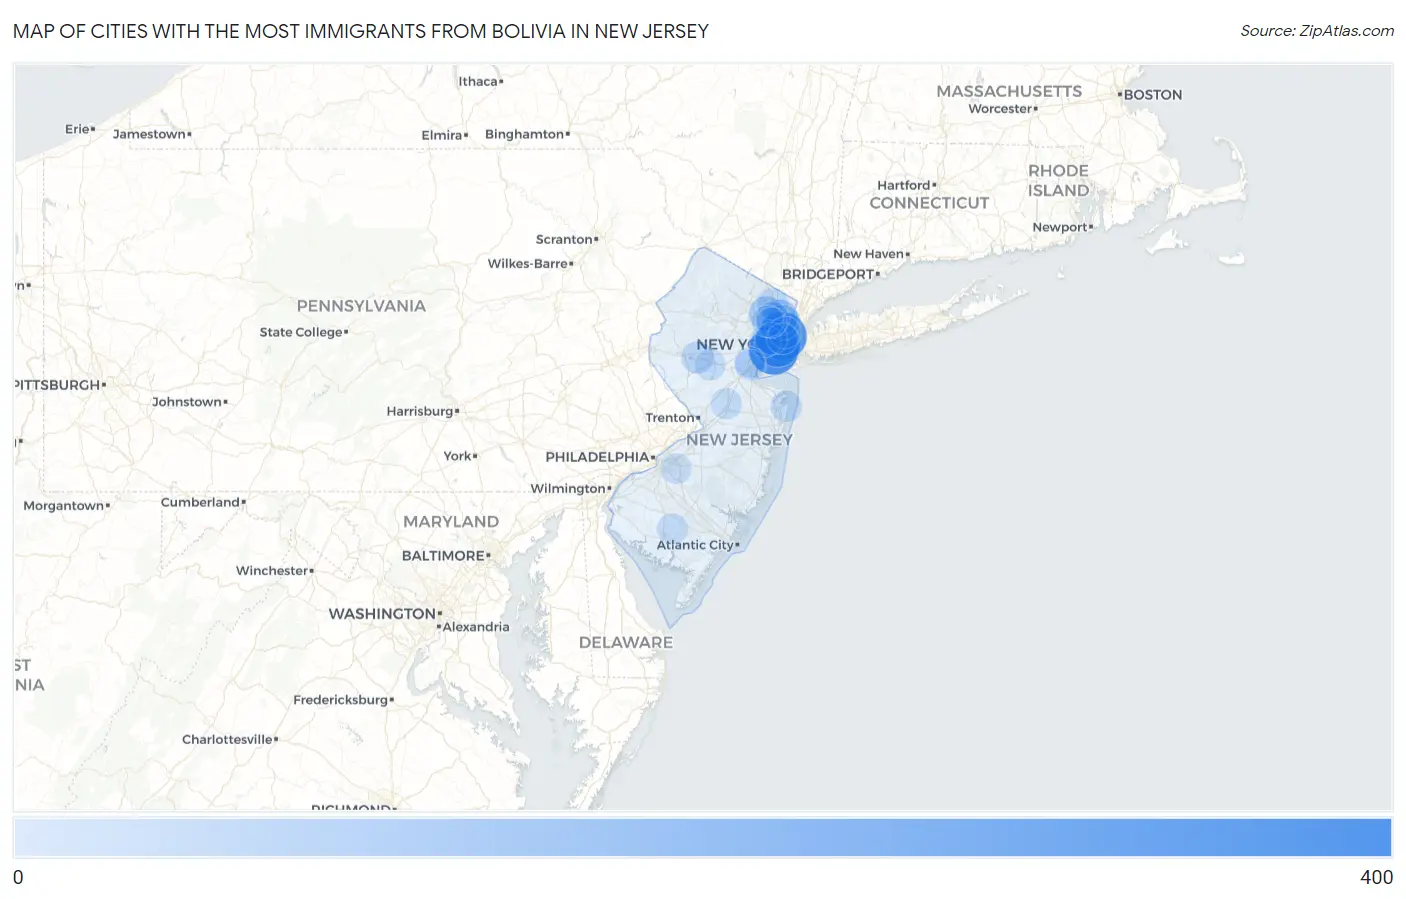
Map of Cities with the Most Immigrants from Bolivia in New Jersey
0
400
Cities with the Most Immigrants from Bolivia in New Jersey
| City | Bolivia | vs State | vs National | |
| 1. | Bayonne | 314 | 3,252(9.66%)#1 | 80,173(0.39%)#35 |
| 2. | Union City | 297 | 3,252(9.13%)#2 | 80,173(0.37%)#39 |
| 3. | Jersey City | 265 | 3,252(8.15%)#3 | 80,173(0.33%)#44 |
| 4. | Haledon Borough | 213 | 3,252(6.55%)#4 | 80,173(0.27%)#62 |
| 5. | Leonia Borough | 101 | 3,252(3.11%)#5 | 80,173(0.13%)#150 |
| 6. | Roselle Park Borough | 100 | 3,252(3.08%)#6 | 80,173(0.12%)#151 |
| 7. | Hasbrouck Heights Borough | 95 | 3,252(2.92%)#7 | 80,173(0.12%)#159 |
| 8. | Hackensack | 87 | 3,252(2.68%)#8 | 80,173(0.11%)#168 |
| 9. | Ridgefield Park | 80 | 3,252(2.46%)#9 | 80,173(0.10%)#195 |
| 10. | Paterson | 75 | 3,252(2.31%)#10 | 80,173(0.09%)#205 |
| 11. | Garfield | 53 | 3,252(1.63%)#11 | 80,173(0.07%)#284 |
| 12. | Rutherford Borough | 40 | 3,252(1.23%)#12 | 80,173(0.05%)#350 |
| 13. | White House Station | 33 | 3,252(1.01%)#13 | 80,173(0.04%)#409 |
| 14. | Ridgewood | 26 | 3,252(0.80%)#14 | 80,173(0.03%)#478 |
| 15. | Bargaintown | 25 | 3,252(0.77%)#15 | 80,173(0.03%)#496 |
| 16. | Newark | 23 | 3,252(0.71%)#16 | 80,173(0.03%)#514 |
| 17. | West New York | 23 | 3,252(0.71%)#17 | 80,173(0.03%)#520 |
| 18. | Kearny | 23 | 3,252(0.71%)#18 | 80,173(0.03%)#523 |
| 19. | Clifton | 22 | 3,252(0.68%)#19 | 80,173(0.03%)#538 |
| 20. | Long Branch | 22 | 3,252(0.68%)#20 | 80,173(0.03%)#541 |
| 21. | Roselle Borough | 21 | 3,252(0.65%)#21 | 80,173(0.03%)#556 |
| 22. | Somerdale Borough | 21 | 3,252(0.65%)#22 | 80,173(0.03%)#561 |
| 23. | North Arlington Borough | 18 | 3,252(0.55%)#23 | 80,173(0.02%)#614 |
| 24. | Cranbury | 18 | 3,252(0.55%)#24 | 80,173(0.02%)#618 |
| 25. | Hawthorne Borough | 17 | 3,252(0.52%)#25 | 80,173(0.02%)#628 |
| 26. | Vineland | 14 | 3,252(0.43%)#26 | 80,173(0.02%)#687 |
| 27. | Bradley Gardens | 14 | 3,252(0.43%)#27 | 80,173(0.02%)#693 |
| 28. | Hoboken | 9 | 3,252(0.28%)#28 | 80,173(0.01%)#824 |
| 29. | Cliffside Park Borough | 9 | 3,252(0.28%)#29 | 80,173(0.01%)#828 |
| 30. | Colonia | 9 | 3,252(0.28%)#30 | 80,173(0.01%)#834 |
| 31. | Collingswood Borough | 9 | 3,252(0.28%)#31 | 80,173(0.01%)#839 |
| 32. | Iselin | 8 | 3,252(0.25%)#32 | 80,173(0.01%)#864 |
| 33. | Springdale | 8 | 3,252(0.25%)#33 | 80,173(0.01%)#868 |
| 34. | Somerville Borough | 8 | 3,252(0.25%)#34 | 80,173(0.01%)#871 |
| 35. | Elmwood Park Borough | 7 | 3,252(0.22%)#35 | 80,173(0.01%)#900 |
| 36. | Hopatcong Borough | 6 | 3,252(0.18%)#36 | 80,173(0.01%)#923 |
| 37. | Haddonfield Borough | 5 | 3,252(0.15%)#37 | 80,173(0.01%)#941 |
| 38. | Sayreville Borough | 4 | 3,252(0.12%)#38 | 80,173(0.00%)#960 |
| 39. | Passaic | 3 | 3,252(0.09%)#39 | 80,173(0.00%)#975 |
Common Questions
What are the Top 10 Cities with the Most Immigrants from Bolivia in New Jersey?
Top 10 Cities with the Most Immigrants from Bolivia in New Jersey are:
#1
314
#2
297
#3
265
#4
87
#5
80
#6
75
#7
53
#8
33
#9
26
#10
23
What city has the Most Immigrants from Bolivia in New Jersey?
Bayonne has the Most Immigrants from Bolivia in New Jersey with 314.
What is the Total Immigrants from Bolivia in the State of New Jersey?
Total Immigrants from Bolivia in New Jersey is 3,252.
What is the Total Immigrants from Bolivia in the United States?
Total Immigrants from Bolivia in the United States is 80,173.