Allenhurst borough, NJ Map & Demographics
Allenhurst borough Overview
$97,349
PER CAPITA INCOME
$179,250
AVG FAMILY INCOME
$95,625
AVG HOUSEHOLD INCOME
7.1%
WAGE / INCOME GAP [ % ]
92.9¢/ $1
WAGE / INCOME GAP [ $ ]
0.62
INEQUALITY / GINI INDEX
412
TOTAL POPULATION
226
MALE POPULATION
186
FEMALE POPULATION
121.51
MALES / 100 FEMALES
82.30
FEMALES / 100 MALES
49.7
MEDIAN AGE
3.3
AVG FAMILY SIZE
2.4
AVG HOUSEHOLD SIZE
257
LABOR FORCE [ PEOPLE ]
68.7%
PERCENT IN LABOR FORCE
10.9%
UNEMPLOYMENT RATE
Income in Allenhurst borough
Income Overview in Allenhurst borough
Per Capita Income in Allenhurst borough is $97,349, while median incomes of families and households are $179,250 and $95,625 respectively.
| Characteristic | Number | Measure |
| Per Capita Income | 412 | $97,349 |
| Median Family Income | 93 | $179,250 |
| Mean Family Income | 93 | $364,308 |
| Median Household Income | 175 | $95,625 |
| Mean Household Income | 175 | $228,342 |
| Income Deficit | 93 | $0 |
| Wage / Income Gap (%) | 412 | 7.07% |
| Wage / Income Gap ($) | 412 | 92.93¢ per $1 |
| Gini / Inequality Index | 412 | 0.62 |
Earnings by Sex in Allenhurst borough
Average Earnings in Allenhurst borough are $58,906, $61,875 for men and $57,500 for women, a difference of 7.1%.
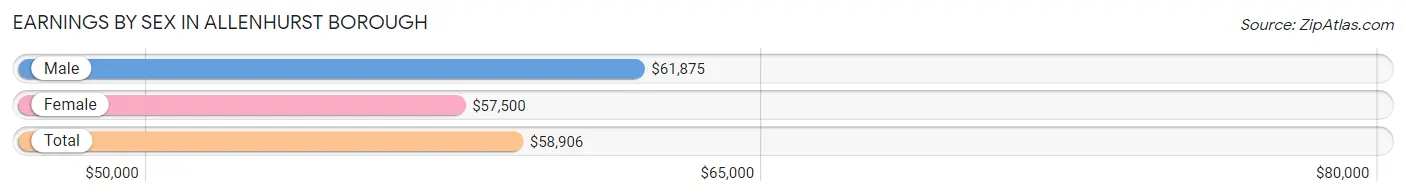
| Sex | Number | Average Earnings |
| Male | 145 (58.7%) | $61,875 |
| Female | 102 (41.3%) | $57,500 |
| Total | 247 (100.0%) | $58,906 |
Earnings by Sex by Income Bracket in Allenhurst borough
The most common earnings brackets in Allenhurst borough are $100,000+ for men (49 | 33.8%) and $100,000+ for women (37 | 36.3%).
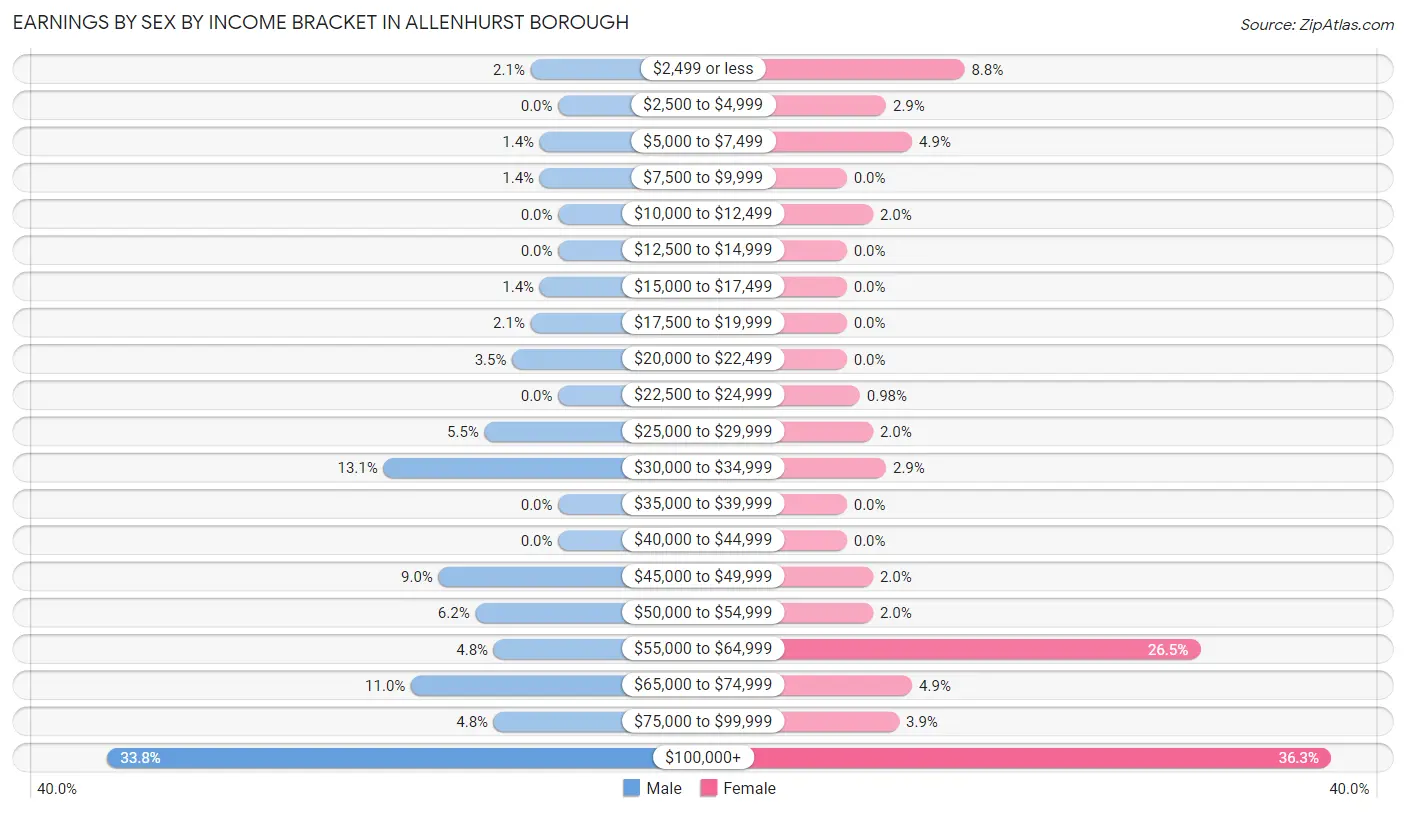
| Income | Male | Female |
| $2,499 or less | 3 (2.1%) | 9 (8.8%) |
| $2,500 to $4,999 | 0 (0.0%) | 3 (2.9%) |
| $5,000 to $7,499 | 2 (1.4%) | 5 (4.9%) |
| $7,500 to $9,999 | 2 (1.4%) | 0 (0.0%) |
| $10,000 to $12,499 | 0 (0.0%) | 2 (2.0%) |
| $12,500 to $14,999 | 0 (0.0%) | 0 (0.0%) |
| $15,000 to $17,499 | 2 (1.4%) | 0 (0.0%) |
| $17,500 to $19,999 | 3 (2.1%) | 0 (0.0%) |
| $20,000 to $22,499 | 5 (3.5%) | 0 (0.0%) |
| $22,500 to $24,999 | 0 (0.0%) | 1 (1.0%) |
| $25,000 to $29,999 | 8 (5.5%) | 2 (2.0%) |
| $30,000 to $34,999 | 19 (13.1%) | 3 (2.9%) |
| $35,000 to $39,999 | 0 (0.0%) | 0 (0.0%) |
| $40,000 to $44,999 | 0 (0.0%) | 0 (0.0%) |
| $45,000 to $49,999 | 13 (9.0%) | 2 (2.0%) |
| $50,000 to $54,999 | 9 (6.2%) | 2 (2.0%) |
| $55,000 to $64,999 | 7 (4.8%) | 27 (26.5%) |
| $65,000 to $74,999 | 16 (11.0%) | 5 (4.9%) |
| $75,000 to $99,999 | 7 (4.8%) | 4 (3.9%) |
| $100,000+ | 49 (33.8%) | 37 (36.3%) |
| Total | 145 (100.0%) | 102 (100.0%) |
Earnings by Sex by Educational Attainment in Allenhurst borough
Average earnings in Allenhurst borough are $71,125 for men and $58,250 for women, a difference of 18.1%. Men with an educational attainment of college or associate's degree enjoy the highest average annual earnings of $70,313, while those with high school diploma education earn the least with $34,417. Women with an educational attainment of graduate degree earn the most with the average annual earnings of $103,365, while those with college or associate's degree education have the smallest earnings of $56,250.
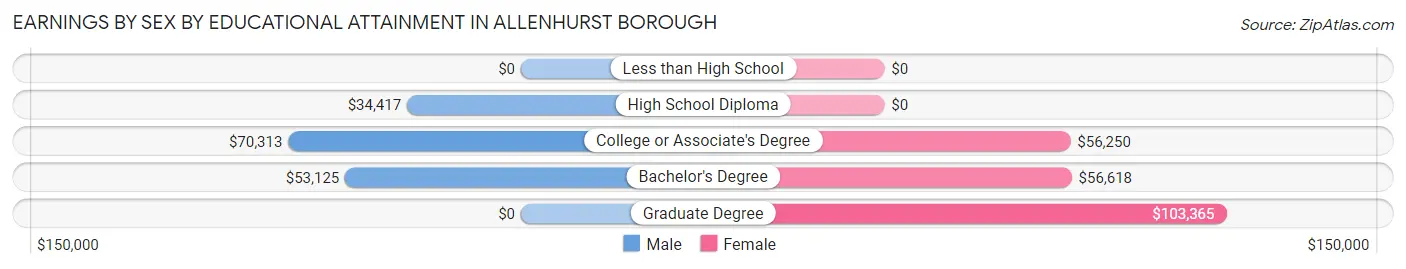
| Educational Attainment | Male Income | Female Income |
| Less than High School | - | - |
| High School Diploma | $34,417 | $0 |
| College or Associate's Degree | $70,313 | $56,250 |
| Bachelor's Degree | $53,125 | $56,618 |
| Graduate Degree | - | - |
| Total | $71,125 | $58,250 |
Family Income in Allenhurst borough
Family Income Brackets in Allenhurst borough
According to the Allenhurst borough family income data, there are 43 families falling into the $200,000+ income range, which is the most common income bracket and makes up 46.2% of all families.
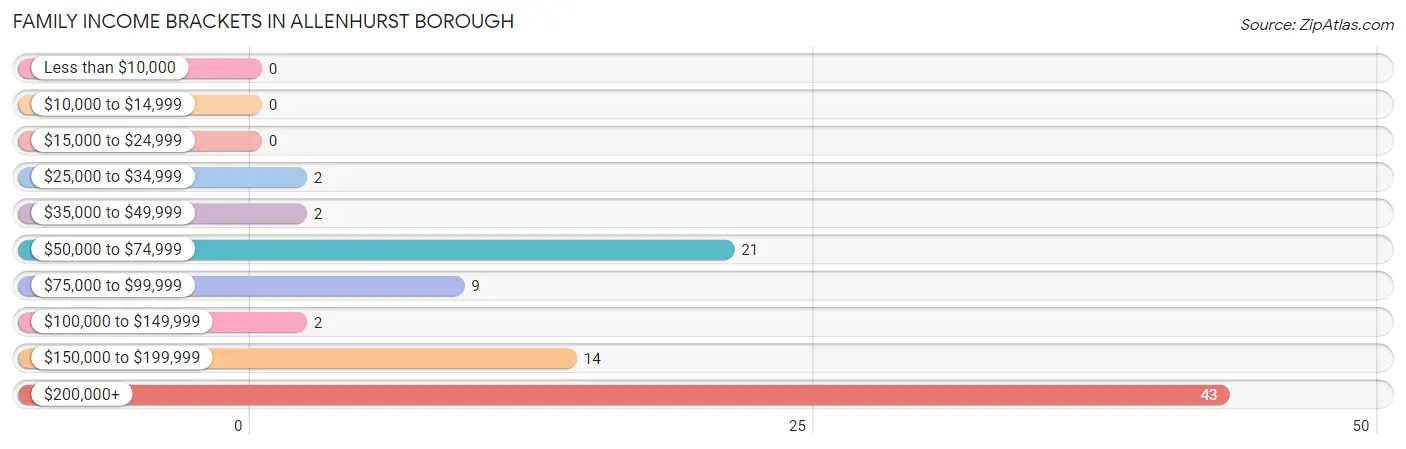
| Income Bracket | # Families | % Families |
| Less than $10,000 | 0 | 0.0% |
| $10,000 to $14,999 | 0 | 0.0% |
| $15,000 to $24,999 | 0 | 0.0% |
| $25,000 to $34,999 | 2 | 2.2% |
| $35,000 to $49,999 | 2 | 2.2% |
| $50,000 to $74,999 | 21 | 22.6% |
| $75,000 to $99,999 | 9 | 9.7% |
| $100,000 to $149,999 | 2 | 2.2% |
| $150,000 to $199,999 | 14 | 15.1% |
| $200,000+ | 43 | 46.2% |
Family Income by Famaliy Size in Allenhurst borough
3-person families (24 | 25.8%) account for the highest median family income in Allenhurst borough with $250,001 per family, while 3-person families (24 | 25.8%) have the highest median income of $83,334 per family member.
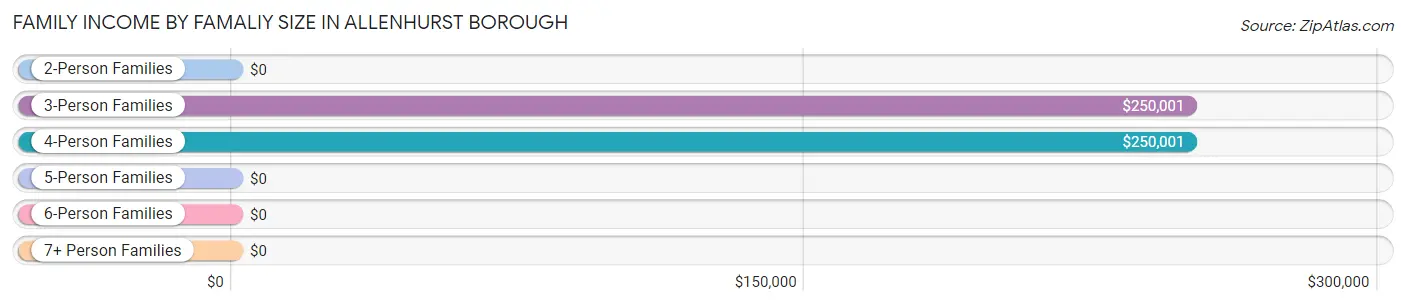
| Income Bracket | # Families | Median Income |
| 2-Person Families | 44 (47.3%) | $0 |
| 3-Person Families | 24 (25.8%) | $250,001 |
| 4-Person Families | 9 (9.7%) | $250,001 |
| 5-Person Families | 6 (6.5%) | $0 |
| 6-Person Families | 4 (4.3%) | $0 |
| 7+ Person Families | 6 (6.5%) | $0 |
| Total | 93 (100.0%) | $179,250 |
Family Income by Number of Earners in Allenhurst borough
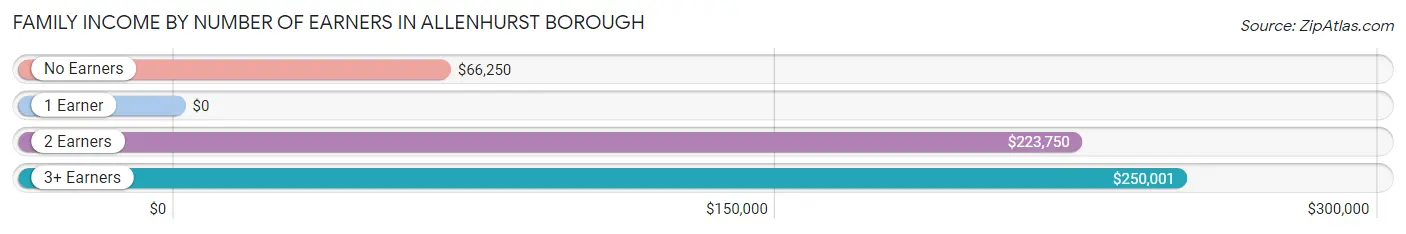
| Number of Earners | # Families | Median Income |
| No Earners | 11 (11.8%) | $66,250 |
| 1 Earner | 30 (32.3%) | $0 |
| 2 Earners | 20 (21.5%) | $223,750 |
| 3+ Earners | 32 (34.4%) | $250,001 |
| Total | 93 (100.0%) | $179,250 |
Household Income in Allenhurst borough
Household Income Brackets in Allenhurst borough
With 47 households falling in the category, the $200,000+ income range is the most frequent in Allenhurst borough, accounting for 26.9% of all households.
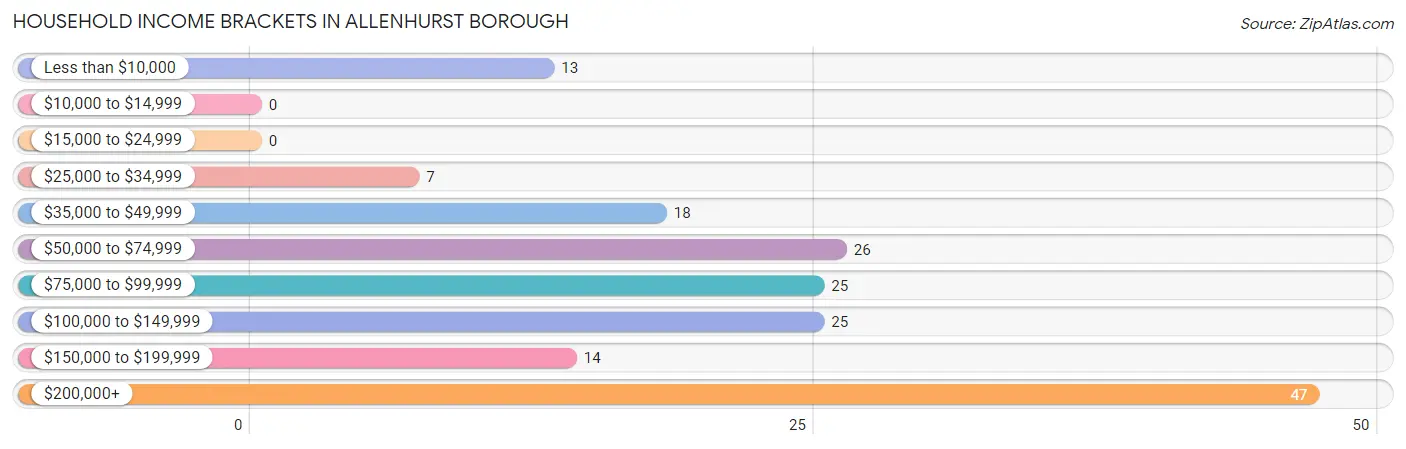
| Income Bracket | # Households | % Households |
| Less than $10,000 | 13 | 7.4% |
| $10,000 to $14,999 | 0 | 0.0% |
| $15,000 to $24,999 | 0 | 0.0% |
| $25,000 to $34,999 | 7 | 4.0% |
| $35,000 to $49,999 | 18 | 10.3% |
| $50,000 to $74,999 | 26 | 14.9% |
| $75,000 to $99,999 | 25 | 14.3% |
| $100,000 to $149,999 | 25 | 14.3% |
| $150,000 to $199,999 | 14 | 8.0% |
| $200,000+ | 47 | 26.9% |
Household Income by Householder Age in Allenhurst borough
The median household income in Allenhurst borough is $95,625, with the highest median household income of $101,786 found in the 45 to 64 years age bracket for the primary householder. A total of 98 households (56.0%) fall into this category.
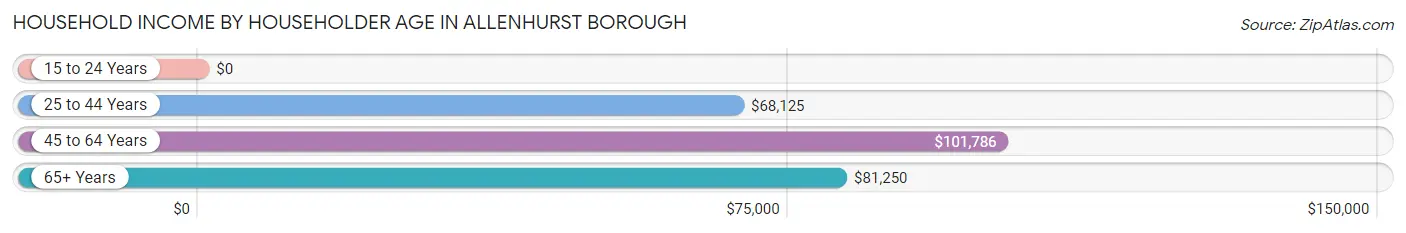
| Income Bracket | # Households | Median Income |
| 15 to 24 Years | 0 (0.0%) | $0 |
| 25 to 44 Years | 19 (10.9%) | $68,125 |
| 45 to 64 Years | 98 (56.0%) | $101,786 |
| 65+ Years | 58 (33.1%) | $81,250 |
| Total | 175 (100.0%) | $95,625 |
Poverty in Allenhurst borough
Income Below Poverty by Sex and Age in Allenhurst borough
With 5.8% poverty level for males and 1.6% for females among the residents of Allenhurst borough, 55 to 64 year old males and 35 to 44 year old females are the most vulnerable to poverty, with 8 males (21.6%) and 3 females (42.9%) in their respective age groups living below the poverty level.
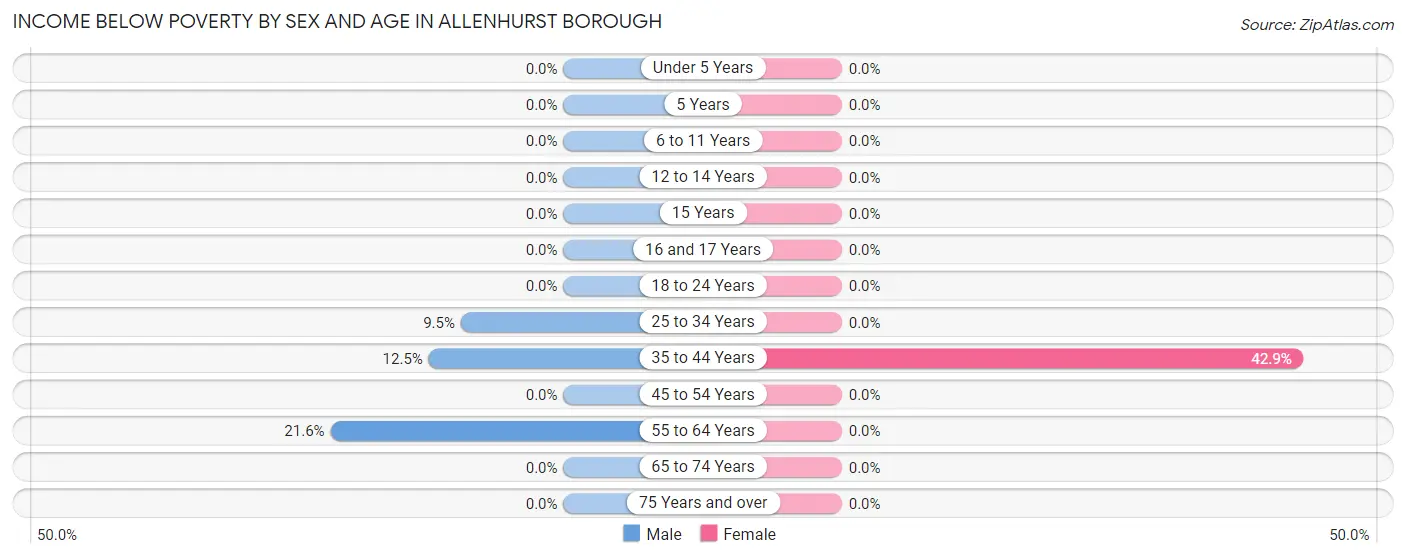
| Age Bracket | Male | Female |
| Under 5 Years | 0 (0.0%) | 0 (0.0%) |
| 5 Years | 0 (0.0%) | 0 (0.0%) |
| 6 to 11 Years | 0 (0.0%) | 0 (0.0%) |
| 12 to 14 Years | 0 (0.0%) | 0 (0.0%) |
| 15 Years | 0 (0.0%) | 0 (0.0%) |
| 16 and 17 Years | 0 (0.0%) | 0 (0.0%) |
| 18 to 24 Years | 0 (0.0%) | 0 (0.0%) |
| 25 to 34 Years | 2 (9.5%) | 0 (0.0%) |
| 35 to 44 Years | 3 (12.5%) | 3 (42.9%) |
| 45 to 54 Years | 0 (0.0%) | 0 (0.0%) |
| 55 to 64 Years | 8 (21.6%) | 0 (0.0%) |
| 65 to 74 Years | 0 (0.0%) | 0 (0.0%) |
| 75 Years and over | 0 (0.0%) | 0 (0.0%) |
| Total | 13 (5.8%) | 3 (1.6%) |
Income Above Poverty by Sex and Age in Allenhurst borough
According to the poverty statistics in Allenhurst borough, males aged under 5 years and females aged under 5 years are the age groups that are most secure financially, with 100.0% of males and 100.0% of females in these age groups living above the poverty line.
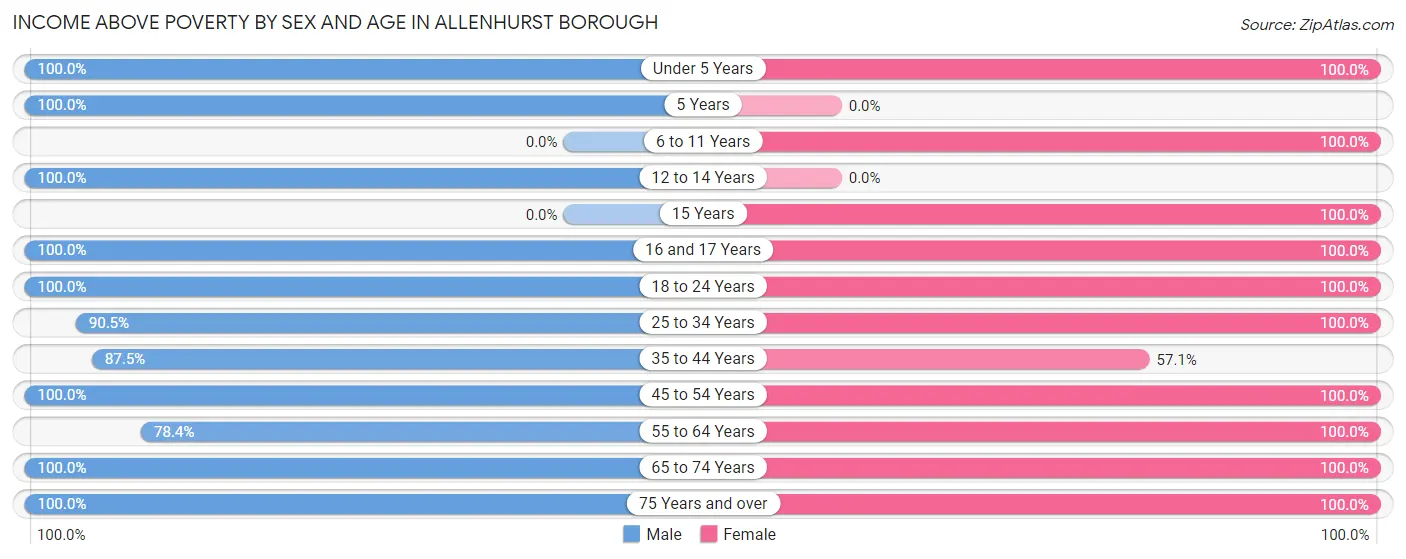
| Age Bracket | Male | Female |
| Under 5 Years | 19 (100.0%) | 2 (100.0%) |
| 5 Years | 5 (100.0%) | 0 (0.0%) |
| 6 to 11 Years | 0 (0.0%) | 5 (100.0%) |
| 12 to 14 Years | 6 (100.0%) | 0 (0.0%) |
| 15 Years | 0 (0.0%) | 1 (100.0%) |
| 16 and 17 Years | 8 (100.0%) | 4 (100.0%) |
| 18 to 24 Years | 41 (100.0%) | 4 (100.0%) |
| 25 to 34 Years | 19 (90.5%) | 36 (100.0%) |
| 35 to 44 Years | 21 (87.5%) | 4 (57.1%) |
| 45 to 54 Years | 28 (100.0%) | 16 (100.0%) |
| 55 to 64 Years | 29 (78.4%) | 53 (100.0%) |
| 65 to 74 Years | 24 (100.0%) | 36 (100.0%) |
| 75 Years and over | 13 (100.0%) | 22 (100.0%) |
| Total | 213 (94.3%) | 183 (98.4%) |
Income Below Poverty Among Married-Couple Families in Allenhurst borough
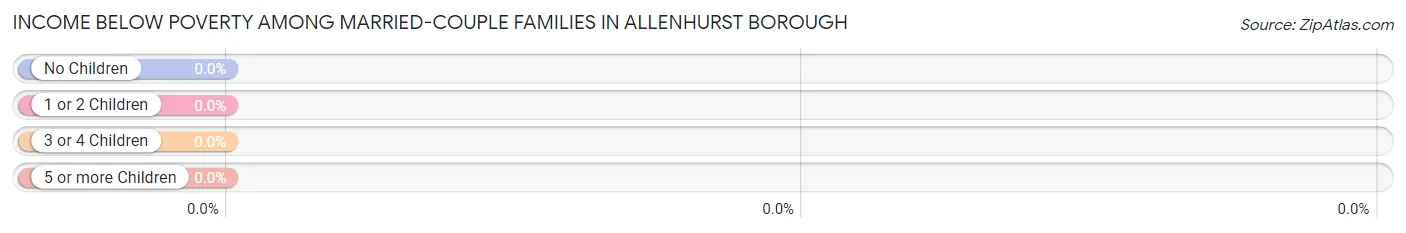
| Children | Above Poverty | Below Poverty |
| No Children | 41 (100.0%) | 0 (0.0%) |
| 1 or 2 Children | 21 (100.0%) | 0 (0.0%) |
| 3 or 4 Children | 0 (0.0%) | 0 (0.0%) |
| 5 or more Children | 0 (0.0%) | 0 (0.0%) |
| Total | 62 (100.0%) | 0 (0.0%) |
Income Below Poverty Among Single-Parent Households in Allenhurst borough
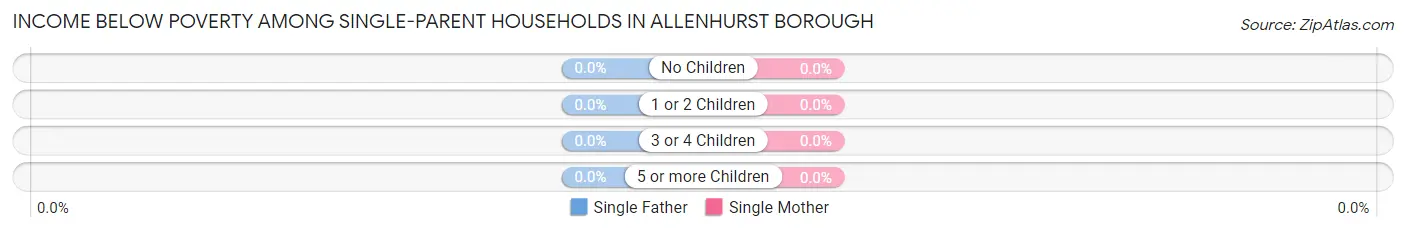
| Children | Single Father | Single Mother |
| No Children | 0 (0.0%) | 0 (0.0%) |
| 1 or 2 Children | 0 (0.0%) | 0 (0.0%) |
| 3 or 4 Children | 0 (0.0%) | 0 (0.0%) |
| 5 or more Children | 0 (0.0%) | 0 (0.0%) |
| Total | 0 (0.0%) | 0 (0.0%) |
Income Below Poverty Among Married-Couple vs Single-Parent Households in Allenhurst borough
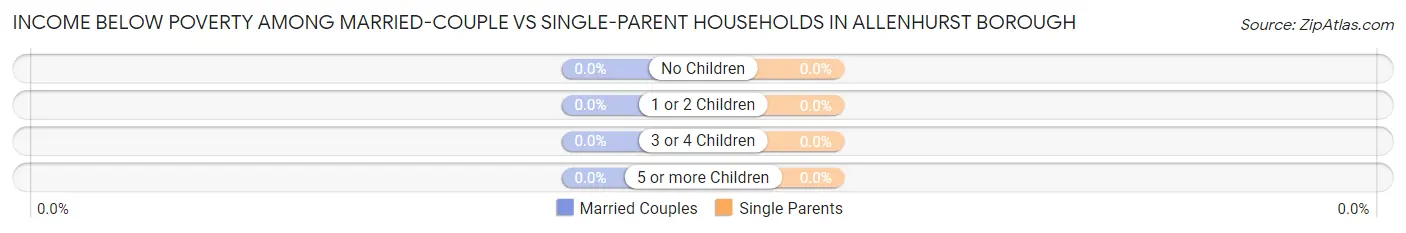
| Children | Married-Couple Families | Single-Parent Households |
| No Children | 0 (0.0%) | 0 (0.0%) |
| 1 or 2 Children | 0 (0.0%) | 0 (0.0%) |
| 3 or 4 Children | 0 (0.0%) | 0 (0.0%) |
| 5 or more Children | 0 (0.0%) | 0 (0.0%) |
| Total | 0 (0.0%) | 0 (0.0%) |
Race in Allenhurst borough
The most populous races in Allenhurst borough are White / Caucasian (344 | 83.5%), Two or more Races (61 | 14.8%), and Hispanic or Latino (35 | 8.5%).
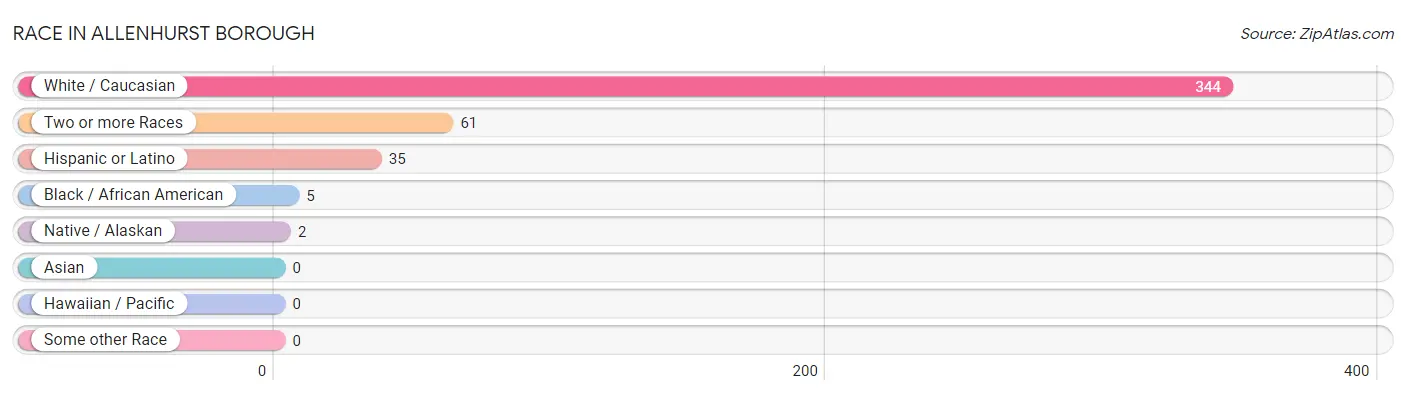
| Race | # Population | % Population |
| Asian | 0 | 0.0% |
| Black / African American | 5 | 1.2% |
| Hawaiian / Pacific | 0 | 0.0% |
| Hispanic or Latino | 35 | 8.5% |
| Native / Alaskan | 2 | 0.5% |
| White / Caucasian | 344 | 83.5% |
| Two or more Races | 61 | 14.8% |
| Some other Race | 0 | 0.0% |
| Total | 412 | 100.0% |
Ancestry in Allenhurst borough
The most populous ancestries reported in Allenhurst borough are Italian (65 | 15.8%), Irish (64 | 15.5%), English (57 | 13.8%), Scottish (43 | 10.4%), and Arab (37 | 9.0%), together accounting for 64.6% of all Allenhurst borough residents.
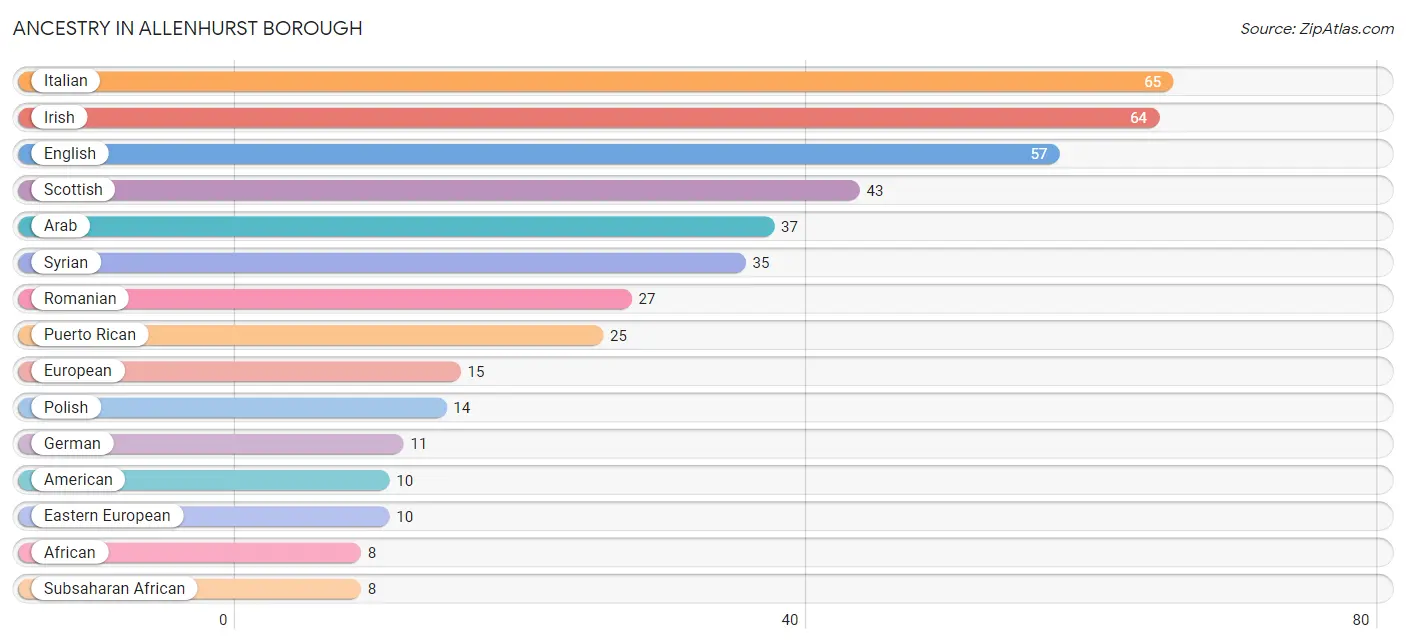
| Ancestry | # Population | % Population |
| African | 8 | 1.9% |
| American | 10 | 2.4% |
| Arab | 37 | 9.0% |
| Austrian | 3 | 0.7% |
| Blackfeet | 5 | 1.2% |
| Burmese | 2 | 0.5% |
| Chilean | 4 | 1.0% |
| Danish | 2 | 0.5% |
| Eastern European | 10 | 2.4% |
| Egyptian | 1 | 0.2% |
| English | 57 | 13.8% |
| European | 15 | 3.6% |
| French | 2 | 0.5% |
| German | 11 | 2.7% |
| Hungarian | 3 | 0.7% |
| Irish | 64 | 15.5% |
| Italian | 65 | 15.8% |
| Mexican | 3 | 0.7% |
| Northern European | 4 | 1.0% |
| Paraguayan | 2 | 0.5% |
| Polish | 14 | 3.4% |
| Portuguese | 3 | 0.7% |
| Puerto Rican | 25 | 6.1% |
| Romanian | 27 | 6.6% |
| Russian | 1 | 0.2% |
| Scottish | 43 | 10.4% |
| Serbian | 4 | 1.0% |
| South American | 7 | 1.7% |
| South American Indian | 2 | 0.5% |
| Subsaharan African | 8 | 1.9% |
| Swedish | 2 | 0.5% |
| Swiss | 2 | 0.5% |
| Syrian | 35 | 8.5% |
| Venezuelan | 1 | 0.2% | View All 34 Rows |
Immigrants in Allenhurst borough
The most numerous immigrant groups reported in Allenhurst borough came from Europe (37 | 9.0%), Eastern Europe (29 | 7.0%), Romania (27 | 6.6%), England (4 | 1.0%), and Northern Europe (4 | 1.0%), together accounting for 24.5% of all Allenhurst borough residents.
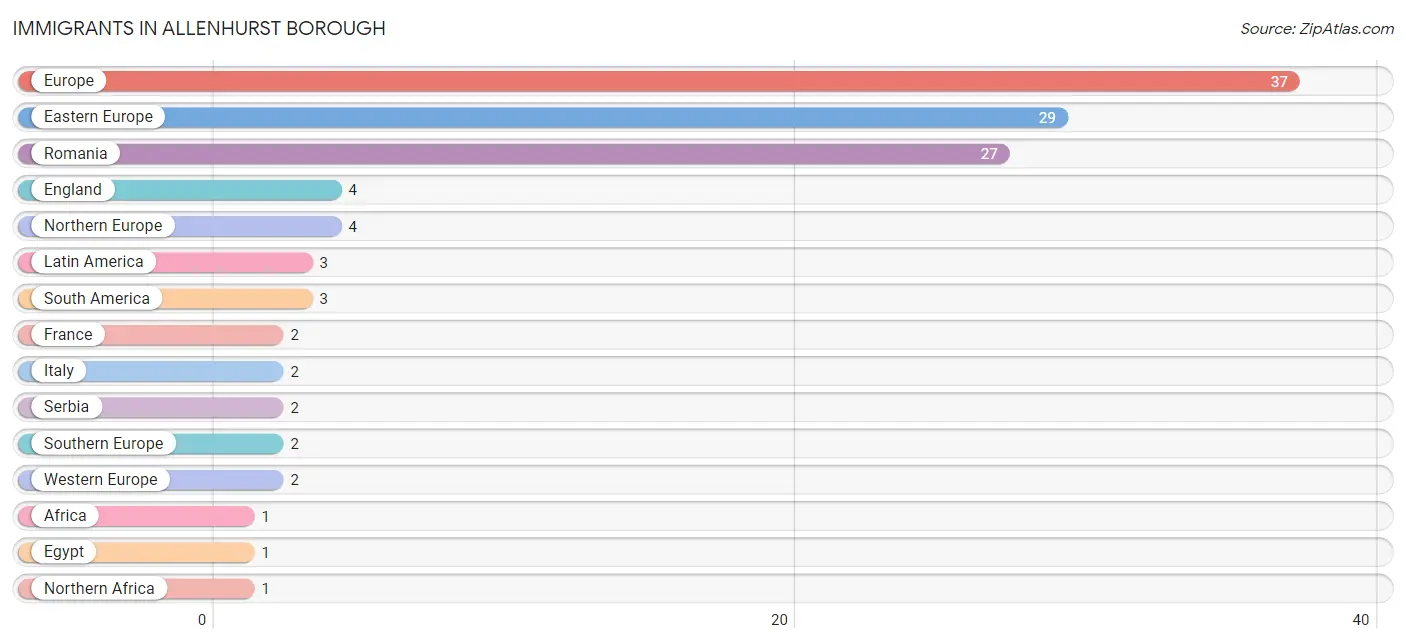
| Immigration Origin | # Population | % Population |
| Africa | 1 | 0.2% |
| Eastern Europe | 29 | 7.0% |
| Egypt | 1 | 0.2% |
| England | 4 | 1.0% |
| Europe | 37 | 9.0% |
| France | 2 | 0.5% |
| Italy | 2 | 0.5% |
| Latin America | 3 | 0.7% |
| Northern Africa | 1 | 0.2% |
| Northern Europe | 4 | 1.0% |
| Romania | 27 | 6.6% |
| Serbia | 2 | 0.5% |
| South America | 3 | 0.7% |
| Southern Europe | 2 | 0.5% |
| Venezuela | 1 | 0.2% |
| Western Europe | 2 | 0.5% | View All 16 Rows |
Sex and Age in Allenhurst borough
Sex and Age in Allenhurst borough
The most populous age groups in Allenhurst borough are 20 to 24 Years (30 | 13.3%) for men and 55 to 59 Years (33 | 17.7%) for women.
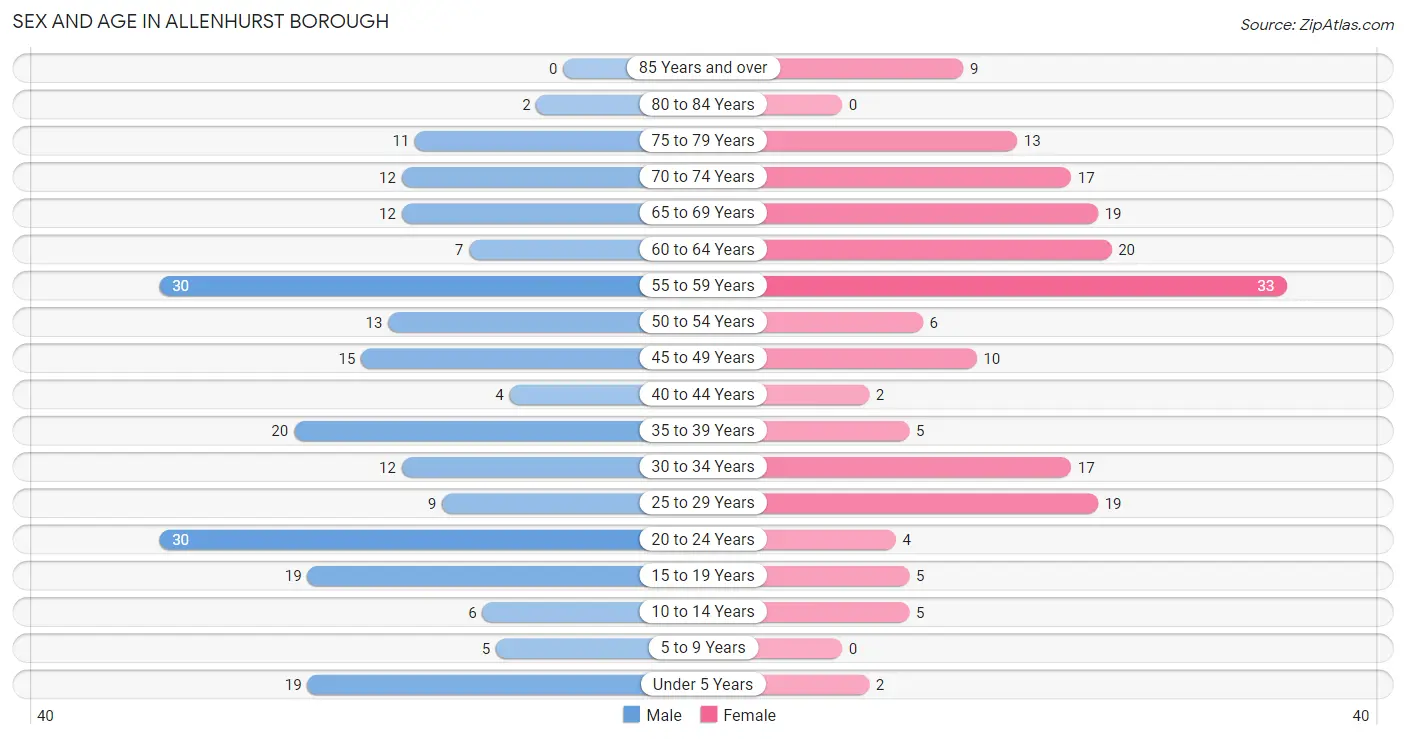
| Age Bracket | Male | Female |
| Under 5 Years | 19 (8.4%) | 2 (1.1%) |
| 5 to 9 Years | 5 (2.2%) | 0 (0.0%) |
| 10 to 14 Years | 6 (2.6%) | 5 (2.7%) |
| 15 to 19 Years | 19 (8.4%) | 5 (2.7%) |
| 20 to 24 Years | 30 (13.3%) | 4 (2.1%) |
| 25 to 29 Years | 9 (4.0%) | 19 (10.2%) |
| 30 to 34 Years | 12 (5.3%) | 17 (9.1%) |
| 35 to 39 Years | 20 (8.8%) | 5 (2.7%) |
| 40 to 44 Years | 4 (1.8%) | 2 (1.1%) |
| 45 to 49 Years | 15 (6.6%) | 10 (5.4%) |
| 50 to 54 Years | 13 (5.8%) | 6 (3.2%) |
| 55 to 59 Years | 30 (13.3%) | 33 (17.7%) |
| 60 to 64 Years | 7 (3.1%) | 20 (10.7%) |
| 65 to 69 Years | 12 (5.3%) | 19 (10.2%) |
| 70 to 74 Years | 12 (5.3%) | 17 (9.1%) |
| 75 to 79 Years | 11 (4.9%) | 13 (7.0%) |
| 80 to 84 Years | 2 (0.9%) | 0 (0.0%) |
| 85 Years and over | 0 (0.0%) | 9 (4.8%) |
| Total | 226 (100.0%) | 186 (100.0%) |
Families and Households in Allenhurst borough
Median Family Size in Allenhurst borough
The median family size in Allenhurst borough is 3.31 persons per family, with married-couple families (62 | 66.7%) accounting for the largest median family size of 3.42 persons per family. On the other hand, single male/father families (4 | 4.3%) represent the smallest median family size with 2.00 persons per family.
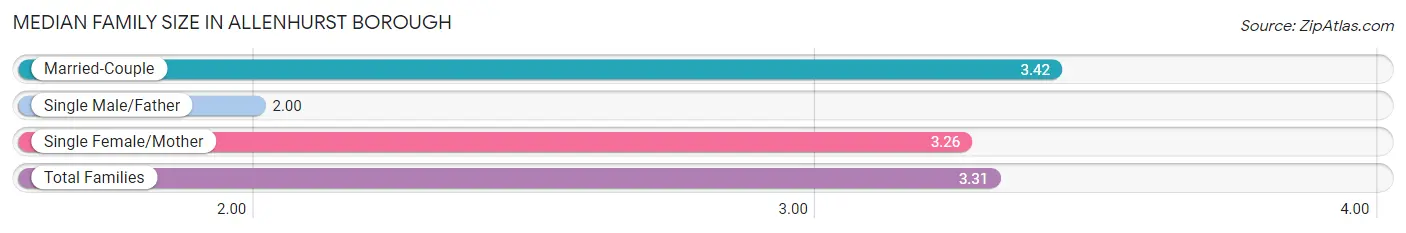
| Family Type | # Families | Family Size |
| Married-Couple | 62 (66.7%) | 3.42 |
| Single Male/Father | 4 (4.3%) | 2.00 |
| Single Female/Mother | 27 (29.0%) | 3.26 |
| Total Families | 93 (100.0%) | 3.31 |
Median Household Size in Allenhurst borough
The median household size in Allenhurst borough is 2.35 persons per household, with single female/mother households (27 | 15.4%) accounting for the largest median household size of 3.81 persons per household. non-family households (82 | 46.9%) represent the smallest median household size with 1.09 persons per household.
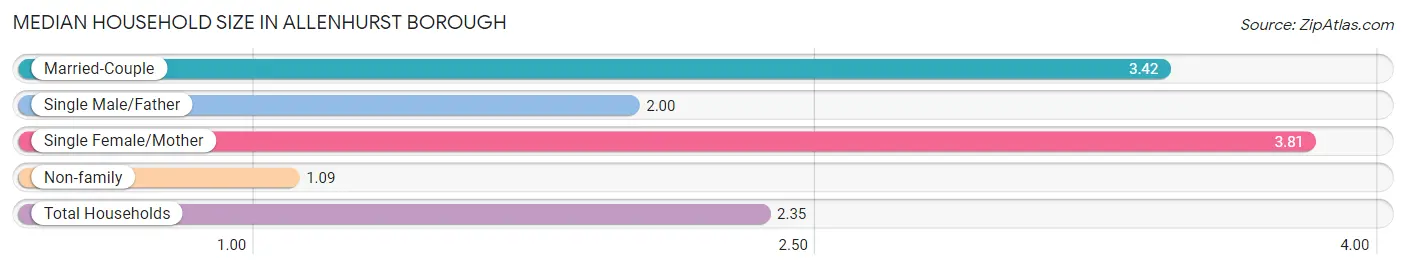
| Household Type | # Households | Household Size |
| Married-Couple | 62 (35.4%) | 3.42 |
| Single Male/Father | 4 (2.3%) | 2.00 |
| Single Female/Mother | 27 (15.4%) | 3.81 |
| Non-family | 82 (46.9%) | 1.09 |
| Total Households | 175 (100.0%) | 2.35 |
Household Size by Marriage Status in Allenhurst borough
Out of a total of 175 households in Allenhurst borough, 93 (53.1%) are family households, while 82 (46.9%) are nonfamily households. The most numerous type of family households are 3-person households, comprising 38, and the most common type of nonfamily households are 1-person households, comprising 73.
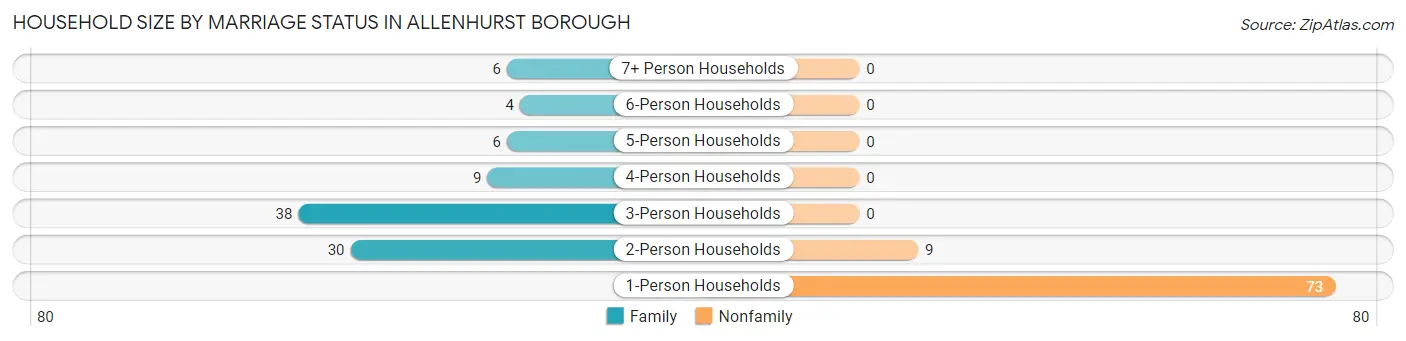
| Household Size | Family Households | Nonfamily Households |
| 1-Person Households | - | 73 (41.7%) |
| 2-Person Households | 30 (17.1%) | 9 (5.1%) |
| 3-Person Households | 38 (21.7%) | 0 (0.0%) |
| 4-Person Households | 9 (5.1%) | 0 (0.0%) |
| 5-Person Households | 6 (3.4%) | 0 (0.0%) |
| 6-Person Households | 4 (2.3%) | 0 (0.0%) |
| 7+ Person Households | 6 (3.4%) | 0 (0.0%) |
| Total | 93 (53.1%) | 82 (46.9%) |
Female Fertility in Allenhurst borough
Fertility by Age in Allenhurst borough
Average fertility rate in Allenhurst borough is 48.0 births per 1,000 women. Women in the age bracket of 20 to 34 years have the highest fertility rate with 75.0 births per 1,000 women. Women in the age bracket of 20 to 34 years acount for 100.0% of all women with births.
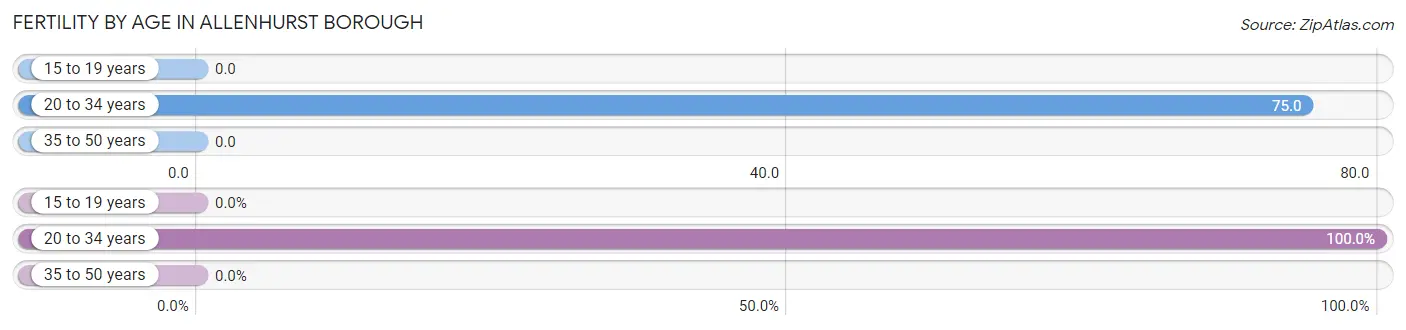
| Age Bracket | Women with Births | Births / 1,000 Women |
| 15 to 19 years | 0 (0.0%) | 0.0 |
| 20 to 34 years | 3 (100.0%) | 75.0 |
| 35 to 50 years | 0 (0.0%) | 0.0 |
| Total | 3 (100.0%) | 48.0 |
Fertility by Age by Marriage Status in Allenhurst borough
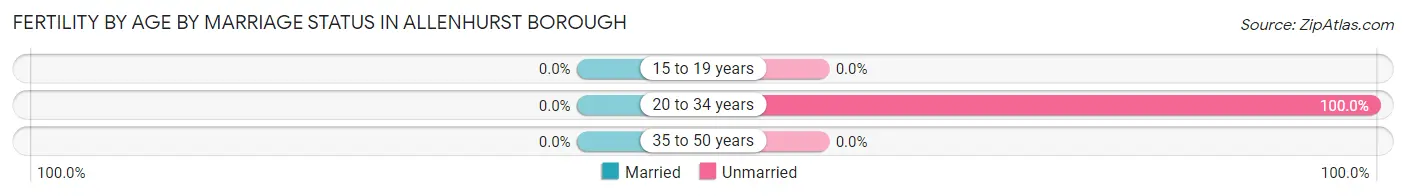
| Age Bracket | Married | Unmarried |
| 15 to 19 years | 0 (0.0%) | 0 (0.0%) |
| 20 to 34 years | 0 (0.0%) | 3 (100.0%) |
| 35 to 50 years | 0 (0.0%) | 0 (0.0%) |
| Total | 0 (0.0%) | 3 (100.0%) |
Fertility by Education in Allenhurst borough
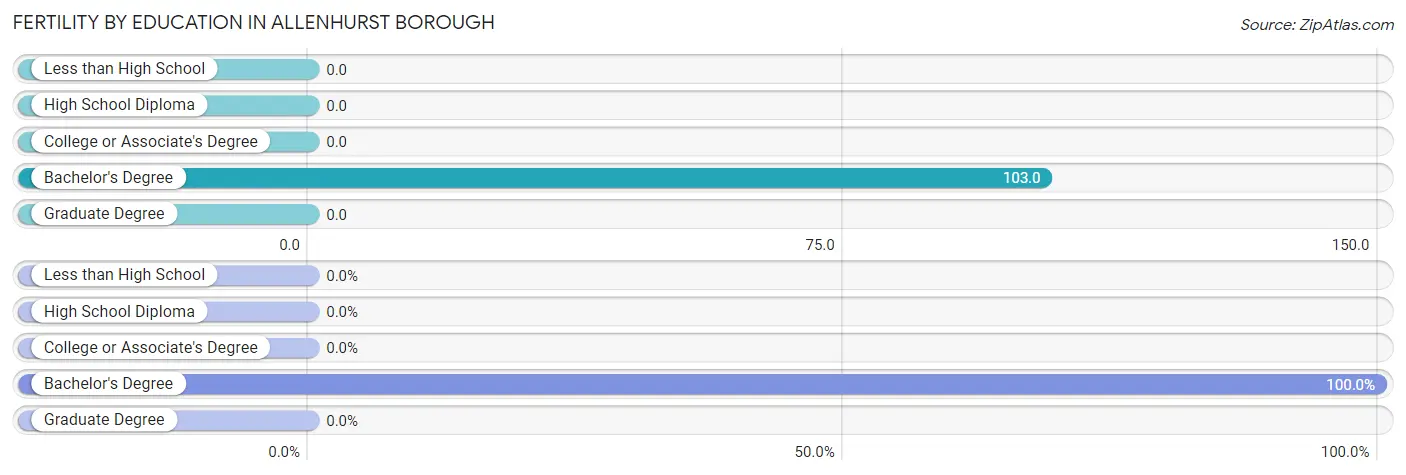
| Educational Attainment | Women with Births | Births / 1,000 Women |
| Less than High School | 0 (0.0%) | 0.0 |
| High School Diploma | 0 (0.0%) | 0.0 |
| College or Associate's Degree | 0 (0.0%) | 0.0 |
| Bachelor's Degree | 3 (100.0%) | 103.0 |
| Graduate Degree | 0 (0.0%) | 0.0 |
| Total | 3 (100.0%) | 48.0 |
Fertility by Education by Marriage Status in Allenhurst borough
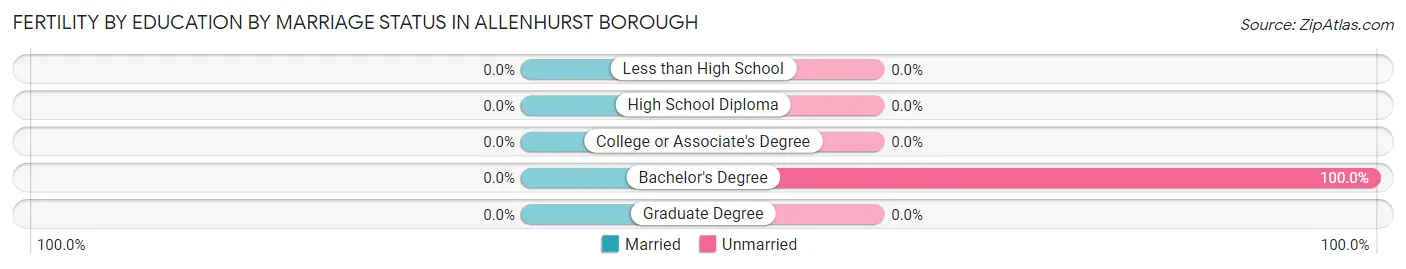
| Educational Attainment | Married | Unmarried |
| Less than High School | 0 (0.0%) | 0 (0.0%) |
| High School Diploma | 0 (0.0%) | 0 (0.0%) |
| College or Associate's Degree | 0 (0.0%) | 0 (0.0%) |
| Bachelor's Degree | 0 (0.0%) | 3 (100.0%) |
| Graduate Degree | 0 (0.0%) | 0 (0.0%) |
| Total | 0 (0.0%) | 3 (100.0%) |
Employment Characteristics in Allenhurst borough
Employment by Class of Employer in Allenhurst borough
Among the 225 employed individuals in Allenhurst borough, private company employees (119 | 52.9%), self-employed (incorporated) (37 | 16.4%), and not-for-profit organizations (32 | 14.2%) make up the most common classes of employment.
| Employer Class | # Employees | % Employees |
| Private Company Employees | 119 | 52.9% |
| Self-Employed (Incorporated) | 37 | 16.4% |
| Self-Employed (Not Incorporated) | 27 | 12.0% |
| Not-for-profit Organizations | 32 | 14.2% |
| Local Government Employees | 2 | 0.9% |
| State Government Employees | 8 | 3.6% |
| Federal Government Employees | 0 | 0.0% |
| Unpaid Family Workers | 0 | 0.0% |
| Total | 225 | 100.0% |
Employment Status by Age in Allenhurst borough
According to the labor force statistics for Allenhurst borough, out of the total population over 16 years of age (374), 68.7% or 257 individuals are in the labor force, with 10.9% or 28 of them unemployed. The age group with the highest labor force participation rate is 30 to 34 years, with 100.0% or 29 individuals in the labor force. Within the labor force, the 55 to 59 years age range has the highest percentage of unemployed individuals, with 41.5% or 22 of them being unemployed.
| Age Bracket | In Labor Force | Unemployed |
| 16 to 19 Years | 0 (0.0%) | 0 (0.0%) |
| 20 to 24 Years | 17 (50.0%) | 0 (0.0%) |
| 25 to 29 Years | 23 (82.1%) | 1 (4.3%) |
| 30 to 34 Years | 29 (100.0%) | 2 (6.9%) |
| 35 to 44 Years | 28 (90.3%) | 0 (0.0%) |
| 45 to 54 Years | 41 (93.2%) | 0 (0.0%) |
| 55 to 59 Years | 53 (84.1%) | 22 (41.5%) |
| 60 to 64 Years | 18 (66.7%) | 0 (0.0%) |
| 65 to 74 Years | 33 (55.0%) | 3 (9.1%) |
| 75 Years and over | 15 (42.9%) | 0 (0.0%) |
| Total | 257 (68.7%) | 28 (10.9%) |
Employment Status by Educational Attainment in Allenhurst borough
According to labor force statistics for Allenhurst borough, 86.5% of individuals (192) out of the total population between 25 and 64 years of age (222) are in the labor force, with 13.0% or 25 of them being unemployed. The group with the highest labor force participation rate are those with the educational attainment of bachelor's degree or higher, with 89.4% or 118 individuals in the labor force. Within the labor force, individuals with bachelor's degree or higher education have the highest percentage of unemployment, with 19.5% or 23 of them being unemployed.
| Educational Attainment | In Labor Force | Unemployed |
| Less than High School | 0 (0.0%) | 0 (0.0%) |
| High School Diploma | 28 (87.5%) | 0 (0.0%) |
| College / Associate Degree | 46 (86.8%) | 2 (4.3%) |
| Bachelor's Degree or higher | 118 (89.4%) | 26 (19.5%) |
| Total | 192 (86.5%) | 29 (13.0%) |
Employment Occupations by Sex in Allenhurst borough
Management, Business, Science and Arts Occupations
The most common Management, Business, Science and Arts occupations in Allenhurst borough are Health Diagnosing & Treating (35 | 15.3%), Management (33 | 14.4%), Health Technologists (32 | 14.0%), Business & Financial (25 | 10.9%), and Community & Social Service (25 | 10.9%).
Management, Business, Science and Arts Occupations by Sex
Within the Management, Business, Science and Arts occupations in Allenhurst borough, the most male-oriented occupations are Legal Services & Support (100.0%), Computers & Mathematics (85.7%), and Health Technologists (71.9%), while the most female-oriented occupations are Arts, Media & Entertainment (100.0%), Management (97.0%), and Education Instruction & Library (75.0%).
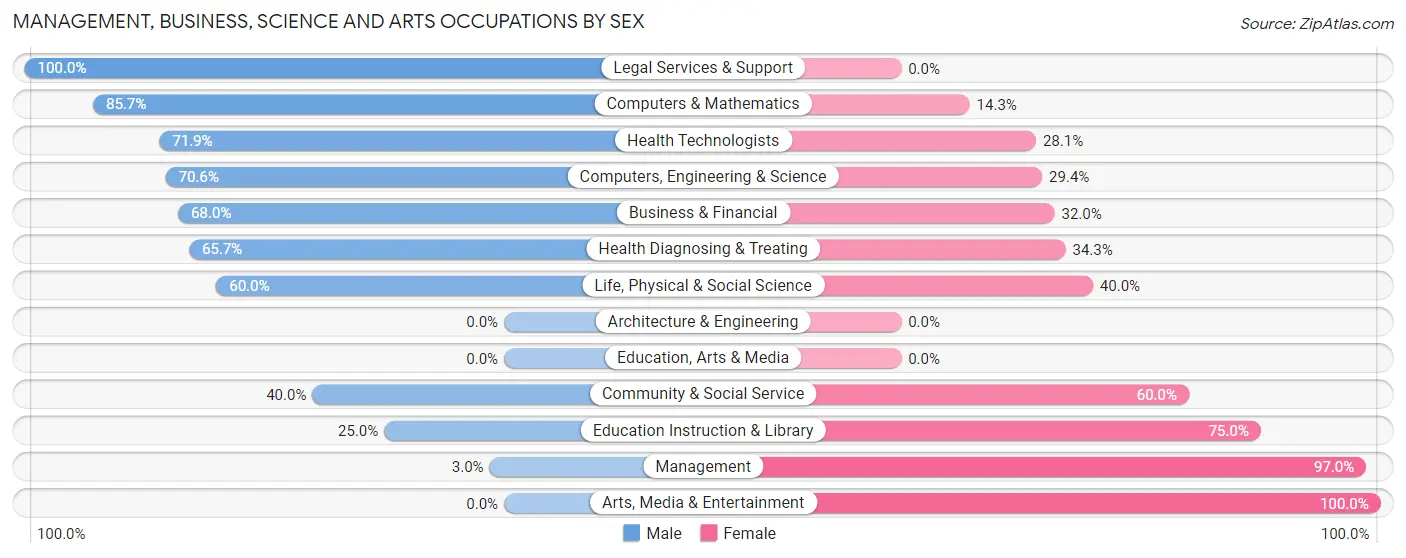
| Occupation | Male | Female |
| Management | 1 (3.0%) | 32 (97.0%) |
| Business & Financial | 17 (68.0%) | 8 (32.0%) |
| Computers, Engineering & Science | 12 (70.6%) | 5 (29.4%) |
| Computers & Mathematics | 6 (85.7%) | 1 (14.3%) |
| Architecture & Engineering | 0 (0.0%) | 0 (0.0%) |
| Life, Physical & Social Science | 6 (60.0%) | 4 (40.0%) |
| Community & Social Service | 10 (40.0%) | 15 (60.0%) |
| Education, Arts & Media | 0 (0.0%) | 0 (0.0%) |
| Legal Services & Support | 8 (100.0%) | 0 (0.0%) |
| Education Instruction & Library | 2 (25.0%) | 6 (75.0%) |
| Arts, Media & Entertainment | 0 (0.0%) | 9 (100.0%) |
| Health Diagnosing & Treating | 23 (65.7%) | 12 (34.3%) |
| Health Technologists | 23 (71.9%) | 9 (28.1%) |
| Total (Category) | 63 (46.7%) | 72 (53.3%) |
| Total (Overall) | 137 (59.8%) | 92 (40.2%) |
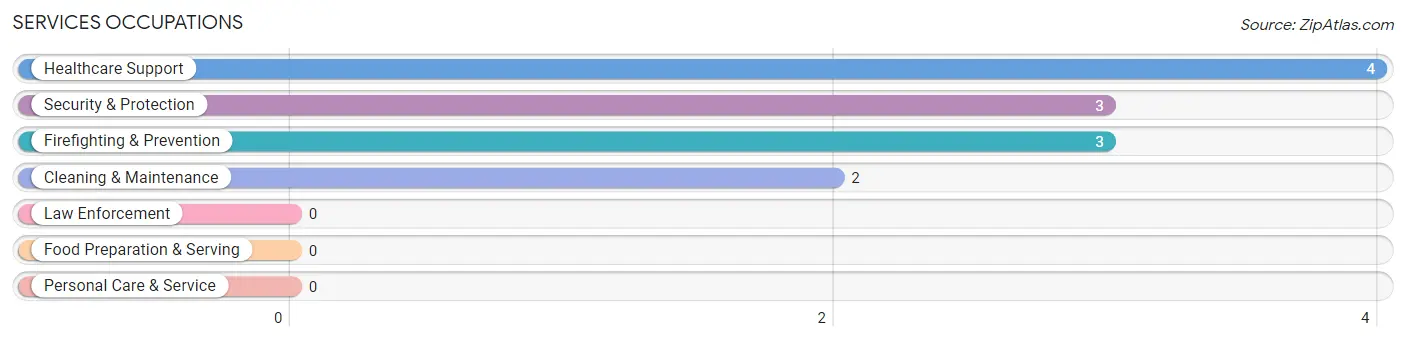
Services Occupations
The most common Services occupations in Allenhurst borough are Healthcare Support (4 | 1.8%), Security & Protection (3 | 1.3%), Firefighting & Prevention (3 | 1.3%), and Cleaning & Maintenance (2 | 0.9%).
Services Occupations by Sex
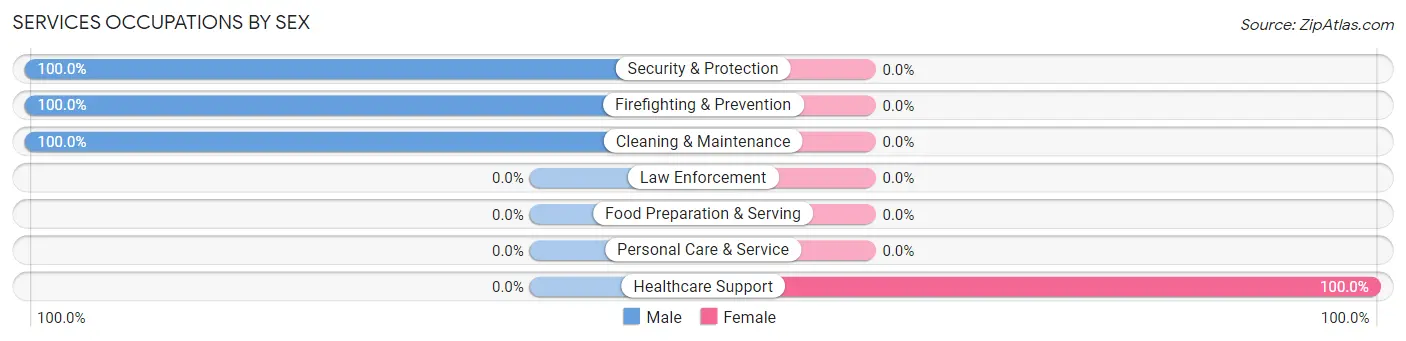
| Occupation | Male | Female |
| Healthcare Support | 0 (0.0%) | 4 (100.0%) |
| Security & Protection | 3 (100.0%) | 0 (0.0%) |
| Firefighting & Prevention | 3 (100.0%) | 0 (0.0%) |
| Law Enforcement | 0 (0.0%) | 0 (0.0%) |
| Food Preparation & Serving | 0 (0.0%) | 0 (0.0%) |
| Cleaning & Maintenance | 2 (100.0%) | 0 (0.0%) |
| Personal Care & Service | 0 (0.0%) | 0 (0.0%) |
| Total (Category) | 5 (55.6%) | 4 (44.4%) |
| Total (Overall) | 137 (59.8%) | 92 (40.2%) |
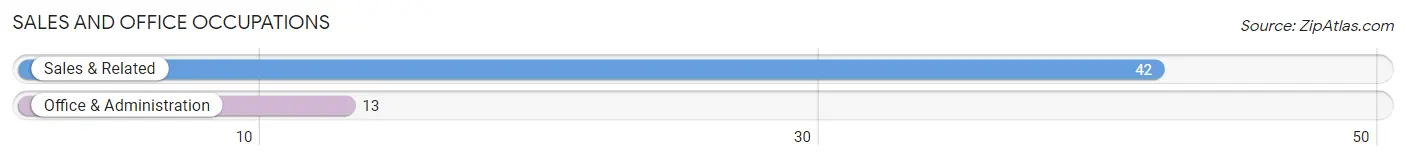
Sales and Office Occupations
The most common Sales and Office occupations in Allenhurst borough are Sales & Related (42 | 18.3%), and Office & Administration (13 | 5.7%).
Sales and Office Occupations by Sex
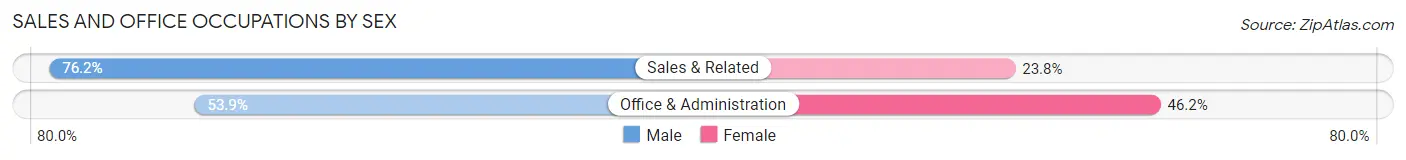
| Occupation | Male | Female |
| Sales & Related | 32 (76.2%) | 10 (23.8%) |
| Office & Administration | 7 (53.8%) | 6 (46.2%) |
| Total (Category) | 39 (70.9%) | 16 (29.1%) |
| Total (Overall) | 137 (59.8%) | 92 (40.2%) |
Natural Resources, Construction and Maintenance Occupations
The most common Natural Resources, Construction and Maintenance occupations in Allenhurst borough are , and Construction & Extraction (4 | 1.8%).
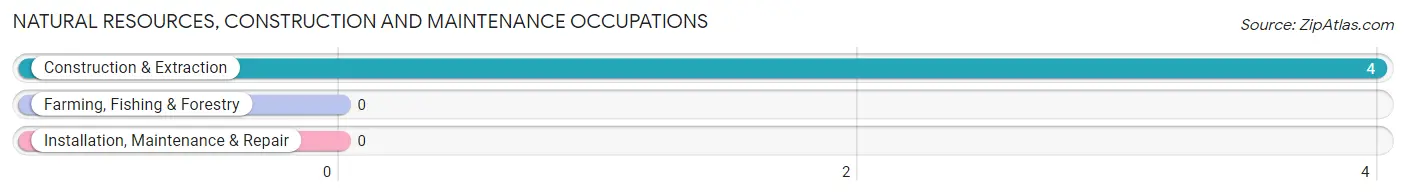
Natural Resources, Construction and Maintenance Occupations by Sex
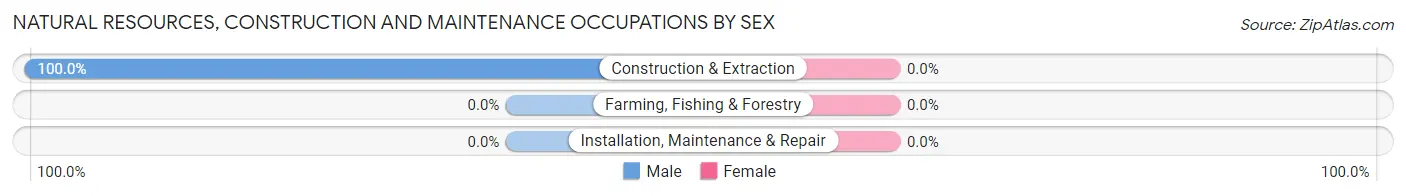
| Occupation | Male | Female |
| Farming, Fishing & Forestry | 0 (0.0%) | 0 (0.0%) |
| Construction & Extraction | 4 (100.0%) | 0 (0.0%) |
| Installation, Maintenance & Repair | 0 (0.0%) | 0 (0.0%) |
| Total (Category) | 4 (100.0%) | 0 (0.0%) |
| Total (Overall) | 137 (59.8%) | 92 (40.2%) |
Production, Transportation and Moving Occupations
The most common Production, Transportation and Moving occupations in Allenhurst borough are Material Moving (17 | 7.4%), Transportation (6 | 2.6%), and Production (3 | 1.3%).
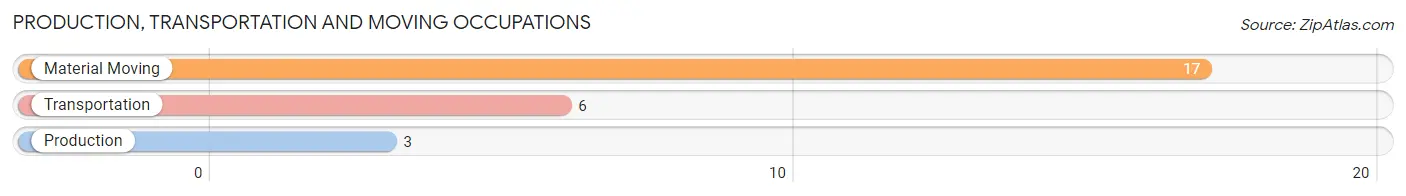
Production, Transportation and Moving Occupations by Sex
| Occupation | Male | Female |
| Production | 3 (100.0%) | 0 (0.0%) |
| Transportation | 6 (100.0%) | 0 (0.0%) |
| Material Moving | 17 (100.0%) | 0 (0.0%) |
| Total (Category) | 26 (100.0%) | 0 (0.0%) |
| Total (Overall) | 137 (59.8%) | 92 (40.2%) |
Employment Industries by Sex in Allenhurst borough
Employment Industries in Allenhurst borough
The major employment industries in Allenhurst borough include Professional & Scientific (49 | 21.4%), Health Care & Social Assistance (46 | 20.1%), Retail Trade (35 | 15.3%), Wholesale Trade (21 | 9.2%), and Administrative & Support (18 | 7.9%).
Employment Industries by Sex in Allenhurst borough
The Allenhurst borough industries that see more men than women are Manufacturing (100.0%), Transportation & Warehousing (100.0%), and Finance & Insurance (100.0%), whereas the industries that tend to have a higher number of women are Public Administration (100.0%), Administrative & Support (83.3%), and Information (75.0%).
| Industry | Male | Female |
| Agriculture, Fishing & Hunting | 0 (0.0%) | 0 (0.0%) |
| Mining, Quarrying, & Extraction | 0 (0.0%) | 0 (0.0%) |
| Construction | 6 (60.0%) | 4 (40.0%) |
| Manufacturing | 4 (100.0%) | 0 (0.0%) |
| Wholesale Trade | 19 (90.5%) | 2 (9.5%) |
| Retail Trade | 30 (85.7%) | 5 (14.3%) |
| Transportation & Warehousing | 10 (100.0%) | 0 (0.0%) |
| Utilities | 0 (0.0%) | 0 (0.0%) |
| Information | 2 (25.0%) | 6 (75.0%) |
| Finance & Insurance | 9 (100.0%) | 0 (0.0%) |
| Real Estate, Rental & Leasing | 4 (100.0%) | 0 (0.0%) |
| Professional & Scientific | 20 (40.8%) | 29 (59.2%) |
| Enterprise Management | 0 (0.0%) | 0 (0.0%) |
| Administrative & Support | 3 (16.7%) | 15 (83.3%) |
| Educational Services | 2 (25.0%) | 6 (75.0%) |
| Health Care & Social Assistance | 25 (54.3%) | 21 (45.7%) |
| Arts, Entertainment & Recreation | 0 (0.0%) | 0 (0.0%) |
| Accommodation & Food Services | 3 (100.0%) | 0 (0.0%) |
| Public Administration | 0 (0.0%) | 2 (100.0%) |
| Total | 137 (59.8%) | 92 (40.2%) |
Education in Allenhurst borough
School Enrollment in Allenhurst borough
The most common levels of schooling among the 77 students in Allenhurst borough are college / undergraduate (34 | 44.2%), high school (20 | 26.0%), and middle school (11 | 14.3%).
| School Level | # Students | % Students |
| Nursery / Preschool | 5 | 6.5% |
| Kindergarten | 0 | 0.0% |
| Elementary School | 0 | 0.0% |
| Middle School | 11 | 14.3% |
| High School | 20 | 26.0% |
| College / Undergraduate | 34 | 44.2% |
| Graduate / Professional | 7 | 9.1% |
| Total | 77 | 100.0% |
School Enrollment by Age by Funding Source in Allenhurst borough
Out of a total of 77 students who are enrolled in schools in Allenhurst borough, 30 (39.0%) attend a private institution, while the remaining 47 (61.0%) are enrolled in public schools. The age group of 5 to 9 year old has the highest likelihood of being enrolled in private schools, with 5 (100.0% in the age bracket) enrolled. Conversely, the age group of 10 to 14 year olds has the lowest likelihood of being enrolled in a private school, with 11 (100.0% in the age bracket) attending a public institution.
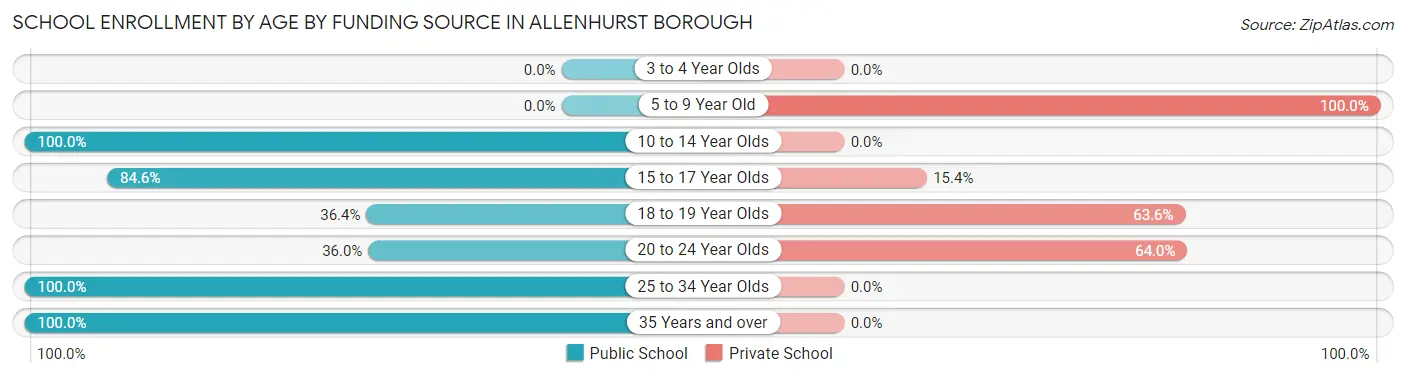
| Age Bracket | Public School | Private School |
| 3 to 4 Year Olds | 0 (0.0%) | 0 (0.0%) |
| 5 to 9 Year Old | 0 (0.0%) | 5 (100.0%) |
| 10 to 14 Year Olds | 11 (100.0%) | 0 (0.0%) |
| 15 to 17 Year Olds | 11 (84.6%) | 2 (15.4%) |
| 18 to 19 Year Olds | 4 (36.4%) | 7 (63.6%) |
| 20 to 24 Year Olds | 9 (36.0%) | 16 (64.0%) |
| 25 to 34 Year Olds | 6 (100.0%) | 0 (0.0%) |
| 35 Years and over | 6 (100.0%) | 0 (0.0%) |
| Total | 47 (61.0%) | 30 (39.0%) |
Educational Attainment by Field of Study in Allenhurst borough
Education (45 | 21.4%), business (41 | 19.5%), social sciences (27 | 12.9%), engineering (23 | 11.0%), and liberal arts & history (20 | 9.5%) are the most common fields of study among 210 individuals in Allenhurst borough who have obtained a bachelor's degree or higher.
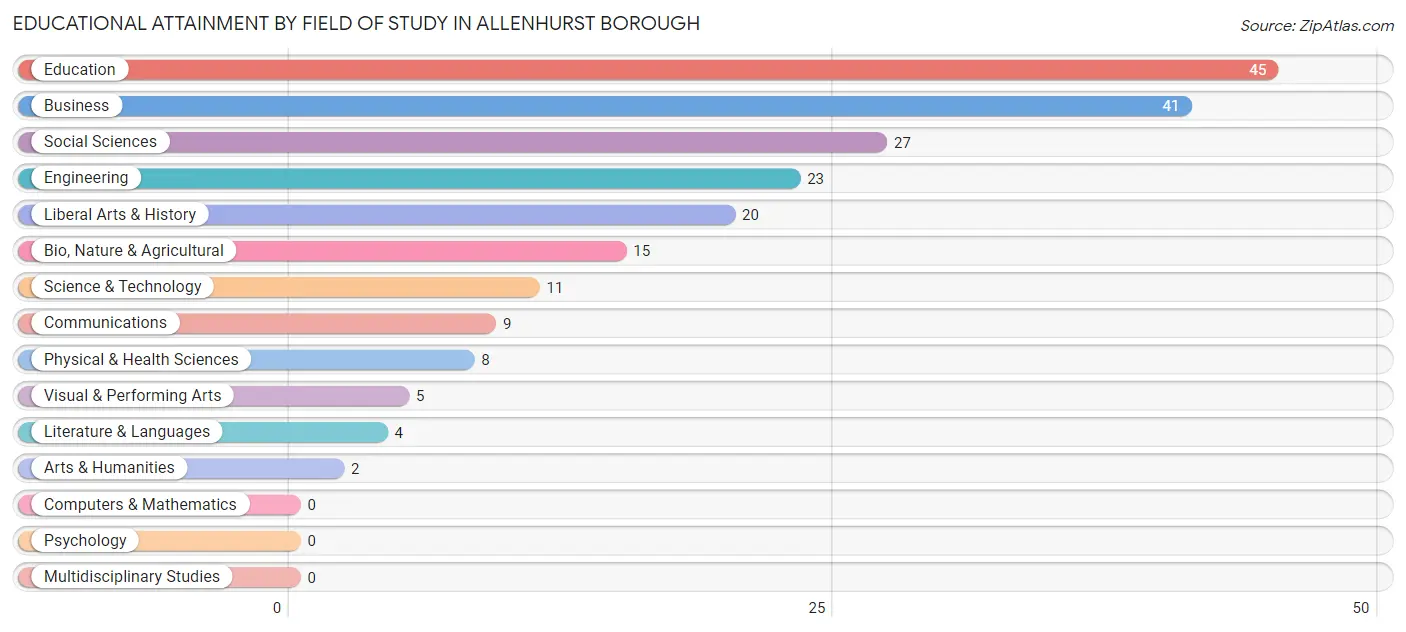
| Field of Study | # Graduates | % Graduates |
| Computers & Mathematics | 0 | 0.0% |
| Bio, Nature & Agricultural | 15 | 7.1% |
| Physical & Health Sciences | 8 | 3.8% |
| Psychology | 0 | 0.0% |
| Social Sciences | 27 | 12.9% |
| Engineering | 23 | 11.0% |
| Multidisciplinary Studies | 0 | 0.0% |
| Science & Technology | 11 | 5.2% |
| Business | 41 | 19.5% |
| Education | 45 | 21.4% |
| Literature & Languages | 4 | 1.9% |
| Liberal Arts & History | 20 | 9.5% |
| Visual & Performing Arts | 5 | 2.4% |
| Communications | 9 | 4.3% |
| Arts & Humanities | 2 | 0.9% |
| Total | 210 | 100.0% |
Transportation & Commute in Allenhurst borough
Vehicle Availability by Sex in Allenhurst borough
The most prevalent vehicle ownership categories in Allenhurst borough are males with 2 vehicles (50, accounting for 36.5%) and females with 2 vehicles (33, making up 56.8%).
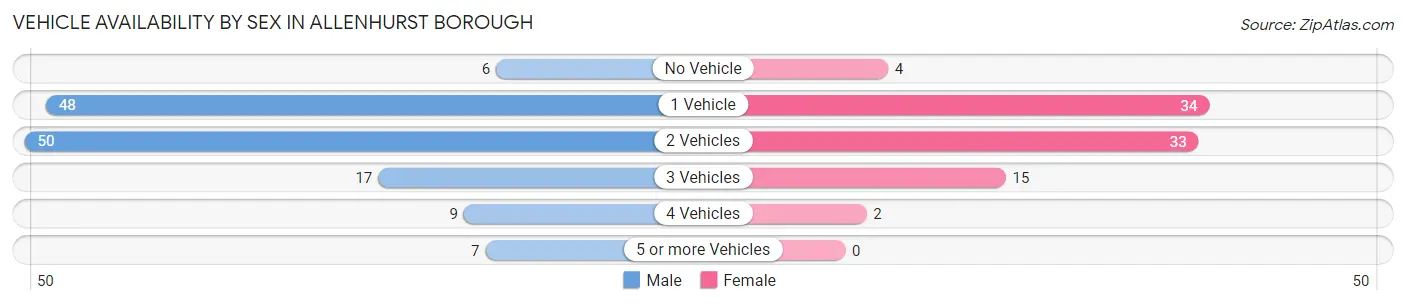
| Vehicles Available | Male | Female |
| No Vehicle | 6 (4.4%) | 4 (4.5%) |
| 1 Vehicle | 48 (35.0%) | 34 (38.6%) |
| 2 Vehicles | 50 (36.5%) | 33 (37.5%) |
| 3 Vehicles | 17 (12.4%) | 15 (17.1%) |
| 4 Vehicles | 9 (6.6%) | 2 (2.3%) |
| 5 or more Vehicles | 7 (5.1%) | 0 (0.0%) |
| Total | 137 (100.0%) | 88 (100.0%) |
Commute Time in Allenhurst borough
The most frequently occuring commute durations in Allenhurst borough are 5 to 9 minutes (43 commuters, 20.5%), 60 to 89 minutes (34 commuters, 16.2%), and 15 to 19 minutes (28 commuters, 13.3%).
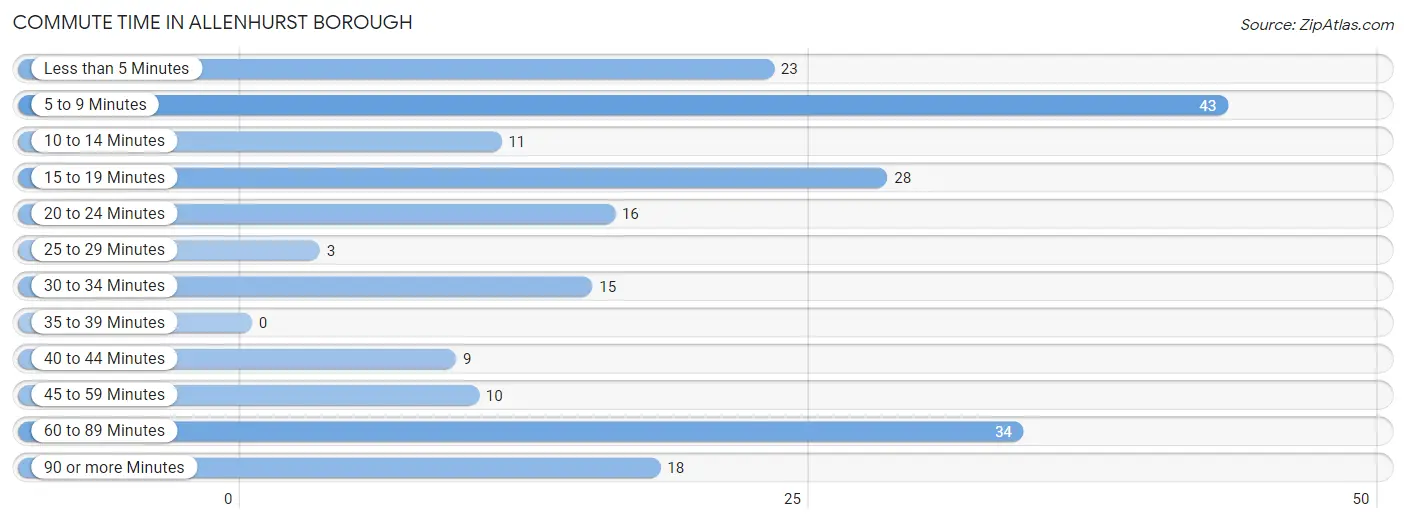
| Commute Time | # Commuters | % Commuters |
| Less than 5 Minutes | 23 | 11.0% |
| 5 to 9 Minutes | 43 | 20.5% |
| 10 to 14 Minutes | 11 | 5.2% |
| 15 to 19 Minutes | 28 | 13.3% |
| 20 to 24 Minutes | 16 | 7.6% |
| 25 to 29 Minutes | 3 | 1.4% |
| 30 to 34 Minutes | 15 | 7.1% |
| 35 to 39 Minutes | 0 | 0.0% |
| 40 to 44 Minutes | 9 | 4.3% |
| 45 to 59 Minutes | 10 | 4.8% |
| 60 to 89 Minutes | 34 | 16.2% |
| 90 or more Minutes | 18 | 8.6% |
Commute Time by Sex in Allenhurst borough
The most common commute times in Allenhurst borough are 5 to 9 minutes (22 commuters, 16.8%) for males and 5 to 9 minutes (21 commuters, 26.6%) for females.
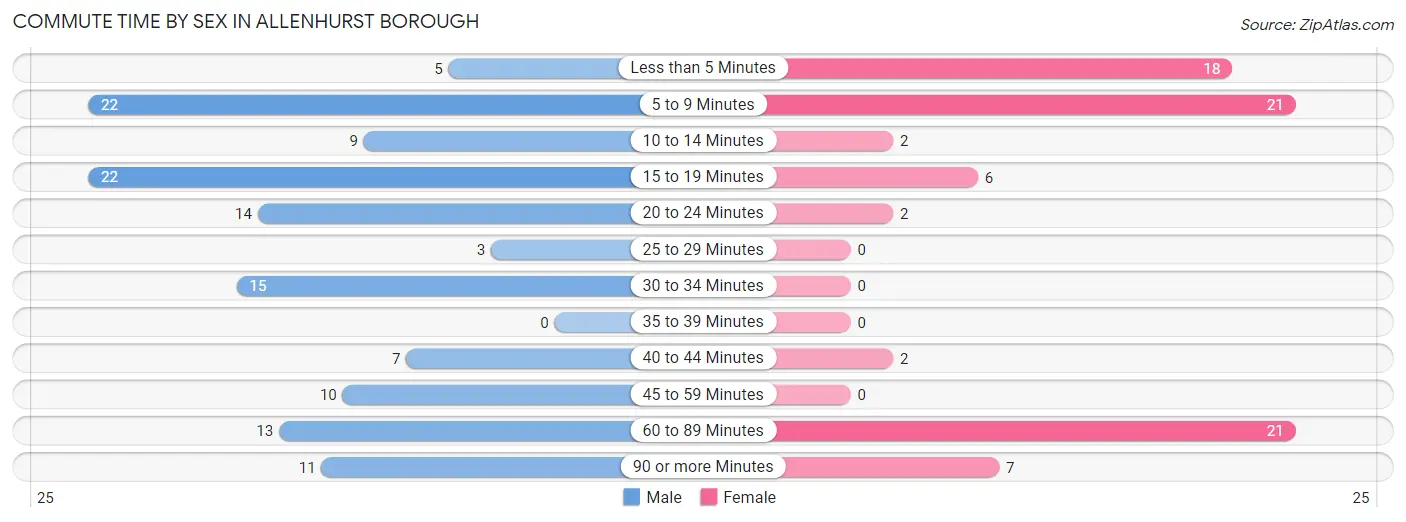
| Commute Time | Male | Female |
| Less than 5 Minutes | 5 (3.8%) | 18 (22.8%) |
| 5 to 9 Minutes | 22 (16.8%) | 21 (26.6%) |
| 10 to 14 Minutes | 9 (6.9%) | 2 (2.5%) |
| 15 to 19 Minutes | 22 (16.8%) | 6 (7.6%) |
| 20 to 24 Minutes | 14 (10.7%) | 2 (2.5%) |
| 25 to 29 Minutes | 3 (2.3%) | 0 (0.0%) |
| 30 to 34 Minutes | 15 (11.5%) | 0 (0.0%) |
| 35 to 39 Minutes | 0 (0.0%) | 0 (0.0%) |
| 40 to 44 Minutes | 7 (5.3%) | 2 (2.5%) |
| 45 to 59 Minutes | 10 (7.6%) | 0 (0.0%) |
| 60 to 89 Minutes | 13 (9.9%) | 21 (26.6%) |
| 90 or more Minutes | 11 (8.4%) | 7 (8.9%) |
Time of Departure to Work by Sex in Allenhurst borough
The most frequent times of departure to work in Allenhurst borough are 9:00 AM to 9:59 AM (32, 24.4%) for males and 7:00 AM to 7:29 AM (21, 26.6%) for females.
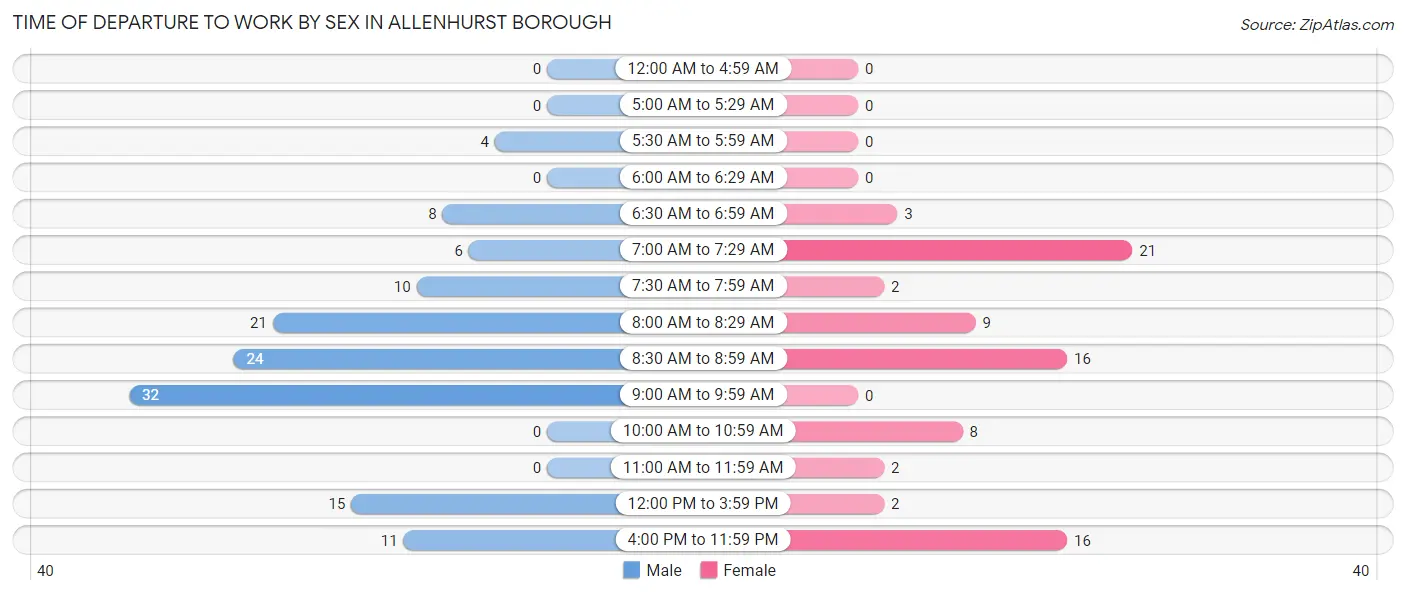
| Time of Departure | Male | Female |
| 12:00 AM to 4:59 AM | 0 (0.0%) | 0 (0.0%) |
| 5:00 AM to 5:29 AM | 0 (0.0%) | 0 (0.0%) |
| 5:30 AM to 5:59 AM | 4 (3.0%) | 0 (0.0%) |
| 6:00 AM to 6:29 AM | 0 (0.0%) | 0 (0.0%) |
| 6:30 AM to 6:59 AM | 8 (6.1%) | 3 (3.8%) |
| 7:00 AM to 7:29 AM | 6 (4.6%) | 21 (26.6%) |
| 7:30 AM to 7:59 AM | 10 (7.6%) | 2 (2.5%) |
| 8:00 AM to 8:29 AM | 21 (16.0%) | 9 (11.4%) |
| 8:30 AM to 8:59 AM | 24 (18.3%) | 16 (20.3%) |
| 9:00 AM to 9:59 AM | 32 (24.4%) | 0 (0.0%) |
| 10:00 AM to 10:59 AM | 0 (0.0%) | 8 (10.1%) |
| 11:00 AM to 11:59 AM | 0 (0.0%) | 2 (2.5%) |
| 12:00 PM to 3:59 PM | 15 (11.5%) | 2 (2.5%) |
| 4:00 PM to 11:59 PM | 11 (8.4%) | 16 (20.3%) |
| Total | 131 (100.0%) | 79 (100.0%) |
Housing Occupancy in Allenhurst borough
Occupancy by Ownership in Allenhurst borough
Of the total 175 dwellings in Allenhurst borough, owner-occupied units account for 106 (60.6%), while renter-occupied units make up 69 (39.4%).
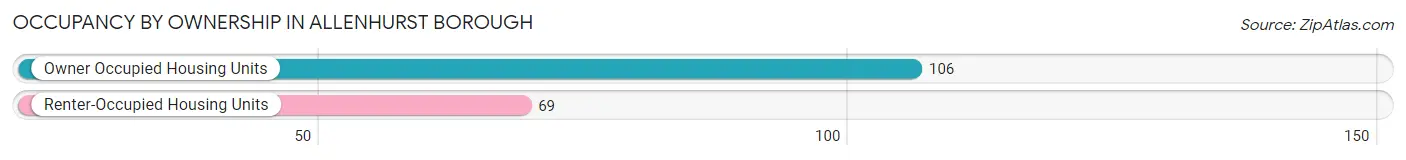
| Occupancy | # Housing Units | % Housing Units |
| Owner Occupied Housing Units | 106 | 60.6% |
| Renter-Occupied Housing Units | 69 | 39.4% |
| Total Occupied Housing Units | 175 | 100.0% |
Occupancy by Household Size in Allenhurst borough
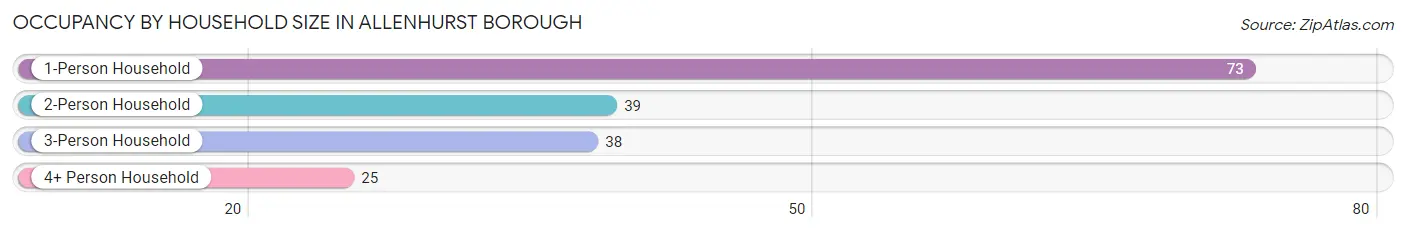
| Household Size | # Housing Units | % Housing Units |
| 1-Person Household | 73 | 41.7% |
| 2-Person Household | 39 | 22.3% |
| 3-Person Household | 38 | 21.7% |
| 4+ Person Household | 25 | 14.3% |
| Total Housing Units | 175 | 100.0% |
Occupancy by Ownership by Household Size in Allenhurst borough
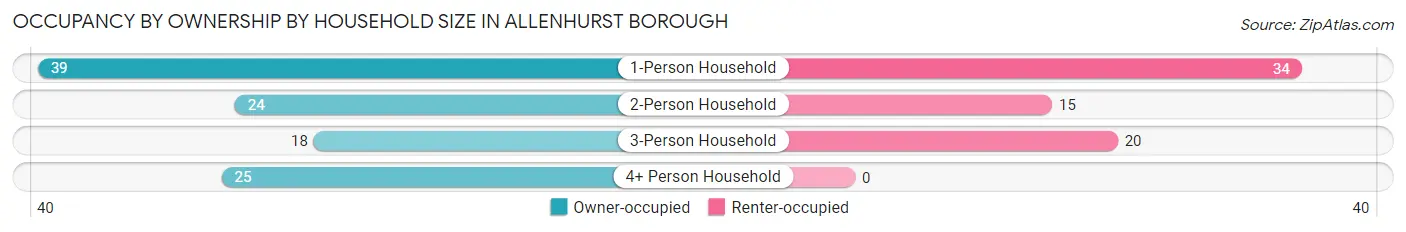
| Household Size | Owner-occupied | Renter-occupied |
| 1-Person Household | 39 (53.4%) | 34 (46.6%) |
| 2-Person Household | 24 (61.5%) | 15 (38.5%) |
| 3-Person Household | 18 (47.4%) | 20 (52.6%) |
| 4+ Person Household | 25 (100.0%) | 0 (0.0%) |
| Total Housing Units | 106 (60.6%) | 69 (39.4%) |
Occupancy by Educational Attainment in Allenhurst borough
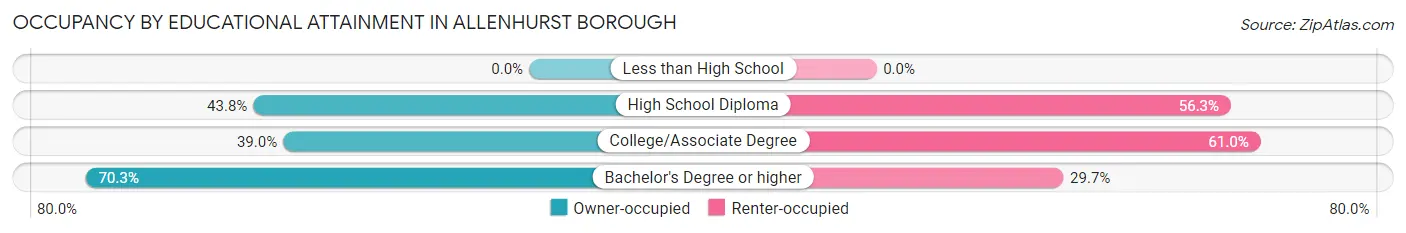
| Household Size | Owner-occupied | Renter-occupied |
| Less than High School | 0 (0.0%) | 0 (0.0%) |
| High School Diploma | 7 (43.8%) | 9 (56.2%) |
| College/Associate Degree | 16 (39.0%) | 25 (61.0%) |
| Bachelor's Degree or higher | 83 (70.3%) | 35 (29.7%) |
Occupancy by Age of Householder in Allenhurst borough
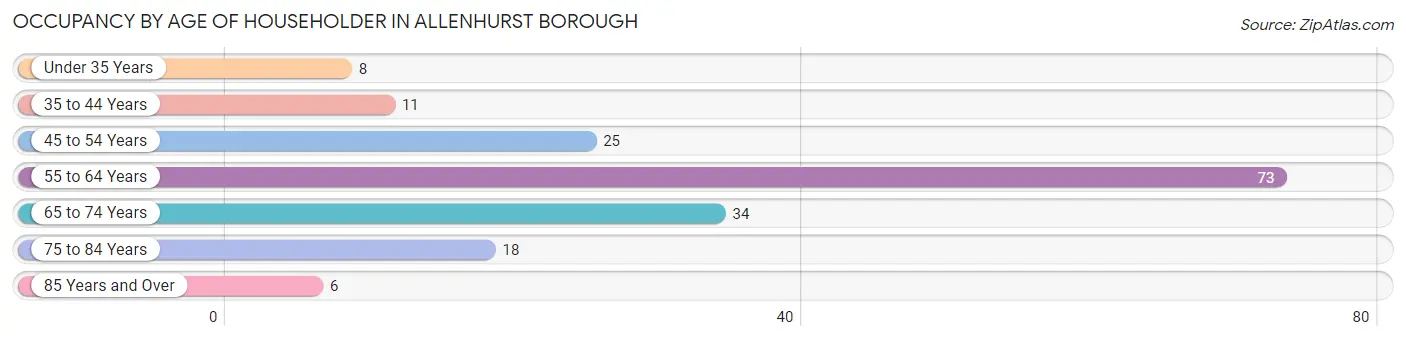
| Age Bracket | # Households | % Households |
| Under 35 Years | 8 | 4.6% |
| 35 to 44 Years | 11 | 6.3% |
| 45 to 54 Years | 25 | 14.3% |
| 55 to 64 Years | 73 | 41.7% |
| 65 to 74 Years | 34 | 19.4% |
| 75 to 84 Years | 18 | 10.3% |
| 85 Years and Over | 6 | 3.4% |
| Total | 175 | 100.0% |
Housing Finances in Allenhurst borough
Median Income by Occupancy in Allenhurst borough
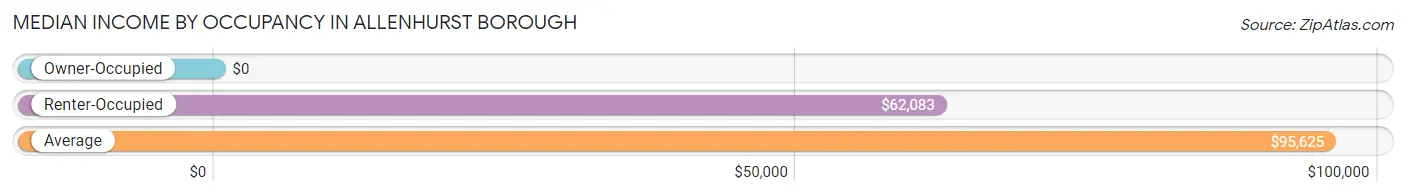
| Occupancy Type | # Households | Median Income |
| Owner-Occupied | 106 (60.6%) | $0 |
| Renter-Occupied | 69 (39.4%) | $62,083 |
| Average | 175 (100.0%) | $95,625 |
Occupancy by Householder Income Bracket in Allenhurst borough
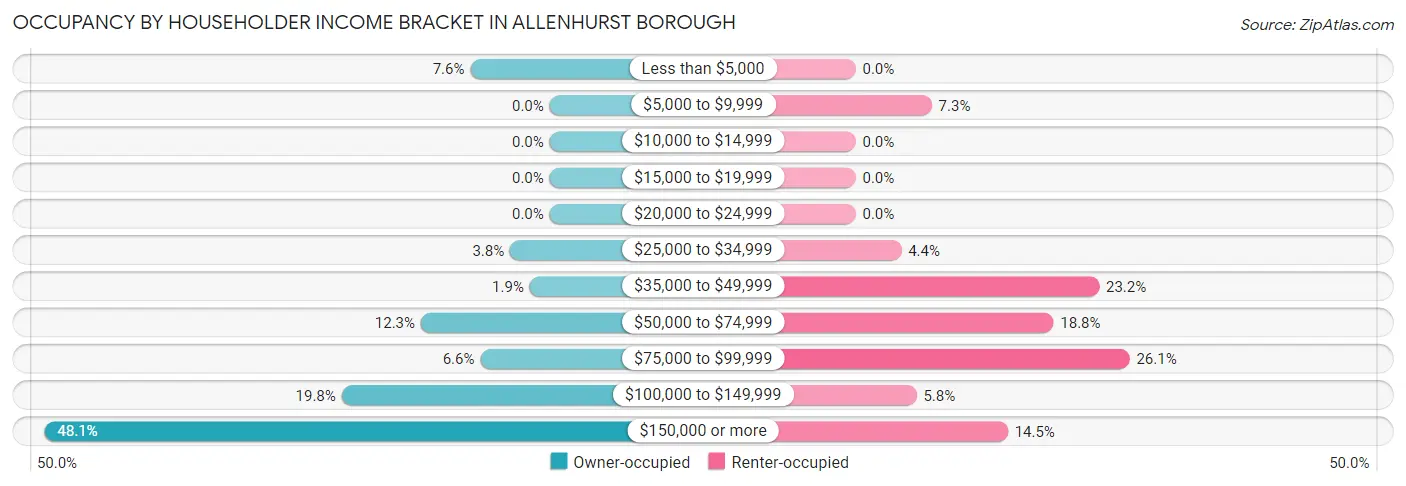
| Income Bracket | Owner-occupied | Renter-occupied |
| Less than $5,000 | 8 (7.5%) | 0 (0.0%) |
| $5,000 to $9,999 | 0 (0.0%) | 5 (7.2%) |
| $10,000 to $14,999 | 0 (0.0%) | 0 (0.0%) |
| $15,000 to $19,999 | 0 (0.0%) | 0 (0.0%) |
| $20,000 to $24,999 | 0 (0.0%) | 0 (0.0%) |
| $25,000 to $34,999 | 4 (3.8%) | 3 (4.3%) |
| $35,000 to $49,999 | 2 (1.9%) | 16 (23.2%) |
| $50,000 to $74,999 | 13 (12.3%) | 13 (18.8%) |
| $75,000 to $99,999 | 7 (6.6%) | 18 (26.1%) |
| $100,000 to $149,999 | 21 (19.8%) | 4 (5.8%) |
| $150,000 or more | 51 (48.1%) | 10 (14.5%) |
| Total | 106 (100.0%) | 69 (100.0%) |
Monthly Housing Cost Tiers in Allenhurst borough
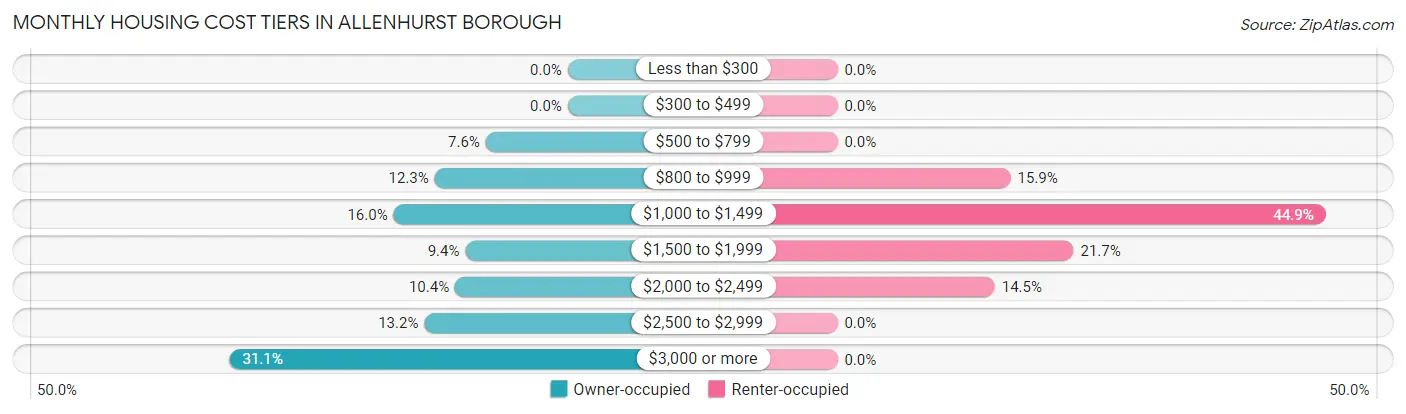
| Monthly Cost | Owner-occupied | Renter-occupied |
| Less than $300 | 0 (0.0%) | 0 (0.0%) |
| $300 to $499 | 0 (0.0%) | 0 (0.0%) |
| $500 to $799 | 8 (7.5%) | 0 (0.0%) |
| $800 to $999 | 13 (12.3%) | 11 (15.9%) |
| $1,000 to $1,499 | 17 (16.0%) | 31 (44.9%) |
| $1,500 to $1,999 | 10 (9.4%) | 15 (21.7%) |
| $2,000 to $2,499 | 11 (10.4%) | 10 (14.5%) |
| $2,500 to $2,999 | 14 (13.2%) | 0 (0.0%) |
| $3,000 or more | 33 (31.1%) | 0 (0.0%) |
| Total | 106 (100.0%) | 69 (100.0%) |
Physical Housing Characteristics in Allenhurst borough
Housing Structures in Allenhurst borough
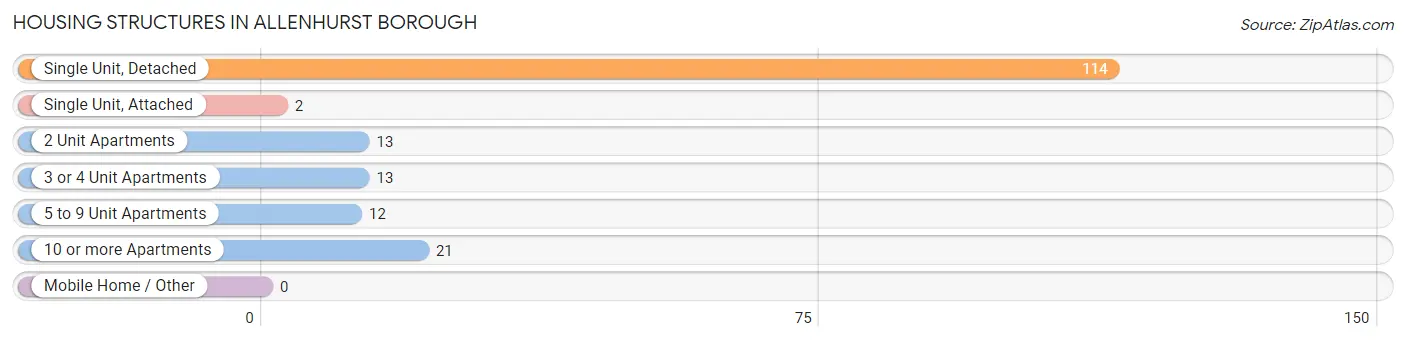
| Structure Type | # Housing Units | % Housing Units |
| Single Unit, Detached | 114 | 65.1% |
| Single Unit, Attached | 2 | 1.1% |
| 2 Unit Apartments | 13 | 7.4% |
| 3 or 4 Unit Apartments | 13 | 7.4% |
| 5 to 9 Unit Apartments | 12 | 6.9% |
| 10 or more Apartments | 21 | 12.0% |
| Mobile Home / Other | 0 | 0.0% |
| Total | 175 | 100.0% |
Housing Structures by Occupancy in Allenhurst borough
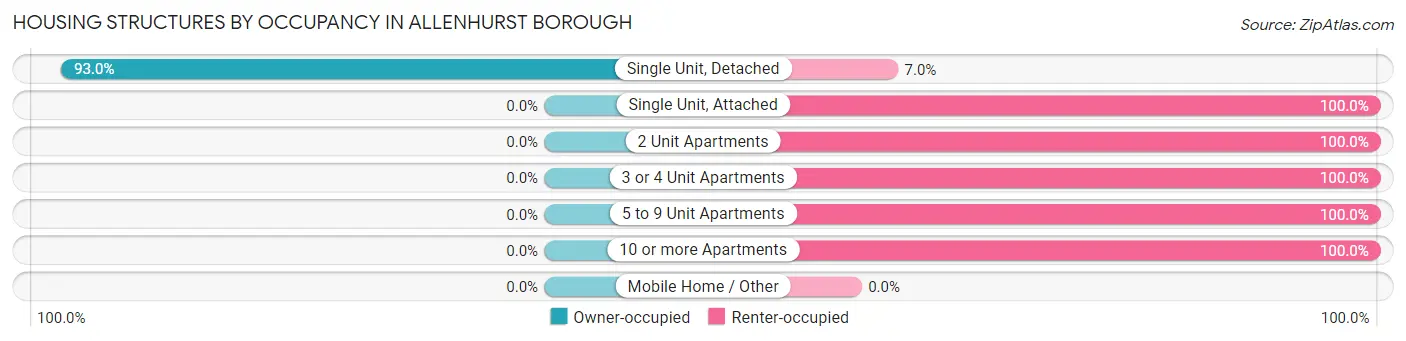
| Structure Type | Owner-occupied | Renter-occupied |
| Single Unit, Detached | 106 (93.0%) | 8 (7.0%) |
| Single Unit, Attached | 0 (0.0%) | 2 (100.0%) |
| 2 Unit Apartments | 0 (0.0%) | 13 (100.0%) |
| 3 or 4 Unit Apartments | 0 (0.0%) | 13 (100.0%) |
| 5 to 9 Unit Apartments | 0 (0.0%) | 12 (100.0%) |
| 10 or more Apartments | 0 (0.0%) | 21 (100.0%) |
| Mobile Home / Other | 0 (0.0%) | 0 (0.0%) |
| Total | 106 (60.6%) | 69 (39.4%) |
Housing Structures by Number of Rooms in Allenhurst borough
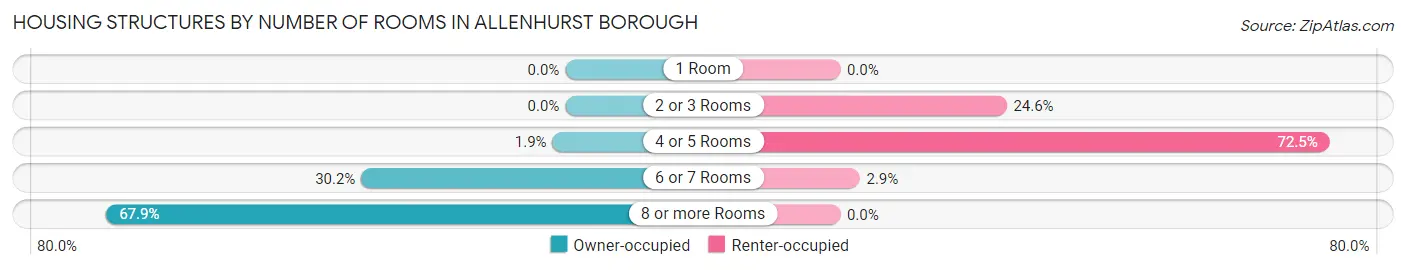
| Number of Rooms | Owner-occupied | Renter-occupied |
| 1 Room | 0 (0.0%) | 0 (0.0%) |
| 2 or 3 Rooms | 0 (0.0%) | 17 (24.6%) |
| 4 or 5 Rooms | 2 (1.9%) | 50 (72.5%) |
| 6 or 7 Rooms | 32 (30.2%) | 2 (2.9%) |
| 8 or more Rooms | 72 (67.9%) | 0 (0.0%) |
| Total | 106 (100.0%) | 69 (100.0%) |
Housing Structure by Heating Type in Allenhurst borough
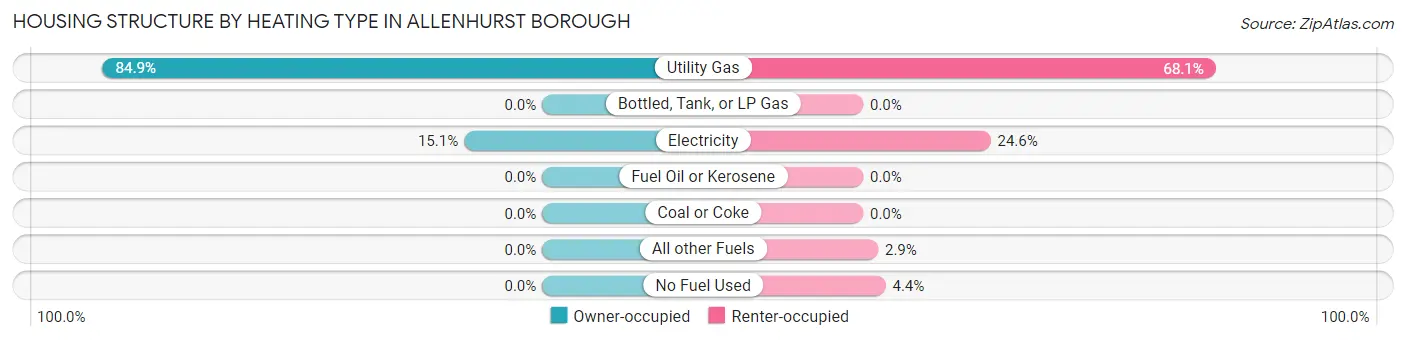
| Heating Type | Owner-occupied | Renter-occupied |
| Utility Gas | 90 (84.9%) | 47 (68.1%) |
| Bottled, Tank, or LP Gas | 0 (0.0%) | 0 (0.0%) |
| Electricity | 16 (15.1%) | 17 (24.6%) |
| Fuel Oil or Kerosene | 0 (0.0%) | 0 (0.0%) |
| Coal or Coke | 0 (0.0%) | 0 (0.0%) |
| All other Fuels | 0 (0.0%) | 2 (2.9%) |
| No Fuel Used | 0 (0.0%) | 3 (4.3%) |
| Total | 106 (100.0%) | 69 (100.0%) |
Household Vehicle Usage in Allenhurst borough
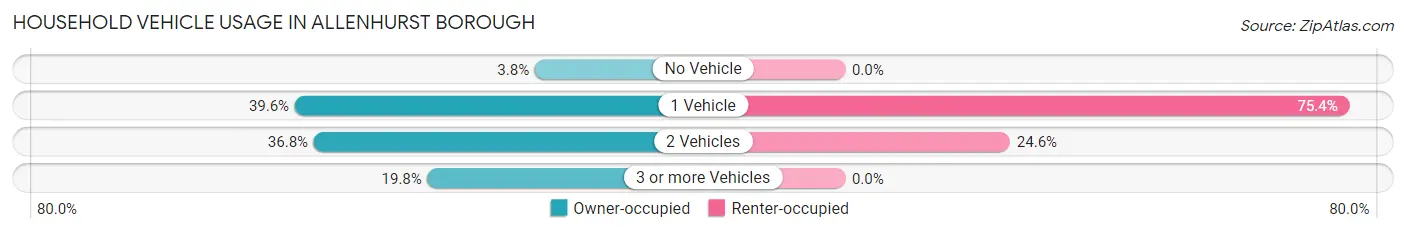
| Vehicles per Household | Owner-occupied | Renter-occupied |
| No Vehicle | 4 (3.8%) | 0 (0.0%) |
| 1 Vehicle | 42 (39.6%) | 52 (75.4%) |
| 2 Vehicles | 39 (36.8%) | 17 (24.6%) |
| 3 or more Vehicles | 21 (19.8%) | 0 (0.0%) |
| Total | 106 (100.0%) | 69 (100.0%) |
Real Estate & Mortgages in Allenhurst borough
Real Estate and Mortgage Overview in Allenhurst borough
| Characteristic | Without Mortgage | With Mortgage |
| Housing Units | 69 | 37 |
| Median Property Value | $1,098,200 | $1,675,000 |
| Median Household Income | $103,942 | $22 |
| Monthly Housing Costs | $1,388 | $31 |
| Real Estate Taxes | $10,001 | $0 |
Property Value by Mortgage Status in Allenhurst borough
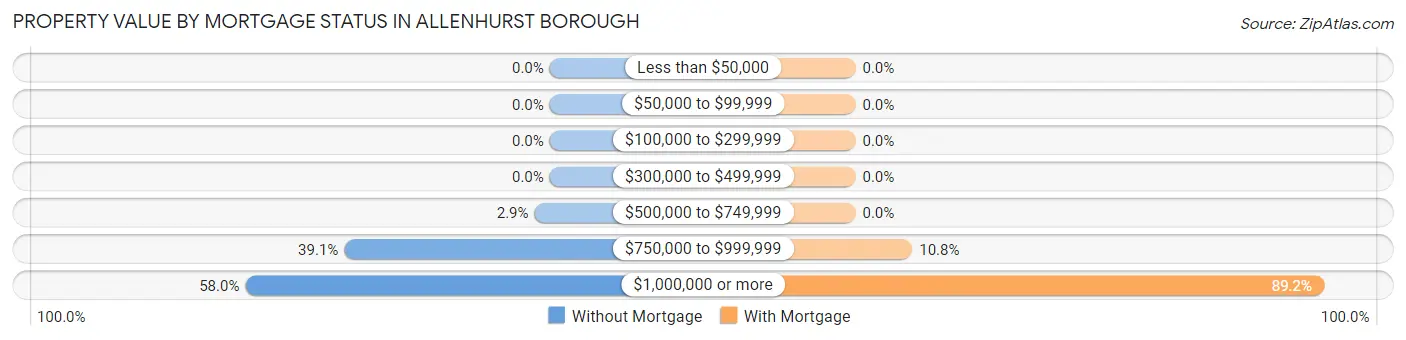
| Property Value | Without Mortgage | With Mortgage |
| Less than $50,000 | 0 (0.0%) | 0 (0.0%) |
| $50,000 to $99,999 | 0 (0.0%) | 0 (0.0%) |
| $100,000 to $299,999 | 0 (0.0%) | 0 (0.0%) |
| $300,000 to $499,999 | 0 (0.0%) | 0 (0.0%) |
| $500,000 to $749,999 | 2 (2.9%) | 0 (0.0%) |
| $750,000 to $999,999 | 27 (39.1%) | 4 (10.8%) |
| $1,000,000 or more | 40 (58.0%) | 33 (89.2%) |
| Total | 69 (100.0%) | 37 (100.0%) |
Household Income by Mortgage Status in Allenhurst borough
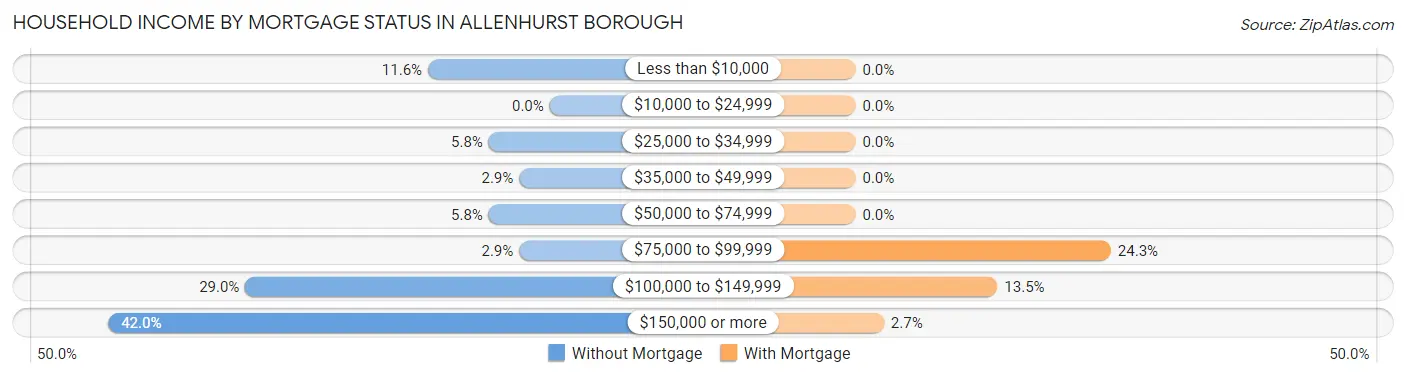
| Household Income | Without Mortgage | With Mortgage |
| Less than $10,000 | 8 (11.6%) | 0 (0.0%) |
| $10,000 to $24,999 | 0 (0.0%) | 0 (0.0%) |
| $25,000 to $34,999 | 4 (5.8%) | 0 (0.0%) |
| $35,000 to $49,999 | 2 (2.9%) | 0 (0.0%) |
| $50,000 to $74,999 | 4 (5.8%) | 0 (0.0%) |
| $75,000 to $99,999 | 2 (2.9%) | 9 (24.3%) |
| $100,000 to $149,999 | 20 (29.0%) | 5 (13.5%) |
| $150,000 or more | 29 (42.0%) | 1 (2.7%) |
| Total | 69 (100.0%) | 37 (100.0%) |
Property Value to Household Income Ratio in Allenhurst borough
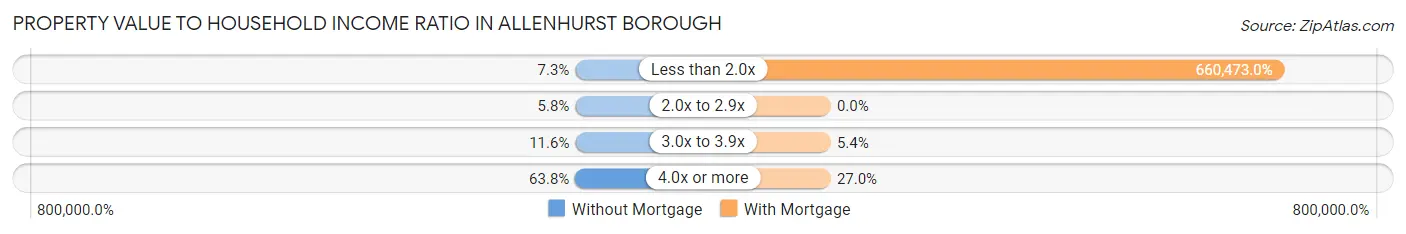
| Value-to-Income Ratio | Without Mortgage | With Mortgage |
| Less than 2.0x | 5 (7.2%) | 244,375 (660,473.0%) |
| 2.0x to 2.9x | 4 (5.8%) | 0 (0.0%) |
| 3.0x to 3.9x | 8 (11.6%) | 2 (5.4%) |
| 4.0x or more | 44 (63.8%) | 10 (27.0%) |
| Total | 69 (100.0%) | 37 (100.0%) |
Real Estate Taxes by Mortgage Status in Allenhurst borough
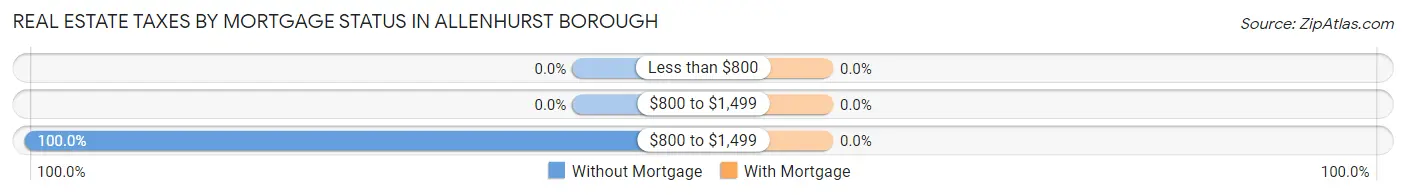
| Property Taxes | Without Mortgage | With Mortgage |
| Less than $800 | 0 (0.0%) | 0 (0.0%) |
| $800 to $1,499 | 0 (0.0%) | 0 (0.0%) |
| $800 to $1,499 | 69 (100.0%) | 0 (0.0%) |
| Total | 69 (100.0%) | 37 (100.0%) |
Health & Disability in Allenhurst borough
Health Insurance Coverage by Age in Allenhurst borough
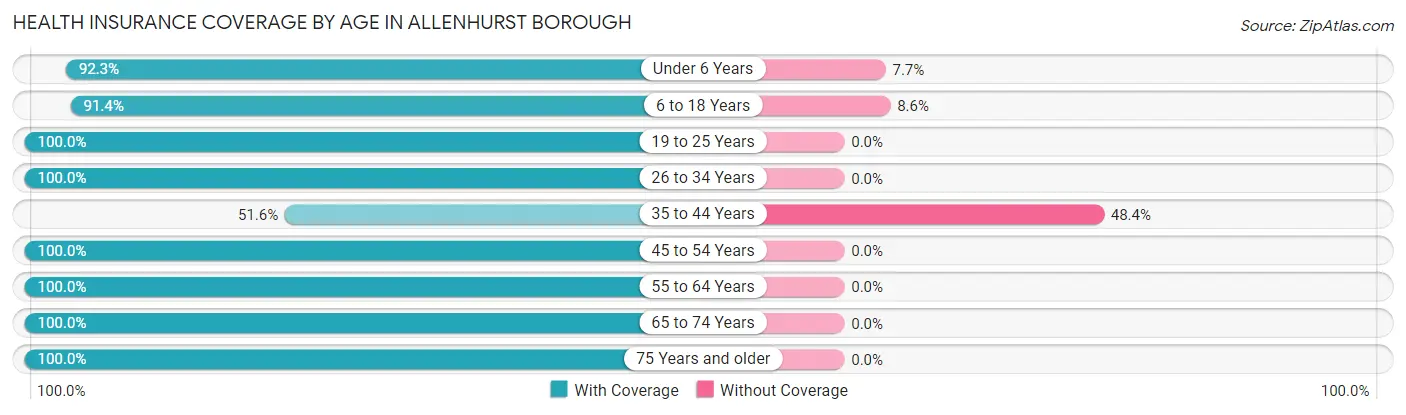
| Age Bracket | With Coverage | Without Coverage |
| Under 6 Years | 24 (92.3%) | 2 (7.7%) |
| 6 to 18 Years | 32 (91.4%) | 3 (8.6%) |
| 19 to 25 Years | 42 (100.0%) | 0 (0.0%) |
| 26 to 34 Years | 49 (100.0%) | 0 (0.0%) |
| 35 to 44 Years | 16 (51.6%) | 15 (48.4%) |
| 45 to 54 Years | 44 (100.0%) | 0 (0.0%) |
| 55 to 64 Years | 90 (100.0%) | 0 (0.0%) |
| 65 to 74 Years | 60 (100.0%) | 0 (0.0%) |
| 75 Years and older | 35 (100.0%) | 0 (0.0%) |
| Total | 392 (95.2%) | 20 (4.9%) |
Health Insurance Coverage by Citizenship Status in Allenhurst borough
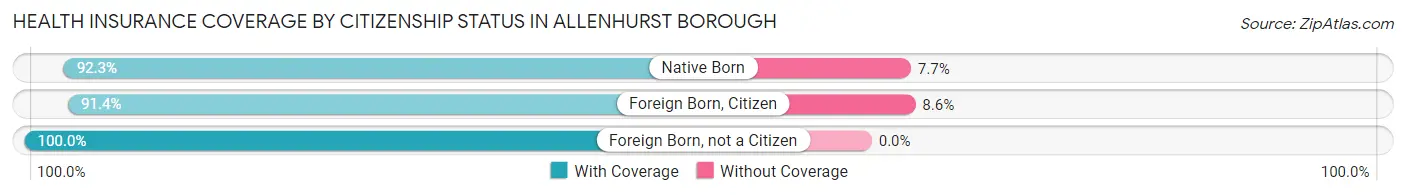
| Citizenship Status | With Coverage | Without Coverage |
| Native Born | 24 (92.3%) | 2 (7.7%) |
| Foreign Born, Citizen | 32 (91.4%) | 3 (8.6%) |
| Foreign Born, not a Citizen | 42 (100.0%) | 0 (0.0%) |
Health Insurance Coverage by Household Income in Allenhurst borough
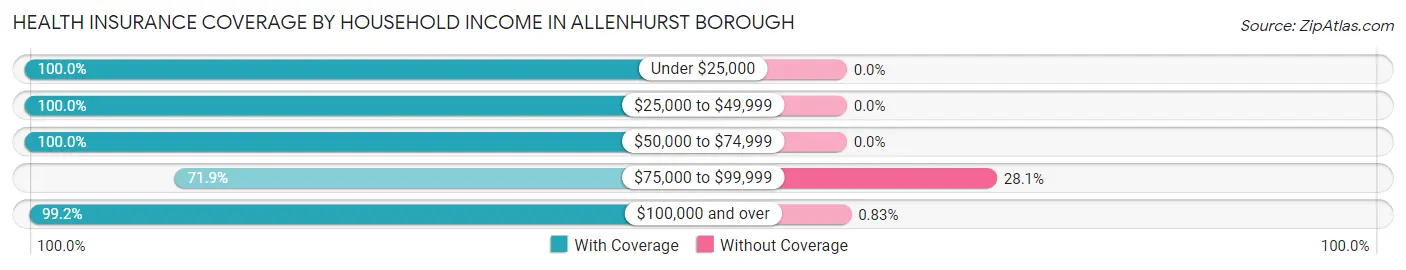
| Household Income | With Coverage | Without Coverage |
| Under $25,000 | 16 (100.0%) | 0 (0.0%) |
| $25,000 to $49,999 | 29 (100.0%) | 0 (0.0%) |
| $50,000 to $74,999 | 61 (100.0%) | 0 (0.0%) |
| $75,000 to $99,999 | 46 (71.9%) | 18 (28.1%) |
| $100,000 and over | 240 (99.2%) | 2 (0.8%) |
Public vs Private Health Insurance Coverage by Age in Allenhurst borough
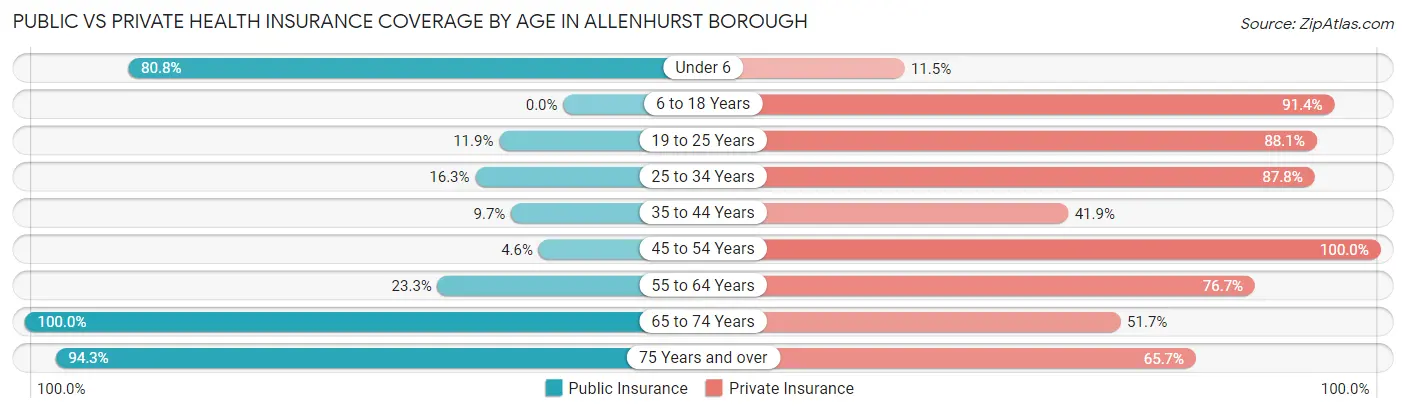
| Age Bracket | Public Insurance | Private Insurance |
| Under 6 | 21 (80.8%) | 3 (11.5%) |
| 6 to 18 Years | 0 (0.0%) | 32 (91.4%) |
| 19 to 25 Years | 5 (11.9%) | 37 (88.1%) |
| 25 to 34 Years | 8 (16.3%) | 43 (87.8%) |
| 35 to 44 Years | 3 (9.7%) | 13 (41.9%) |
| 45 to 54 Years | 2 (4.5%) | 44 (100.0%) |
| 55 to 64 Years | 21 (23.3%) | 69 (76.7%) |
| 65 to 74 Years | 60 (100.0%) | 31 (51.7%) |
| 75 Years and over | 33 (94.3%) | 23 (65.7%) |
| Total | 153 (37.1%) | 295 (71.6%) |
Disability Status by Sex by Age in Allenhurst borough
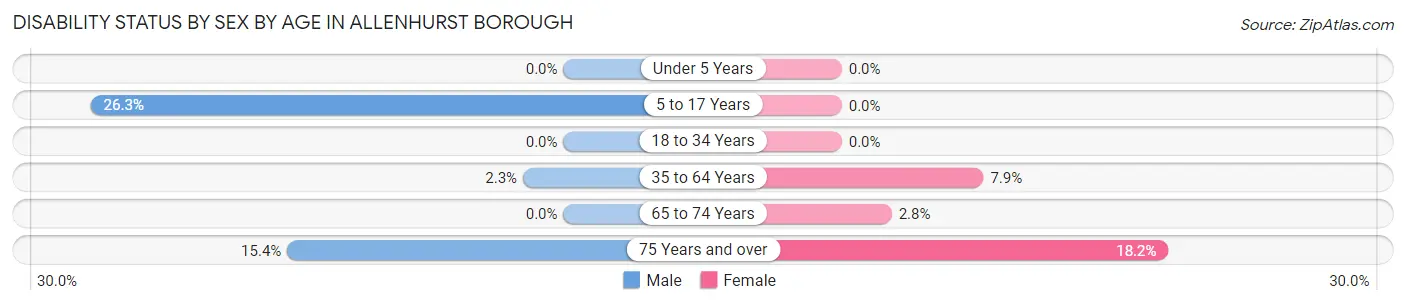
| Age Bracket | Male | Female |
| Under 5 Years | 0 (0.0%) | 0 (0.0%) |
| 5 to 17 Years | 5 (26.3%) | 0 (0.0%) |
| 18 to 34 Years | 0 (0.0%) | 0 (0.0%) |
| 35 to 64 Years | 2 (2.2%) | 6 (7.9%) |
| 65 to 74 Years | 0 (0.0%) | 1 (2.8%) |
| 75 Years and over | 2 (15.4%) | 4 (18.2%) |
Disability Class by Sex by Age in Allenhurst borough
Disability Class: Hearing Difficulty
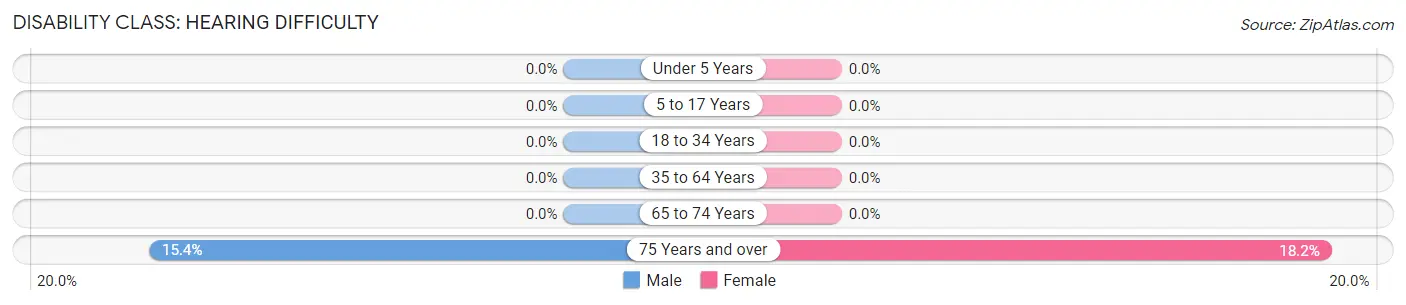
| Age Bracket | Male | Female |
| Under 5 Years | 0 (0.0%) | 0 (0.0%) |
| 5 to 17 Years | 0 (0.0%) | 0 (0.0%) |
| 18 to 34 Years | 0 (0.0%) | 0 (0.0%) |
| 35 to 64 Years | 0 (0.0%) | 0 (0.0%) |
| 65 to 74 Years | 0 (0.0%) | 0 (0.0%) |
| 75 Years and over | 2 (15.4%) | 4 (18.2%) |
Disability Class: Vision Difficulty
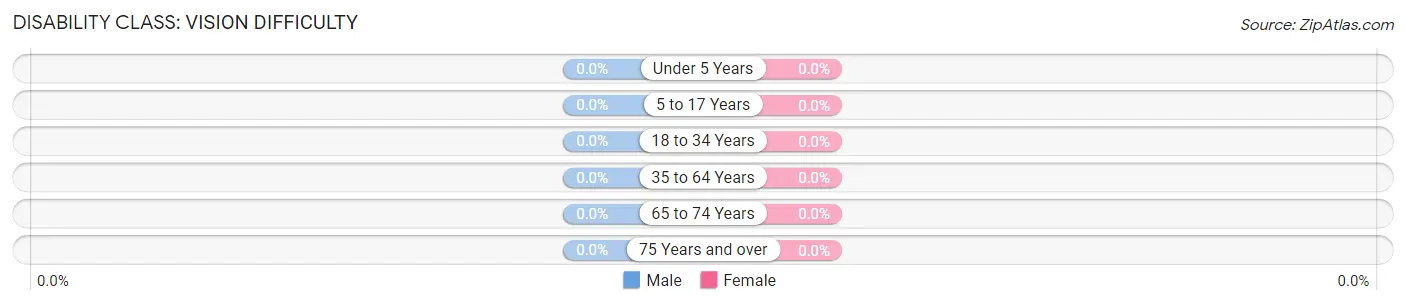
| Age Bracket | Male | Female |
| Under 5 Years | 0 (0.0%) | 0 (0.0%) |
| 5 to 17 Years | 0 (0.0%) | 0 (0.0%) |
| 18 to 34 Years | 0 (0.0%) | 0 (0.0%) |
| 35 to 64 Years | 0 (0.0%) | 0 (0.0%) |
| 65 to 74 Years | 0 (0.0%) | 0 (0.0%) |
| 75 Years and over | 0 (0.0%) | 0 (0.0%) |
Disability Class: Cognitive Difficulty
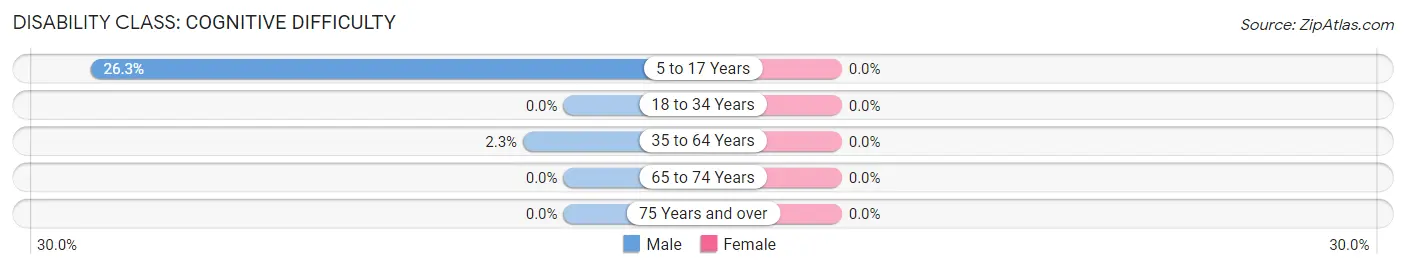
| Age Bracket | Male | Female |
| 5 to 17 Years | 5 (26.3%) | 0 (0.0%) |
| 18 to 34 Years | 0 (0.0%) | 0 (0.0%) |
| 35 to 64 Years | 2 (2.2%) | 0 (0.0%) |
| 65 to 74 Years | 0 (0.0%) | 0 (0.0%) |
| 75 Years and over | 0 (0.0%) | 0 (0.0%) |
Disability Class: Ambulatory Difficulty
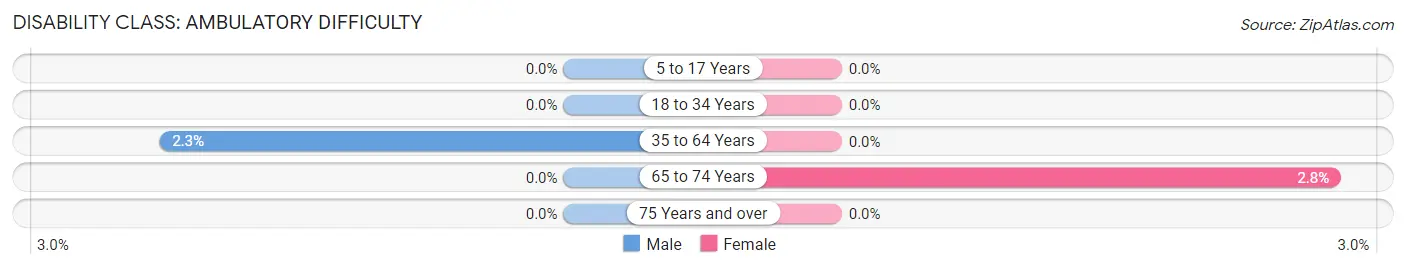
| Age Bracket | Male | Female |
| 5 to 17 Years | 0 (0.0%) | 0 (0.0%) |
| 18 to 34 Years | 0 (0.0%) | 0 (0.0%) |
| 35 to 64 Years | 2 (2.2%) | 0 (0.0%) |
| 65 to 74 Years | 0 (0.0%) | 1 (2.8%) |
| 75 Years and over | 0 (0.0%) | 0 (0.0%) |
Disability Class: Self-Care Difficulty
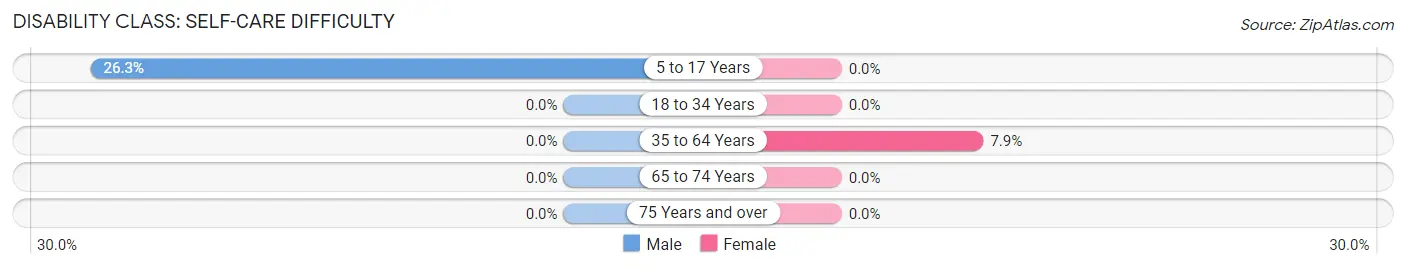
| Age Bracket | Male | Female |
| 5 to 17 Years | 5 (26.3%) | 0 (0.0%) |
| 18 to 34 Years | 0 (0.0%) | 0 (0.0%) |
| 35 to 64 Years | 0 (0.0%) | 6 (7.9%) |
| 65 to 74 Years | 0 (0.0%) | 0 (0.0%) |
| 75 Years and over | 0 (0.0%) | 0 (0.0%) |
Technology Access in Allenhurst borough
Computing Device Access in Allenhurst borough
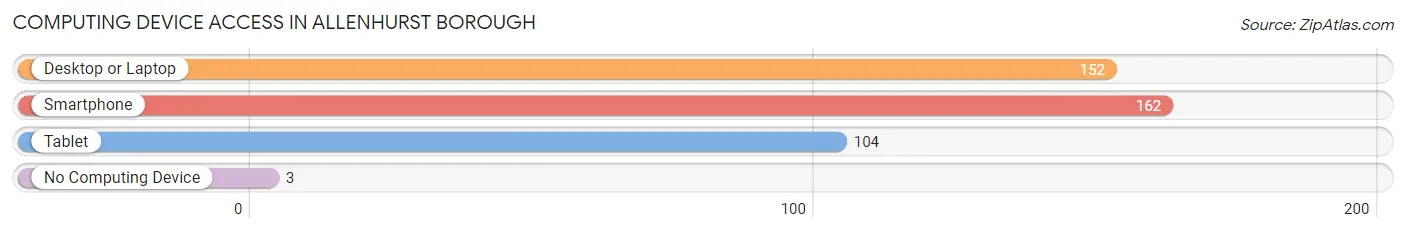
| Device Type | # Households | % Households |
| Desktop or Laptop | 152 | 86.9% |
| Smartphone | 162 | 92.6% |
| Tablet | 104 | 59.4% |
| No Computing Device | 3 | 1.7% |
| Total | 175 | 100.0% |
Internet Access in Allenhurst borough
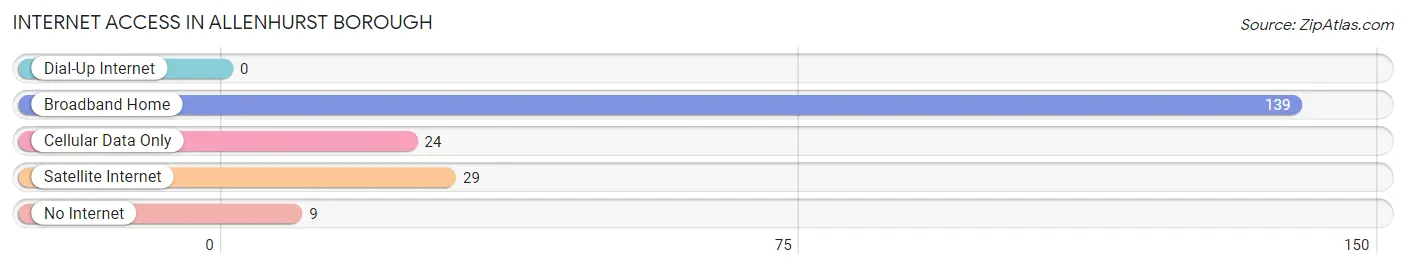
| Internet Type | # Households | % Households |
| Dial-Up Internet | 0 | 0.0% |
| Broadband Home | 139 | 79.4% |
| Cellular Data Only | 24 | 13.7% |
| Satellite Internet | 29 | 16.6% |
| No Internet | 9 | 5.1% |
| Total | 175 | 100.0% |
Allenhurst borough Summary
Allenhurst Borough is a small borough located in Monmouth County, New Jersey. It is situated on the Atlantic Ocean, just south of Asbury Park. The borough was incorporated in 1897 and is home to approximately 1,000 residents.
Geography
Allenhurst Borough is located in Monmouth County, New Jersey. It is situated on the Atlantic Ocean, just south of Asbury Park. The borough is bordered by Deal to the north, Interlaken to the east, and Loch Arbour to the south. The borough covers an area of 0.6 square miles and is home to approximately 1,000 residents.
The borough is located on a barrier island, which is separated from the mainland by the Shark River. The borough is home to several beaches, including Allenhurst Beach, which is located on the ocean side of the borough. The borough also has a marina, which is located on the Shark River.
Climate
Allenhurst Borough has a humid subtropical climate, with hot, humid summers and mild winters. The average temperature in the summer is around 75°F, while the average temperature in the winter is around 40°F. The average annual precipitation is around 45 inches.
Demographics
As of the 2010 census, there were 1,039 people, 441 households, and 287 families residing in the borough. The population density was 1,717.3 people per square mile. The racial makeup of the borough was 94.2% White, 2.2% African American, 0.2% Native American, 1.2% Asian, 0.1% Pacific Islander, 0.7% from other races, and 1.6% from two or more races. Hispanic or Latino of any race were 3.2% of the population.
The median age in the borough was 48.2 years. About 22.2% of residents were under the age of 18; 5.3% were between the ages of 18 and 24; 19.2% were from 25 to 44; 33.2% were from 45 to 64; and 20.1% were 65 years of age or older. The gender makeup of the borough was 48.2% male and 51.8% female.
Economy
Allenhurst Borough has a small, but vibrant economy. The borough is home to several small businesses, including restaurants, retail stores, and professional services. The borough also has a marina, which provides services to boaters.
The borough is also home to several summer camps, which provide employment opportunities for local residents. The borough also has a number of bed and breakfasts, which provide lodging for visitors to the area.
The median household income in the borough was $76,250, and the median family income was $90,000. About 4.2% of families and 5.3% of the population were below the poverty line, including 6.3% of those under age 18 and 4.2% of those age 65 or over.
Conclusion
Allenhurst Borough is a small borough located in Monmouth County, New Jersey. It is situated on the Atlantic Ocean, just south of Asbury Park. The borough was incorporated in 1897 and is home to approximately 1,000 residents. The borough has a humid subtropical climate, with hot, humid summers and mild winters. The borough has a small, but vibrant economy, with several small businesses, summer camps, and bed and breakfasts. The median household income in the borough was $76,250, and the median family income was $90,000.
Common Questions
What is Per Capita Income in Allenhurst borough?
Per Capita income in Allenhurst borough is $97,349.
What is the Median Family Income in Allenhurst borough?
Median Family Income in Allenhurst borough is $179,250.
What is the Median Household income in Allenhurst borough?
Median Household Income in Allenhurst borough is $95,625.
What is Income or Wage Gap in Allenhurst borough?
Income or Wage Gap in Allenhurst borough is 7.1%.
Women in Allenhurst borough earn 92.9 cents for every dollar earned by a man.
What is Inequality or Gini Index in Allenhurst borough?
Inequality or Gini Index in Allenhurst borough is 0.62.
What is the Total Population of Allenhurst borough?
Total Population of Allenhurst borough is 412.
What is the Total Male Population of Allenhurst borough?
Total Male Population of Allenhurst borough is 226.
What is the Total Female Population of Allenhurst borough?
Total Female Population of Allenhurst borough is 186.
What is the Ratio of Males per 100 Females in Allenhurst borough?
There are 121.51 Males per 100 Females in Allenhurst borough.
What is the Ratio of Females per 100 Males in Allenhurst borough?
There are 82.30 Females per 100 Males in Allenhurst borough.
What is the Median Population Age in Allenhurst borough?
Median Population Age in Allenhurst borough is 49.7 Years.
What is the Average Family Size in Allenhurst borough
Average Family Size in Allenhurst borough is 3.3 People.
What is the Average Household Size in Allenhurst borough
Average Household Size in Allenhurst borough is 2.4 People.
How Large is the Labor Force in Allenhurst borough?
There are 257 People in the Labor Forcein in Allenhurst borough.
What is the Percentage of People in the Labor Force in Allenhurst borough?
68.7% of People are in the Labor Force in Allenhurst borough.
What is the Unemployment Rate in Allenhurst borough?
Unemployment Rate in Allenhurst borough is 10.9%.