Cities with the Highest Percentage of Northern European Population in New Jersey
RELATED REPORTS & OPTIONS
Northern European
New Jersey
Compare Cities
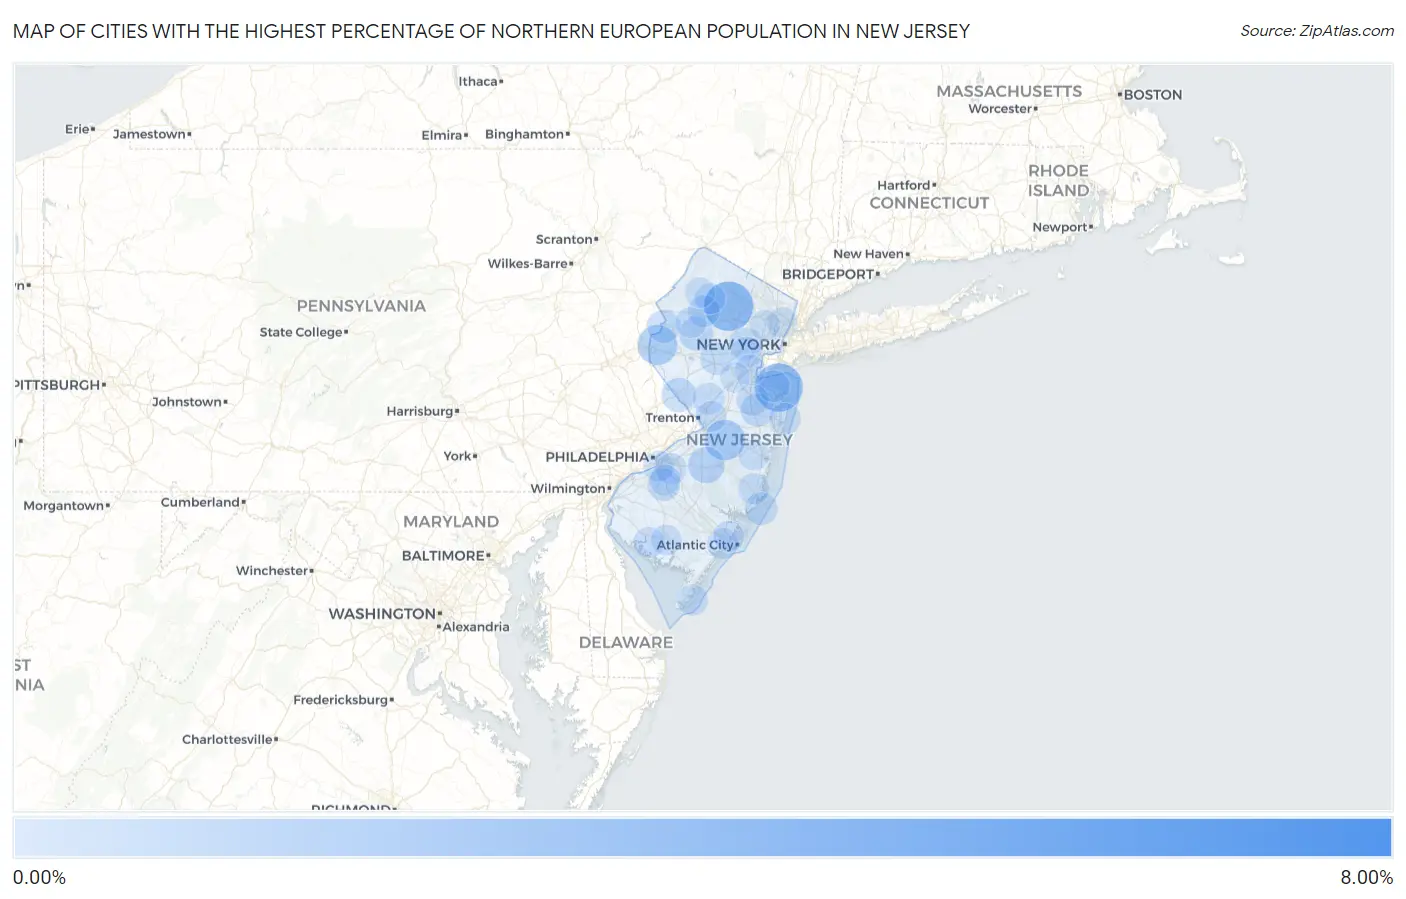
Map of Cities with the Highest Percentage of Northern European Population in New Jersey
0.00%
8.00%
Cities with the Highest Percentage of Northern European Population in New Jersey
| City | Northern European | vs State | vs National | |
| 1. | Absecon Highlands | 6.07% | 0.054%(+6.02)#1 | 0.15%(+5.92)#86 |
| 2. | Beesleys Point | 3.96% | 0.054%(+3.91)#2 | 0.15%(+3.82)#146 |
| 3. | Lake Telemark | 2.84% | 0.054%(+2.79)#3 | 0.15%(+2.70)#218 |
| 4. | Leonardo | 2.65% | 0.054%(+2.60)#4 | 0.15%(+2.51)#249 |
| 5. | Ocean Gate Borough | 1.84% | 0.054%(+1.79)#5 | 0.15%(+1.70)#431 |
| 6. | New Egypt | 1.55% | 0.054%(+1.49)#6 | 0.15%(+1.40)#547 |
| 7. | Upper Stewartsville | 1.45% | 0.054%(+1.40)#7 | 0.15%(+1.31)#584 |
| 8. | Rumson Borough | 1.44% | 0.054%(+1.39)#8 | 0.15%(+1.29)#592 |
| 9. | Layton | 1.30% | 0.054%(+1.25)#9 | 0.15%(+1.16)#677 |
| 10. | Franklin Borough | 1.07% | 0.054%(+1.02)#10 | 0.15%(+0.927)#829 |
| 11. | Delmont | 1.03% | 0.054%(+0.972)#11 | 0.15%(+0.878)#868 |
| 12. | Allenhurst Borough | 0.97% | 0.054%(+0.917)#12 | 0.15%(+0.824)#933 |
| 13. | Leisuretowne | 0.97% | 0.054%(+0.912)#13 | 0.15%(+0.818)#937 |
| 14. | Lincoln Park Borough | 0.81% | 0.054%(+0.755)#14 | 0.15%(+0.661)#1,159 |
| 15. | Farmingdale Borough | 0.75% | 0.054%(+0.700)#15 | 0.15%(+0.607)#1,247 |
| 16. | Helmetta Borough | 0.70% | 0.054%(+0.641)#16 | 0.15%(+0.548)#1,395 |
| 17. | Norwood Borough | 0.69% | 0.054%(+0.636)#17 | 0.15%(+0.542)#1,406 |
| 18. | Lambertville | 0.68% | 0.054%(+0.625)#18 | 0.15%(+0.531)#1,430 |
| 19. | West Cape May Borough | 0.65% | 0.054%(+0.593)#19 | 0.15%(+0.500)#1,506 |
| 20. | Long Valley | 0.64% | 0.054%(+0.582)#20 | 0.15%(+0.488)#1,543 |
| 21. | East Freehold | 0.56% | 0.054%(+0.509)#21 | 0.15%(+0.416)#1,752 |
| 22. | Belvidere | 0.55% | 0.054%(+0.499)#22 | 0.15%(+0.406)#1,774 |
| 23. | Hightstown Borough | 0.53% | 0.054%(+0.475)#23 | 0.15%(+0.381)#1,853 |
| 24. | Allendale Borough | 0.50% | 0.054%(+0.445)#24 | 0.15%(+0.351)#1,958 |
| 25. | Brielle Borough | 0.46% | 0.054%(+0.410)#25 | 0.15%(+0.317)#2,085 |
| 26. | North Beach Haven | 0.44% | 0.054%(+0.391)#26 | 0.15%(+0.297)#2,160 |
| 27. | Highland Park Borough | 0.44% | 0.054%(+0.386)#27 | 0.15%(+0.293)#2,181 |
| 28. | Green Knoll | 0.44% | 0.054%(+0.383)#28 | 0.15%(+0.290)#2,193 |
| 29. | Summit | 0.42% | 0.054%(+0.367)#29 | 0.15%(+0.274)#2,263 |
| 30. | North Haledon Borough | 0.41% | 0.054%(+0.355)#30 | 0.15%(+0.262)#2,332 |
| 31. | Chester Borough | 0.41% | 0.054%(+0.352)#31 | 0.15%(+0.258)#2,351 |
| 32. | Turnersville | 0.40% | 0.054%(+0.348)#32 | 0.15%(+0.254)#2,374 |
| 33. | Island Heights Borough | 0.39% | 0.054%(+0.341)#33 | 0.15%(+0.247)#2,411 |
| 34. | Spring Lake Heights Borough | 0.39% | 0.054%(+0.337)#34 | 0.15%(+0.243)#2,434 |
| 35. | Fair Haven Borough | 0.39% | 0.054%(+0.332)#35 | 0.15%(+0.238)#2,468 |
| 36. | Hopewell Borough | 0.38% | 0.054%(+0.330)#36 | 0.15%(+0.236)#2,485 |
| 37. | Atlantic Highlands Borough | 0.36% | 0.054%(+0.309)#37 | 0.15%(+0.216)#2,615 |
| 38. | Oakland Borough | 0.36% | 0.054%(+0.307)#38 | 0.15%(+0.214)#2,622 |
| 39. | Collingswood Borough | 0.36% | 0.054%(+0.307)#39 | 0.15%(+0.213)#2,626 |
| 40. | Morris Plains Borough | 0.36% | 0.054%(+0.307)#40 | 0.15%(+0.213)#2,629 |
| 41. | Byram Center | 0.36% | 0.054%(+0.302)#41 | 0.15%(+0.208)#2,668 |
| 42. | Princeton | 0.34% | 0.054%(+0.288)#42 | 0.15%(+0.194)#2,753 |
| 43. | Robertsville | 0.34% | 0.054%(+0.286)#43 | 0.15%(+0.193)#2,761 |
| 44. | Avon By The Sea Borough | 0.33% | 0.054%(+0.281)#44 | 0.15%(+0.187)#2,793 |
| 45. | Newfield Borough | 0.33% | 0.054%(+0.274)#45 | 0.15%(+0.181)#2,843 |
| 46. | Califon Borough | 0.32% | 0.054%(+0.266)#46 | 0.15%(+0.172)#2,902 |
| 47. | Port Monmouth | 0.32% | 0.054%(+0.261)#47 | 0.15%(+0.168)#2,935 |
| 48. | Audubon Park Borough | 0.29% | 0.054%(+0.237)#48 | 0.15%(+0.144)#3,115 |
| 49. | Merchantville Borough | 0.29% | 0.054%(+0.236)#49 | 0.15%(+0.142)#3,125 |
| 50. | Ocean Grove | 0.29% | 0.054%(+0.234)#50 | 0.15%(+0.140)#3,140 |
| 51. | Beach Haven Borough | 0.28% | 0.054%(+0.229)#51 | 0.15%(+0.135)#3,181 |
| 52. | Hampton Borough | 0.28% | 0.054%(+0.228)#52 | 0.15%(+0.135)#3,190 |
| 53. | Closter Borough | 0.28% | 0.054%(+0.227)#53 | 0.15%(+0.133)#3,208 |
| 54. | Fieldsboro Borough | 0.27% | 0.054%(+0.219)#54 | 0.15%(+0.126)#3,258 |
| 55. | Ocean Acres | 0.26% | 0.054%(+0.209)#55 | 0.15%(+0.116)#3,338 |
| 56. | Englewood Cliffs Borough | 0.26% | 0.054%(+0.208)#56 | 0.15%(+0.115)#3,352 |
| 57. | Ho Ho Kus Borough | 0.26% | 0.054%(+0.206)#57 | 0.15%(+0.112)#3,367 |
| 58. | Basking Ridge | 0.25% | 0.054%(+0.199)#58 | 0.15%(+0.106)#3,430 |
| 59. | Hawthorne Borough | 0.24% | 0.054%(+0.188)#59 | 0.15%(+0.094)#3,513 |
| 60. | Northfield | 0.24% | 0.054%(+0.183)#60 | 0.15%(+0.090)#3,543 |
| 61. | Westfield | 0.23% | 0.054%(+0.180)#61 | 0.15%(+0.086)#3,588 |
| 62. | Point Pleasant Borough | 0.23% | 0.054%(+0.177)#62 | 0.15%(+0.084)#3,602 |
| 63. | Ashland | 0.22% | 0.054%(+0.170)#63 | 0.15%(+0.076)#3,680 |
| 64. | Swedesboro Borough | 0.22% | 0.054%(+0.168)#64 | 0.15%(+0.074)#3,704 |
| 65. | Glen Ridge Borough | 0.22% | 0.054%(+0.164)#65 | 0.15%(+0.071)#3,743 |
| 66. | Fairton | 0.22% | 0.054%(+0.161)#66 | 0.15%(+0.068)#3,769 |
| 67. | Cedar Knolls | 0.22% | 0.054%(+0.161)#67 | 0.15%(+0.068)#3,770 |
| 68. | Wildwood | 0.21% | 0.054%(+0.159)#68 | 0.15%(+0.066)#3,803 |
| 69. | Gloucester City | 0.21% | 0.054%(+0.156)#69 | 0.15%(+0.063)#3,827 |
| 70. | Holiday City Berkeley | 0.20% | 0.054%(+0.144)#70 | 0.15%(+0.050)#3,960 |
| 71. | Blackwood | 0.20% | 0.054%(+0.142)#71 | 0.15%(+0.049)#3,984 |
| 72. | Chatham Borough | 0.20% | 0.054%(+0.142)#72 | 0.15%(+0.048)#3,993 |
| 73. | Paramus Borough | 0.20% | 0.054%(+0.142)#73 | 0.15%(+0.048)#3,995 |
| 74. | Haddon Heights Borough | 0.19% | 0.054%(+0.133)#74 | 0.15%(+0.040)#4,089 |
| 75. | South Bound Brook Borough | 0.19% | 0.054%(+0.132)#75 | 0.15%(+0.039)#4,102 |
| 76. | Lake Mohawk | 0.19% | 0.054%(+0.132)#76 | 0.15%(+0.038)#4,109 |
| 77. | Hamilton Square | 0.18% | 0.054%(+0.131)#77 | 0.15%(+0.038)#4,117 |
| 78. | Haddonfield Borough | 0.18% | 0.054%(+0.131)#78 | 0.15%(+0.037)#4,118 |
| 79. | North Caldwell Borough | 0.18% | 0.054%(+0.127)#79 | 0.15%(+0.034)#4,159 |
| 80. | Somerdale Borough | 0.18% | 0.054%(+0.127)#80 | 0.15%(+0.034)#4,160 |
| 81. | Hackettstown | 0.18% | 0.054%(+0.124)#81 | 0.15%(+0.031)#4,205 |
| 82. | Absecon | 0.18% | 0.054%(+0.122)#82 | 0.15%(+0.029)#4,227 |
| 83. | Millville | 0.17% | 0.054%(+0.121)#83 | 0.15%(+0.027)#4,256 |
| 84. | Folsom Borough | 0.17% | 0.054%(+0.116)#84 | 0.15%(+0.023)#4,300 |
| 85. | Fords | 0.17% | 0.054%(+0.112)#85 | 0.15%(+0.019)#4,341 |
| 86. | Allentown Borough | 0.17% | 0.054%(+0.111)#86 | 0.15%(+0.018)#4,349 |
| 87. | Matawan Borough | 0.16% | 0.054%(+0.103)#87 | 0.15%(+0.010)#4,441 |
| 88. | Old Tappan Borough | 0.15% | 0.054%(+0.100)#88 | 0.15%(+0.006)#4,491 |
| 89. | Riverdale Borough | 0.15% | 0.054%(+0.093)#89 | 0.15%(-0.000)#4,566 |
| 90. | Ridgefield Park | 0.14% | 0.054%(+0.091)#90 | 0.15%(-0.003)#4,598 |
| 91. | Lake Hopatcong | 0.14% | 0.054%(+0.089)#91 | 0.15%(-0.004)#4,612 |
| 92. | Barrington Borough | 0.14% | 0.054%(+0.089)#92 | 0.15%(-0.005)#4,620 |
| 93. | Woodbine Borough | 0.13% | 0.054%(+0.079)#93 | 0.15%(-0.015)#4,745 |
| 94. | Newton | 0.13% | 0.054%(+0.078)#94 | 0.15%(-0.016)#4,758 |
| 95. | Bergenfield Borough | 0.12% | 0.054%(+0.067)#95 | 0.15%(-0.027)#4,906 |
| 96. | New Brunswick | 0.12% | 0.054%(+0.065)#96 | 0.15%(-0.029)#4,935 |
| 97. | Sicklerville | 0.12% | 0.054%(+0.062)#97 | 0.15%(-0.032)#4,975 |
| 98. | Hillsborough | 0.11% | 0.054%(+0.060)#98 | 0.15%(-0.033)#4,991 |
| 99. | Somerville Borough | 0.11% | 0.054%(+0.058)#99 | 0.15%(-0.035)#5,021 |
| 100. | Brookdale | 0.097% | 0.054%(+0.043)#100 | 0.15%(-0.050)#5,240 |
Common Questions
What are the Top 10 Cities with the Highest Percentage of Northern European Population in New Jersey?
Top 10 Cities with the Highest Percentage of Northern European Population in New Jersey are:
#1
2.84%
#2
2.65%
#3
1.55%
#4
1.45%
#5
0.97%
#6
0.68%
#7
0.64%
#8
0.56%
#9
0.55%
#10
0.44%
What city has the Highest Percentage of Northern European Population in New Jersey?
Lake Telemark has the Highest Percentage of Northern European Population in New Jersey with 2.84%.
What is the Percentage of Northern European Population in the State of New Jersey?
Percentage of Northern European Population in New Jersey is 0.054%.
What is the Percentage of Northern European Population in the United States?
Percentage of Northern European Population in the United States is 0.15%.