Cities with the Highest Percentage of Immigrants from Iran in New Jersey
RELATED REPORTS & OPTIONS
Iran
New Jersey
Compare Cities
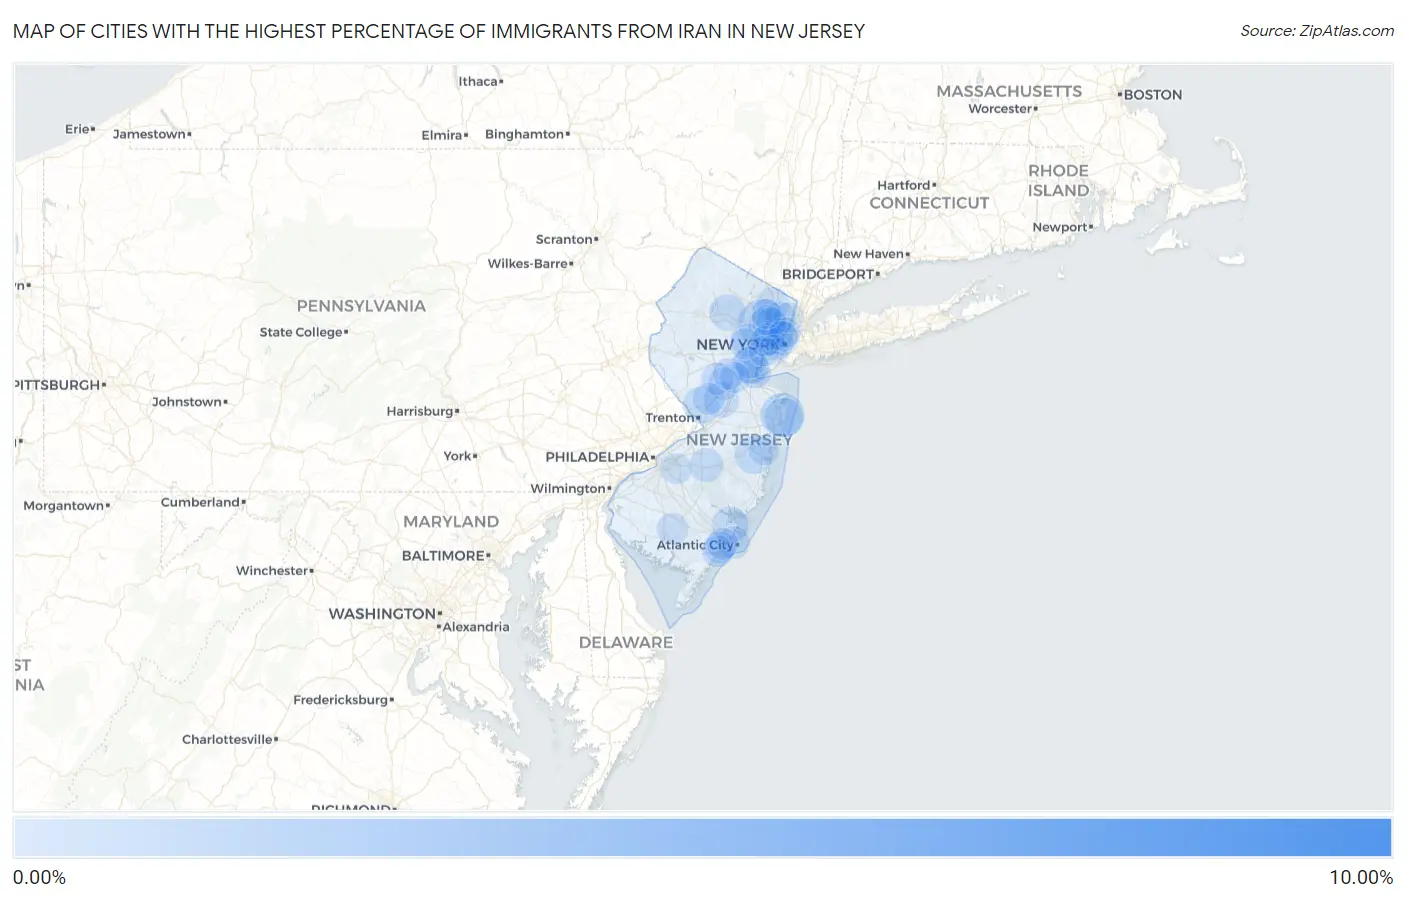
Map of Cities with the Highest Percentage of Immigrants from Iran in New Jersey
0.00%
10.00%
Cities with the Highest Percentage of Immigrants from Iran in New Jersey
| City | Iran | vs State | vs National | |
| 1. | New Vernon | 8.52% | 0.053%(+8.46)#-1 | 0.12%(+8.40)#0 |
| 2. | Englewood Cliffs Borough | 2.52% | 0.053%(+2.47)#140 | 0.12%(+2.41)#876 |
| 3. | The Hills | 1.27% | 0.053%(+1.22)#141 | 0.12%(+1.15)#877 |
| 4. | Saddle River Borough | 1.19% | 0.053%(+1.14)#142 | 0.12%(+1.07)#878 |
| 5. | Essex Fells Borough | 1.18% | 0.053%(+1.13)#255 | 0.12%(+1.06)#2,476 |
| 6. | Alpine Borough | 1.10% | 0.053%(+1.05)#256 | 0.12%(+0.986)#2,477 |
| 7. | Demarest Borough | 1.10% | 0.053%(+1.04)#257 | 0.12%(+0.977)#2,478 |
| 8. | Upper Montclair | 0.97% | 0.053%(+0.919)#289 | 0.12%(+0.854)#2,956 |
| 9. | Wanamassa | 0.71% | 0.053%(+0.660)#290 | 0.12%(+0.595)#2,957 |
| 10. | Liberty Corner | 0.68% | 0.053%(+0.629)#291 | 0.12%(+0.564)#2,958 |
| 11. | Haworth Borough | 0.57% | 0.053%(+0.515)#292 | 0.12%(+0.450)#2,959 |
| 12. | Emerson Borough | 0.52% | 0.053%(+0.468)#293 | 0.12%(+0.404)#2,960 |
| 13. | Pleasantdale | 0.49% | 0.053%(+0.434)#294 | 0.12%(+0.369)#2,961 |
| 14. | Gillette | 0.47% | 0.053%(+0.417)#295 | 0.12%(+0.352)#2,962 |
| 15. | Raritan Borough | 0.47% | 0.053%(+0.416)#296 | 0.12%(+0.352)#2,963 |
| 16. | Asbury Park | 0.47% | 0.053%(+0.412)#317 | 0.12%(+0.348)#3,425 |
| 17. | Paramus Borough | 0.46% | 0.053%(+0.409)#318 | 0.12%(+0.345)#3,426 |
| 18. | Kean University | 0.46% | 0.053%(+0.404)#319 | 0.12%(+0.339)#3,427 |
| 19. | Oakland Borough | 0.46% | 0.053%(+0.402)#320 | 0.12%(+0.337)#3,428 |
| 20. | Wood Ridge Borough | 0.44% | 0.053%(+0.387)#321 | 0.12%(+0.323)#3,429 |
| 21. | Florham Park Borough | 0.44% | 0.053%(+0.384)#322 | 0.12%(+0.320)#3,430 |
| 22. | Holiday City Berkeley | 0.40% | 0.053%(+0.350)#366 | 0.12%(+0.285)#4,682 |
| 23. | Northvale Borough | 0.40% | 0.053%(+0.345)#367 | 0.12%(+0.280)#4,683 |
| 24. | Landing | 0.37% | 0.053%(+0.321)#368 | 0.12%(+0.257)#4,774 |
| 25. | Edgewater Borough | 0.37% | 0.053%(+0.315)#369 | 0.12%(+0.250)#4,775 |
| 26. | Smithville | 0.35% | 0.053%(+0.297)#370 | 0.12%(+0.232)#4,776 |
| 27. | Lawrenceville | 0.35% | 0.053%(+0.292)#371 | 0.12%(+0.228)#4,777 |
| 28. | Millstone Borough | 0.34% | 0.053%(+0.289)#372 | 0.12%(+0.224)#4,778 |
| 29. | Iselin | 0.34% | 0.053%(+0.287)#373 | 0.12%(+0.222)#4,779 |
| 30. | Hi Nella Borough | 0.34% | 0.053%(+0.286)#374 | 0.12%(+0.222)#4,780 |
| 31. | Pines Lake | 0.33% | 0.053%(+0.276)#375 | 0.12%(+0.211)#4,781 |
| 32. | White Meadow Lake | 0.33% | 0.053%(+0.272)#376 | 0.12%(+0.207)#4,782 |
| 33. | Watsessing | 0.32% | 0.053%(+0.270)#377 | 0.12%(+0.206)#4,783 |
| 34. | Parsippany | 0.32% | 0.053%(+0.263)#378 | 0.12%(+0.198)#4,784 |
| 35. | Netcong Borough | 0.32% | 0.053%(+0.262)#379 | 0.12%(+0.198)#4,785 |
| 36. | Princeton Meadows | 0.29% | 0.053%(+0.235)#380 | 0.12%(+0.171)#4,786 |
| 37. | Franklin Lakes Borough | 0.28% | 0.053%(+0.228)#381 | 0.12%(+0.163)#4,787 |
| 38. | Rutherford Borough | 0.27% | 0.053%(+0.213)#382 | 0.12%(+0.148)#4,788 |
| 39. | Oradell Borough | 0.24% | 0.053%(+0.190)#383 | 0.12%(+0.125)#4,789 |
| 40. | Woodland Park Borough | 0.23% | 0.053%(+0.180)#384 | 0.12%(+0.115)#4,790 |
| 41. | Ramsey Borough | 0.22% | 0.053%(+0.170)#385 | 0.12%(+0.106)#4,791 |
| 42. | Avon By The Sea Borough | 0.22% | 0.053%(+0.170)#386 | 0.12%(+0.105)#4,792 |
| 43. | Leisuretowne | 0.22% | 0.053%(+0.165)#387 | 0.12%(+0.100)#4,793 |
| 44. | Basking Ridge | 0.20% | 0.053%(+0.149)#388 | 0.12%(+0.084)#4,794 |
| 45. | Brielle Borough | 0.20% | 0.053%(+0.148)#389 | 0.12%(+0.084)#4,795 |
| 46. | Highland Park Borough | 0.19% | 0.053%(+0.133)#390 | 0.12%(+0.069)#4,796 |
| 47. | Fair Lawn Borough | 0.18% | 0.053%(+0.127)#391 | 0.12%(+0.062)#4,797 |
| 48. | Tenafly Borough | 0.17% | 0.053%(+0.116)#392 | 0.12%(+0.052)#4,798 |
| 49. | Harrington Park Borough | 0.17% | 0.053%(+0.112)#393 | 0.12%(+0.048)#4,799 |
| 50. | Brookdale | 0.16% | 0.053%(+0.111)#394 | 0.12%(+0.047)#4,800 |
| 51. | Woodbridge | 0.16% | 0.053%(+0.109)#395 | 0.12%(+0.044)#4,801 |
| 52. | Ridgewood | 0.16% | 0.053%(+0.108)#396 | 0.12%(+0.043)#4,802 |
| 53. | Hoboken | 0.16% | 0.053%(+0.105)#397 | 0.12%(+0.040)#4,803 |
| 54. | Short Hills | 0.15% | 0.053%(+0.099)#398 | 0.12%(+0.034)#4,804 |
| 55. | Rumson Borough | 0.15% | 0.053%(+0.098)#399 | 0.12%(+0.033)#4,805 |
| 56. | Atlantic City | 0.13% | 0.053%(+0.074)#400 | 0.12%(+0.009)#4,806 |
| 57. | Bound Brook Borough | 0.13% | 0.053%(+0.073)#401 | 0.12%(+0.008)#4,807 |
| 58. | Fort Lee Borough | 0.13% | 0.053%(+0.072)#402 | 0.12%(+0.007)#4,808 |
| 59. | Old Tappan Borough | 0.12% | 0.053%(+0.066)#403 | 0.12%(+0.001)#4,809 |
| 60. | Franklin Park | 0.12% | 0.053%(+0.066)#404 | 0.12%(+0.001)#4,810 |
| 61. | Maywood Borough | 0.11% | 0.053%(+0.056)#405 | 0.12%(-0.009)#4,811 |
| 62. | Blackwells Mills | 0.11% | 0.053%(+0.056)#406 | 0.12%(-0.009)#4,812 |
| 63. | Vineland | 0.10% | 0.053%(+0.050)#407 | 0.12%(-0.015)#4,813 |
| 64. | Glen Ridge Borough | 0.10% | 0.053%(+0.049)#408 | 0.12%(-0.016)#4,814 |
| 65. | Princeton | 0.10% | 0.053%(+0.048)#409 | 0.12%(-0.016)#4,815 |
| 66. | Whippany | 0.10% | 0.053%(+0.048)#410 | 0.12%(-0.017)#4,816 |
| 67. | Glassboro Borough | 0.100% | 0.053%(+0.046)#411 | 0.12%(-0.018)#4,817 |
| 68. | Jersey City | 0.090% | 0.053%(+0.036)#412 | 0.12%(-0.029)#4,818 |
| 69. | Secaucus | 0.088% | 0.053%(+0.035)#413 | 0.12%(-0.030)#4,819 |
| 70. | Linwood | 0.086% | 0.053%(+0.033)#414 | 0.12%(-0.032)#4,820 |
| 71. | Clifton | 0.086% | 0.053%(+0.033)#415 | 0.12%(-0.032)#4,821 |
| 72. | Somers Point | 0.086% | 0.053%(+0.032)#416 | 0.12%(-0.032)#5,474 |
| 73. | Perth Amboy | 0.083% | 0.053%(+0.030)#417 | 0.12%(-0.035)#5,475 |
| 74. | Northfield | 0.083% | 0.053%(+0.030)#418 | 0.12%(-0.035)#5,476 |
| 75. | Hackensack | 0.081% | 0.053%(+0.027)#419 | 0.12%(-0.037)#5,477 |
| 76. | Colonia | 0.075% | 0.053%(+0.022)#420 | 0.12%(-0.043)#5,478 |
| 77. | Somerset | 0.074% | 0.053%(+0.021)#421 | 0.12%(-0.044)#5,479 |
| 78. | Metuchen Borough | 0.060% | 0.053%(+0.007)#422 | 0.12%(-0.058)#5,480 |
| 79. | Springdale | 0.059% | 0.053%(+0.006)#423 | 0.12%(-0.059)#5,481 |
| 80. | Summit | 0.058% | 0.053%(+0.004)#424 | 0.12%(-0.061)#5,482 |
| 81. | Harrison | 0.057% | 0.053%(+0.004)#425 | 0.12%(-0.061)#5,483 |
| 82. | Leonia Borough | 0.054% | 0.053%(+0.000)#426 | 0.12%(-0.064)#5,484 |
| 83. | Preakness | 0.054% | 0.053%(+0.000)#427 | 0.12%(-0.064)#5,485 |
| 84. | New Brunswick | 0.048% | 0.053%(-0.005)#428 | 0.12%(-0.070)#5,486 |
| 85. | Englewood | 0.041% | 0.053%(-0.012)#429 | 0.12%(-0.077)#5,487 |
| 86. | Cliffside Park Borough | 0.035% | 0.053%(-0.018)#430 | 0.12%(-0.083)#5,488 |
| 87. | Newark | 0.031% | 0.053%(-0.023)#431 | 0.12%(-0.088)#5,489 |
| 88. | West New York | 0.025% | 0.053%(-0.029)#432 | 0.12%(-0.093)#5,490 |
| 89. | Passaic | 0.023% | 0.053%(-0.031)#433 | 0.12%(-0.095)#5,491 |
| 90. | Toms River | 0.022% | 0.053%(-0.032)#434 | 0.12%(-0.097)#5,492 |
| 91. | Bayonne | 0.016% | 0.053%(-0.038)#435 | 0.12%(-0.103)#5,493 |
| 92. | Union City | 0.013% | 0.053%(-0.040)#436 | 0.12%(-0.105)#5,494 |
| 93. | Elizabeth | 0.0074% | 0.053%(-0.046)#437 | 0.12%(-0.111)#5,495 |
| 94. | Paterson | 0.0051% | 0.053%(-0.048)#438 | 0.12%(-0.113)#5,496 |
Common Questions
What are the Top 10 Cities with the Highest Percentage of Immigrants from Iran in New Jersey?
Top 10 Cities with the Highest Percentage of Immigrants from Iran in New Jersey are:
#1
0.97%
#2
0.71%
#3
0.47%
#4
0.40%
#5
0.35%
#6
0.35%
#7
0.34%
#8
0.33%
#9
0.29%
#10
0.22%
What city has the Highest Percentage of Immigrants from Iran in New Jersey?
Upper Montclair has the Highest Percentage of Immigrants from Iran in New Jersey with 0.97%.
What is the Percentage of Immigrants from Iran in the State of New Jersey?
Percentage of Immigrants from Iran in New Jersey is 0.053%.
What is the Percentage of Immigrants from Iran in the United States?
Percentage of Immigrants from Iran in the United States is 0.12%.