Cities with the Largest Cherokee Community in New Jersey
RELATED REPORTS & OPTIONS
Cherokee
New Jersey
Compare Cities
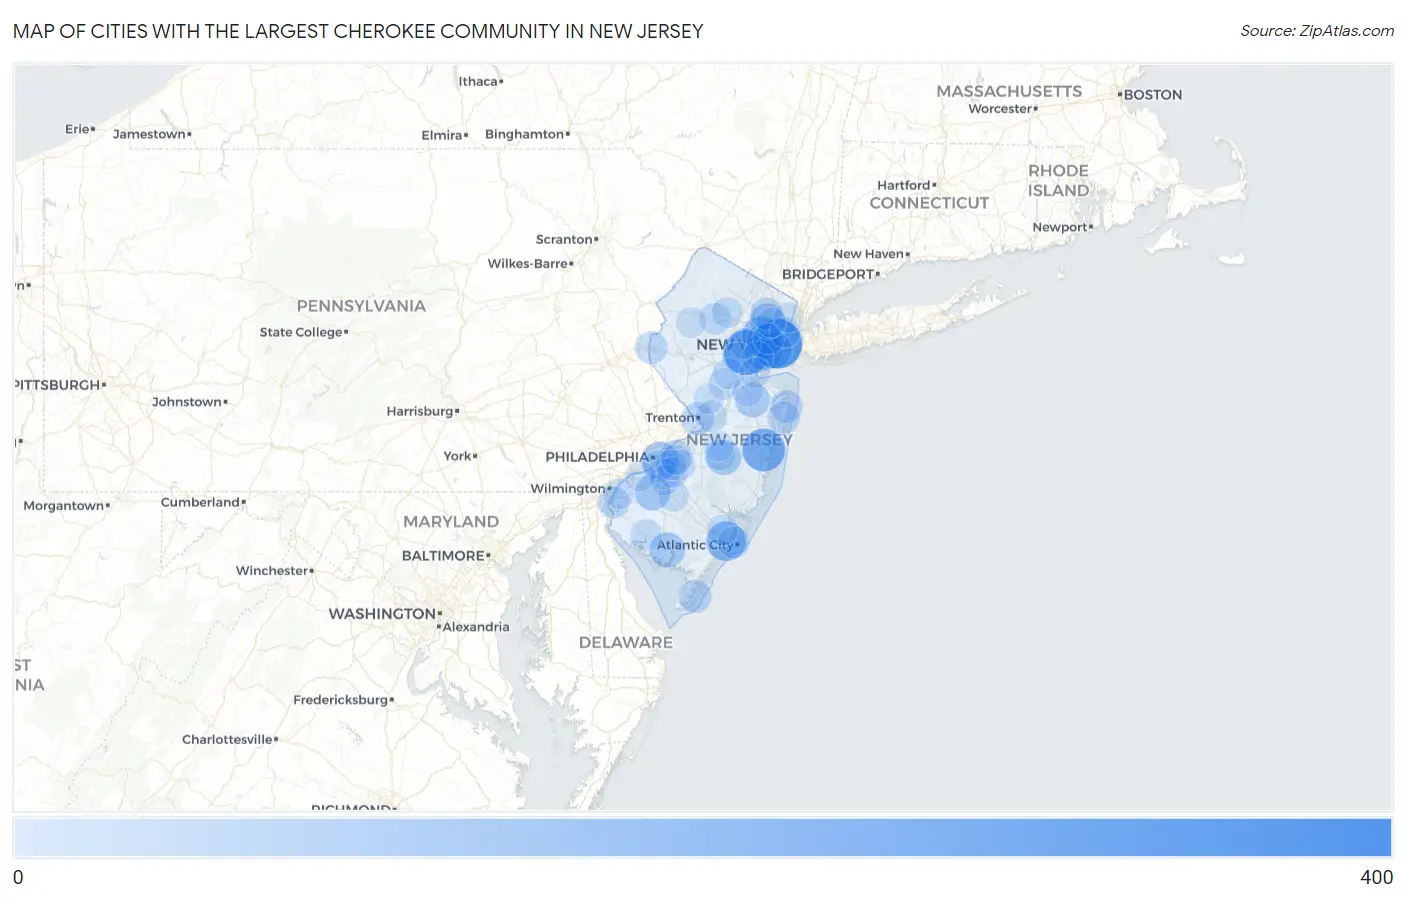
Map of Cities with the Largest Cherokee Community in New Jersey
0
400
Cities with the Largest Cherokee Community in New Jersey
| City | Cherokee | vs State | vs National | |
| 1. | Jersey City | 350 | 9,740(3.59%)#1 | 1,150,610(0.03%)#395 |
| 2. | Westfield | 276 | 9,740(2.83%)#2 | 1,150,610(0.02%)#528 |
| 3. | Toms River | 234 | 9,740(2.40%)#3 | 1,150,610(0.02%)#645 |
| 4. | Pleasantville | 177 | 9,740(1.82%)#4 | 1,150,610(0.02%)#895 |
| 5. | East Orange | 174 | 9,740(1.79%)#5 | 1,150,610(0.02%)#917 |
| 6. | Elizabeth | 151 | 9,740(1.55%)#6 | 1,150,610(0.01%)#1,063 |
| 7. | Newark | 136 | 9,740(1.40%)#7 | 1,150,610(0.01%)#1,201 |
| 8. | Camden | 129 | 9,740(1.32%)#8 | 1,150,610(0.01%)#1,270 |
| 9. | Bayonne | 126 | 9,740(1.29%)#9 | 1,150,610(0.01%)#1,293 |
| 10. | Fort Lee Borough | 118 | 9,740(1.21%)#10 | 1,150,610(0.01%)#1,388 |
| 11. | Sicklerville | 116 | 9,740(1.19%)#11 | 1,150,610(0.01%)#1,408 |
| 12. | Richwood | 111 | 9,740(1.14%)#12 | 1,150,610(0.01%)#1,476 |
| 13. | Clifton | 106 | 9,740(1.09%)#13 | 1,150,610(0.01%)#1,542 |
| 14. | Country Lake Estates | 103 | 9,740(1.06%)#14 | 1,150,610(0.01%)#1,605 |
| 15. | Laurel Lake | 103 | 9,740(1.06%)#15 | 1,150,610(0.01%)#1,606 |
| 16. | Robertsville | 94 | 9,740(0.97%)#16 | 1,150,610(0.01%)#1,749 |
| 17. | Tinton Falls Borough | 91 | 9,740(0.93%)#17 | 1,150,610(0.01%)#1,800 |
| 18. | Glassboro Borough | 89 | 9,740(0.91%)#18 | 1,150,610(0.01%)#1,833 |
| 19. | Middlesex Borough | 81 | 9,740(0.83%)#19 | 1,150,610(0.01%)#1,978 |
| 20. | Robbinsville Center | 77 | 9,740(0.79%)#20 | 1,150,610(0.01%)#2,082 |
| 21. | Pine Brook | 71 | 9,740(0.73%)#21 | 1,150,610(0.01%)#2,237 |
| 22. | Hasbrouck Heights Borough | 70 | 9,740(0.72%)#22 | 1,150,610(0.01%)#2,249 |
| 23. | Barrington Borough | 67 | 9,740(0.69%)#23 | 1,150,610(0.01%)#2,349 |
| 24. | North Wildwood | 65 | 9,740(0.67%)#24 | 1,150,610(0.01%)#2,419 |
| 25. | Trenton | 62 | 9,740(0.64%)#25 | 1,150,610(0.01%)#2,494 |
| 26. | South Dennis | 61 | 9,740(0.63%)#26 | 1,150,610(0.01%)#2,560 |
| 27. | Long Branch | 59 | 9,740(0.61%)#27 | 1,150,610(0.01%)#2,603 |
| 28. | Moorestown Lenola | 59 | 9,740(0.61%)#28 | 1,150,610(0.01%)#2,613 |
| 29. | New Milford Borough | 58 | 9,740(0.60%)#29 | 1,150,610(0.01%)#2,644 |
| 30. | Asbury Park | 58 | 9,740(0.60%)#30 | 1,150,610(0.01%)#2,646 |
| 31. | Phillipsburg | 58 | 9,740(0.60%)#31 | 1,150,610(0.01%)#2,647 |
| 32. | Paterson | 54 | 9,740(0.55%)#32 | 1,150,610(0.00%)#2,783 |
| 33. | Pine Hill Borough | 54 | 9,740(0.55%)#33 | 1,150,610(0.00%)#2,805 |
| 34. | Hawthorne Borough | 52 | 9,740(0.53%)#34 | 1,150,610(0.00%)#2,894 |
| 35. | Eatontown Borough | 51 | 9,740(0.52%)#35 | 1,150,610(0.00%)#2,946 |
| 36. | Pemberton Borough | 50 | 9,740(0.51%)#36 | 1,150,610(0.00%)#3,021 |
| 37. | Mckee | 49 | 9,740(0.50%)#37 | 1,150,610(0.00%)#3,046 |
| 38. | Westmont | 48 | 9,740(0.49%)#38 | 1,150,610(0.00%)#3,097 |
| 39. | Pennsville | 48 | 9,740(0.49%)#39 | 1,150,610(0.00%)#3,101 |
| 40. | Hewitt | 48 | 9,740(0.49%)#40 | 1,150,610(0.00%)#3,120 |
| 41. | Linden | 45 | 9,740(0.46%)#41 | 1,150,610(0.00%)#3,210 |
| 42. | Atlantic City | 44 | 9,740(0.45%)#42 | 1,150,610(0.00%)#3,265 |
| 43. | Gloucester City | 44 | 9,740(0.45%)#43 | 1,150,610(0.00%)#3,286 |
| 44. | Hopatcong Borough | 43 | 9,740(0.44%)#44 | 1,150,610(0.00%)#3,338 |
| 45. | Hightstown Borough | 43 | 9,740(0.44%)#45 | 1,150,610(0.00%)#3,350 |
| 46. | Kenvil | 42 | 9,740(0.43%)#46 | 1,150,610(0.00%)#3,410 |
| 47. | Bridgeton | 40 | 9,740(0.41%)#47 | 1,150,610(0.00%)#3,489 |
| 48. | Franklin Park | 38 | 9,740(0.39%)#48 | 1,150,610(0.00%)#3,624 |
| 49. | Hamilton Square | 38 | 9,740(0.39%)#49 | 1,150,610(0.00%)#3,628 |
| 50. | Lindenwold Borough | 37 | 9,740(0.38%)#50 | 1,150,610(0.00%)#3,674 |
| 51. | Pompton Lakes Borough | 37 | 9,740(0.38%)#51 | 1,150,610(0.00%)#3,682 |
| 52. | Summit | 36 | 9,740(0.37%)#52 | 1,150,610(0.00%)#3,732 |
| 53. | Browns Mills | 35 | 9,740(0.36%)#53 | 1,150,610(0.00%)#3,814 |
| 54. | Hillsborough | 34 | 9,740(0.35%)#54 | 1,150,610(0.00%)#3,876 |
| 55. | Leonia Borough | 34 | 9,740(0.35%)#55 | 1,150,610(0.00%)#3,894 |
| 56. | Carlstadt Borough | 33 | 9,740(0.34%)#56 | 1,150,610(0.00%)#3,970 |
| 57. | Lodi Borough | 32 | 9,740(0.33%)#57 | 1,150,610(0.00%)#4,017 |
| 58. | Harrison | 32 | 9,740(0.33%)#58 | 1,150,610(0.00%)#4,019 |
| 59. | Pomona | 32 | 9,740(0.33%)#59 | 1,150,610(0.00%)#4,032 |
| 60. | Somerset | 31 | 9,740(0.32%)#60 | 1,150,610(0.00%)#4,088 |
| 61. | White Meadow Lake | 31 | 9,740(0.32%)#61 | 1,150,610(0.00%)#4,105 |
| 62. | Gibbsboro Borough | 31 | 9,740(0.32%)#62 | 1,150,610(0.00%)#4,123 |
| 63. | Highland Park Borough | 30 | 9,740(0.31%)#63 | 1,150,610(0.00%)#4,152 |
| 64. | Metuchen Borough | 27 | 9,740(0.28%)#64 | 1,150,610(0.00%)#4,425 |
| 65. | Bound Brook Borough | 27 | 9,740(0.28%)#65 | 1,150,610(0.00%)#4,432 |
| 66. | Plainfield | 26 | 9,740(0.27%)#66 | 1,150,610(0.00%)#4,510 |
| 67. | Williamstown | 26 | 9,740(0.27%)#67 | 1,150,610(0.00%)#4,526 |
| 68. | Marlton | 26 | 9,740(0.27%)#68 | 1,150,610(0.00%)#4,532 |
| 69. | Carneys Point | 26 | 9,740(0.27%)#69 | 1,150,610(0.00%)#4,538 |
| 70. | Milltown Borough | 25 | 9,740(0.26%)#70 | 1,150,610(0.00%)#4,643 |
| 71. | Gouldtown | 25 | 9,740(0.26%)#71 | 1,150,610(0.00%)#4,684 |
| 72. | Sayreville Borough | 24 | 9,740(0.25%)#72 | 1,150,610(0.00%)#4,711 |
| 73. | West Long Branch Borough | 24 | 9,740(0.25%)#73 | 1,150,610(0.00%)#4,741 |
| 74. | Glendora | 24 | 9,740(0.25%)#74 | 1,150,610(0.00%)#4,750 |
| 75. | Ledgewood | 24 | 9,740(0.25%)#75 | 1,150,610(0.00%)#4,756 |
| 76. | Mount Ephraim Borough | 24 | 9,740(0.25%)#76 | 1,150,610(0.00%)#4,760 |
| 77. | Blackwood | 24 | 9,740(0.25%)#77 | 1,150,610(0.00%)#4,761 |
| 78. | Netcong Borough | 24 | 9,740(0.25%)#78 | 1,150,610(0.00%)#4,766 |
| 79. | Perth Amboy | 23 | 9,740(0.24%)#79 | 1,150,610(0.00%)#4,818 |
| 80. | Echelon | 23 | 9,740(0.24%)#80 | 1,150,610(0.00%)#4,844 |
| 81. | Hackettstown | 23 | 9,740(0.24%)#81 | 1,150,610(0.00%)#4,853 |
| 82. | Barclay | 23 | 9,740(0.24%)#82 | 1,150,610(0.00%)#4,879 |
| 83. | Old Bridge | 22 | 9,740(0.23%)#83 | 1,150,610(0.00%)#4,936 |
| 84. | Oakland Borough | 22 | 9,740(0.23%)#84 | 1,150,610(0.00%)#4,951 |
| 85. | Lincoln Park Borough | 22 | 9,740(0.23%)#85 | 1,150,610(0.00%)#4,957 |
| 86. | Princeton | 21 | 9,740(0.22%)#86 | 1,150,610(0.00%)#5,057 |
| 87. | Guttenberg | 21 | 9,740(0.22%)#87 | 1,150,610(0.00%)#5,079 |
| 88. | Ramblewood | 21 | 9,740(0.22%)#88 | 1,150,610(0.00%)#5,102 |
| 89. | Gibbstown | 21 | 9,740(0.22%)#89 | 1,150,610(0.00%)#5,116 |
| 90. | Roselle Borough | 20 | 9,740(0.21%)#90 | 1,150,610(0.00%)#5,195 |
| 91. | Keyport Borough | 20 | 9,740(0.21%)#91 | 1,150,610(0.00%)#5,216 |
| 92. | Sussex Borough | 20 | 9,740(0.21%)#92 | 1,150,610(0.00%)#5,271 |
| 93. | Passaic | 19 | 9,740(0.20%)#93 | 1,150,610(0.00%)#5,306 |
| 94. | Collingswood Borough | 19 | 9,740(0.20%)#94 | 1,150,610(0.00%)#5,324 |
| 95. | Englewood | 18 | 9,740(0.18%)#95 | 1,150,610(0.00%)#5,455 |
| 96. | East Rutherford Borough | 17 | 9,740(0.17%)#96 | 1,150,610(0.00%)#5,653 |
| 97. | Kinnelon Borough | 17 | 9,740(0.17%)#97 | 1,150,610(0.00%)#5,654 |
| 98. | Pitman Borough | 17 | 9,740(0.17%)#98 | 1,150,610(0.00%)#5,663 |
| 99. | Mcguire Afb | 17 | 9,740(0.17%)#99 | 1,150,610(0.00%)#5,689 |
| 100. | Fieldsboro Borough | 17 | 9,740(0.17%)#100 | 1,150,610(0.00%)#5,754 |
Common Questions
What are the Top 10 Cities with the Largest Cherokee Community in New Jersey?
Top 10 Cities with the Largest Cherokee Community in New Jersey are:
#1
350
#2
276
#3
234
#4
177
#5
174
#6
151
#7
136
#8
129
#9
126
#10
111
What city has the Largest Cherokee Community in New Jersey?
Jersey City has the Largest Cherokee Community in New Jersey with 350.
What is the Total Cherokee Population in the State of New Jersey?
Total Cherokee Population in New Jersey is 9,740.
What is the Total Cherokee Population in the United States?
Total Cherokee Population in the United States is 1,150,610.