Pennington borough, NJ Map & Demographics
Pennington borough Overview
$84,590
PER CAPITA INCOME
$195,926
AVG FAMILY INCOME
$166,957
AVG HOUSEHOLD INCOME
10.9%
WAGE / INCOME GAP [ % ]
89.1¢/ $1
WAGE / INCOME GAP [ $ ]
0.41
INEQUALITY / GINI INDEX
2,780
TOTAL POPULATION
1,370
MALE POPULATION
1,410
FEMALE POPULATION
97.16
MALES / 100 FEMALES
102.92
FEMALES / 100 MALES
47.5
MEDIAN AGE
2.9
AVG FAMILY SIZE
2.4
AVG HOUSEHOLD SIZE
1,515
LABOR FORCE [ PEOPLE ]
66.3%
PERCENT IN LABOR FORCE
2.8%
UNEMPLOYMENT RATE
Income in Pennington borough
Income Overview in Pennington borough
Per Capita Income in Pennington borough is $84,590, while median incomes of families and households are $195,926 and $166,957 respectively.
| Characteristic | Number | Measure |
| Per Capita Income | 2,780 | $84,590 |
| Median Family Income | 804 | $195,926 |
| Mean Family Income | 804 | $239,161 |
| Median Household Income | 1,138 | $166,957 |
| Mean Household Income | 1,138 | $201,484 |
| Income Deficit | 804 | $0 |
| Wage / Income Gap (%) | 2,780 | 10.86% |
| Wage / Income Gap ($) | 2,780 | 89.14¢ per $1 |
| Gini / Inequality Index | 2,780 | 0.41 |
Earnings by Sex in Pennington borough
Average Earnings in Pennington borough are $79,006, $83,438 for men and $74,375 for women, a difference of 10.9%.
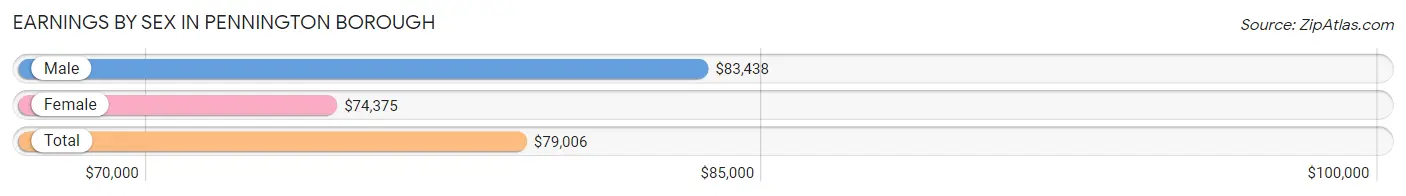
| Sex | Number | Average Earnings |
| Male | 873 (54.2%) | $83,438 |
| Female | 738 (45.8%) | $74,375 |
| Total | 1,611 (100.0%) | $79,006 |
Earnings by Sex by Income Bracket in Pennington borough
The most common earnings brackets in Pennington borough are $100,000+ for men (387 | 44.3%) and $100,000+ for women (252 | 34.2%).
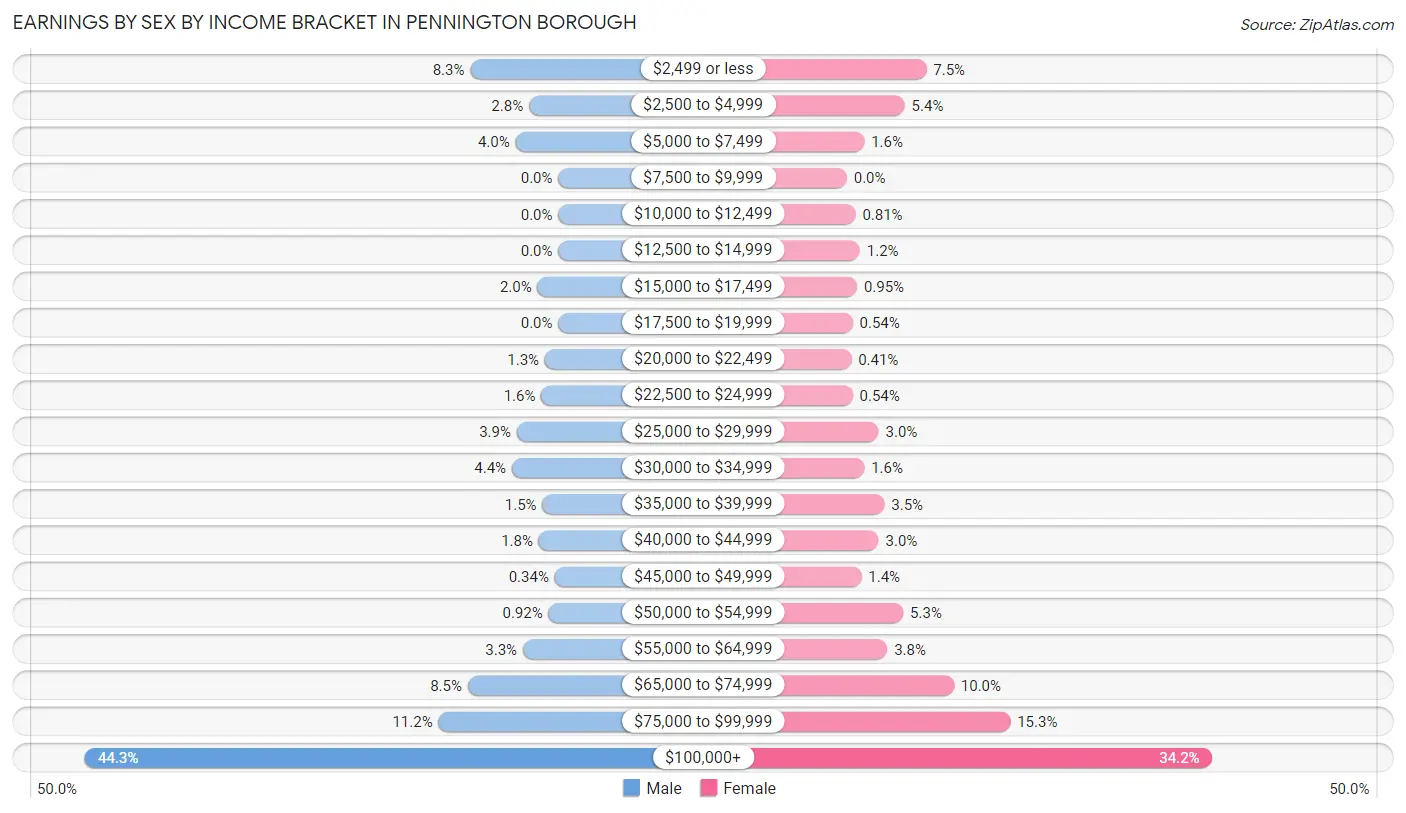
| Income | Male | Female |
| $2,499 or less | 72 (8.3%) | 55 (7.4%) |
| $2,500 to $4,999 | 24 (2.8%) | 40 (5.4%) |
| $5,000 to $7,499 | 35 (4.0%) | 12 (1.6%) |
| $7,500 to $9,999 | 0 (0.0%) | 0 (0.0%) |
| $10,000 to $12,499 | 0 (0.0%) | 6 (0.8%) |
| $12,500 to $14,999 | 0 (0.0%) | 9 (1.2%) |
| $15,000 to $17,499 | 17 (1.9%) | 7 (0.9%) |
| $17,500 to $19,999 | 0 (0.0%) | 4 (0.5%) |
| $20,000 to $22,499 | 11 (1.3%) | 3 (0.4%) |
| $22,500 to $24,999 | 14 (1.6%) | 4 (0.5%) |
| $25,000 to $29,999 | 34 (3.9%) | 22 (3.0%) |
| $30,000 to $34,999 | 38 (4.3%) | 12 (1.6%) |
| $35,000 to $39,999 | 13 (1.5%) | 26 (3.5%) |
| $40,000 to $44,999 | 16 (1.8%) | 22 (3.0%) |
| $45,000 to $49,999 | 3 (0.3%) | 10 (1.4%) |
| $50,000 to $54,999 | 8 (0.9%) | 39 (5.3%) |
| $55,000 to $64,999 | 29 (3.3%) | 28 (3.8%) |
| $65,000 to $74,999 | 74 (8.5%) | 74 (10.0%) |
| $75,000 to $99,999 | 98 (11.2%) | 113 (15.3%) |
| $100,000+ | 387 (44.3%) | 252 (34.2%) |
| Total | 873 (100.0%) | 738 (100.0%) |
Earnings by Sex by Educational Attainment in Pennington borough
Average earnings in Pennington borough are $102,386 for men and $81,111 for women, a difference of 20.8%. Men with an educational attainment of graduate degree enjoy the highest average annual earnings of $135,179, while those with college or associate's degree education earn the least with $81,389. Women with an educational attainment of high school diploma earn the most with the average annual earnings of $103,667, while those with college or associate's degree education have the smallest earnings of $41,071.
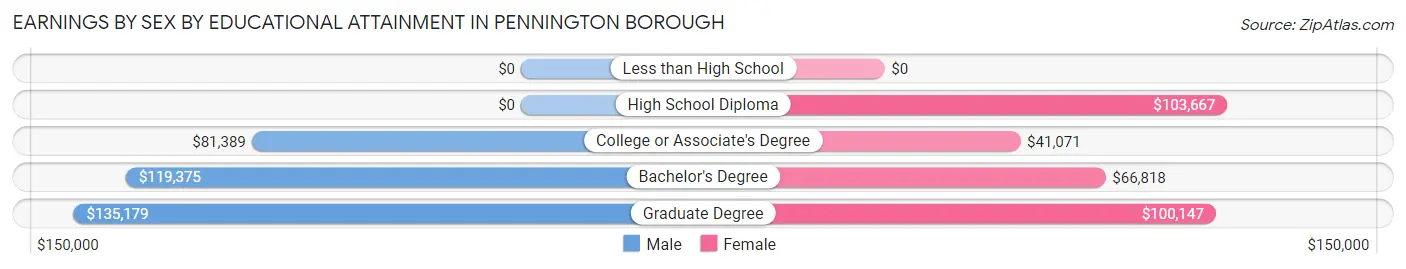
| Educational Attainment | Male Income | Female Income |
| Less than High School | - | - |
| High School Diploma | - | - |
| College or Associate's Degree | $81,389 | $41,071 |
| Bachelor's Degree | $119,375 | $66,818 |
| Graduate Degree | $135,179 | $100,147 |
| Total | $102,386 | $81,111 |
Family Income in Pennington borough
Family Income Brackets in Pennington borough
According to the Pennington borough family income data, there are 385 families falling into the $200,000+ income range, which is the most common income bracket and makes up 47.9% of all families.
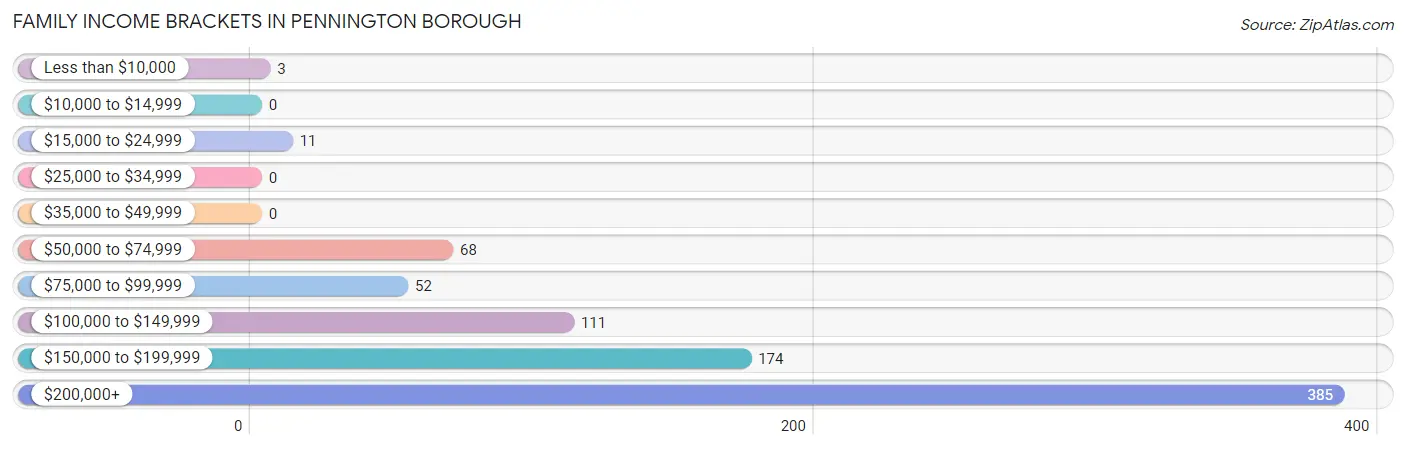
| Income Bracket | # Families | % Families |
| Less than $10,000 | 3 | 0.4% |
| $10,000 to $14,999 | 0 | 0.0% |
| $15,000 to $24,999 | 11 | 1.4% |
| $25,000 to $34,999 | 0 | 0.0% |
| $35,000 to $49,999 | 0 | 0.0% |
| $50,000 to $74,999 | 68 | 8.5% |
| $75,000 to $99,999 | 52 | 6.5% |
| $100,000 to $149,999 | 111 | 13.8% |
| $150,000 to $199,999 | 174 | 21.6% |
| $200,000+ | 385 | 47.9% |
Family Income by Famaliy Size in Pennington borough
5-person families (34 | 4.2%) account for the highest median family income in Pennington borough with $250,001 per family, while 2-person families (383 | 47.6%) have the highest median income of $83,282 per family member.
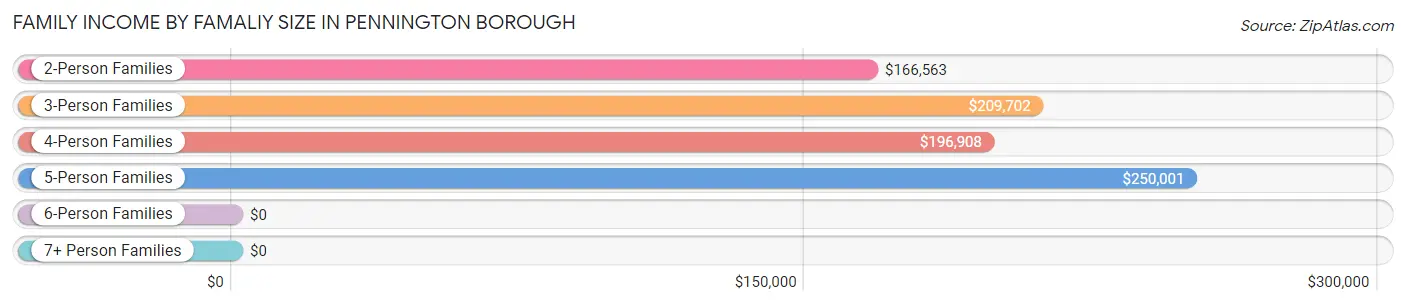
| Income Bracket | # Families | Median Income |
| 2-Person Families | 383 (47.6%) | $166,563 |
| 3-Person Families | 189 (23.5%) | $209,702 |
| 4-Person Families | 195 (24.2%) | $196,908 |
| 5-Person Families | 34 (4.2%) | $250,001 |
| 6-Person Families | 3 (0.4%) | $0 |
| 7+ Person Families | 0 (0.0%) | $0 |
| Total | 804 (100.0%) | $195,926 |
Family Income by Number of Earners in Pennington borough
The median family income in Pennington borough is $195,926, with families comprising 3+ earners (104) having the highest median family income of $240,000, while families with no earners (80) have the lowest median family income of $136,250, accounting for 12.9% and 10.0% of families, respectively.
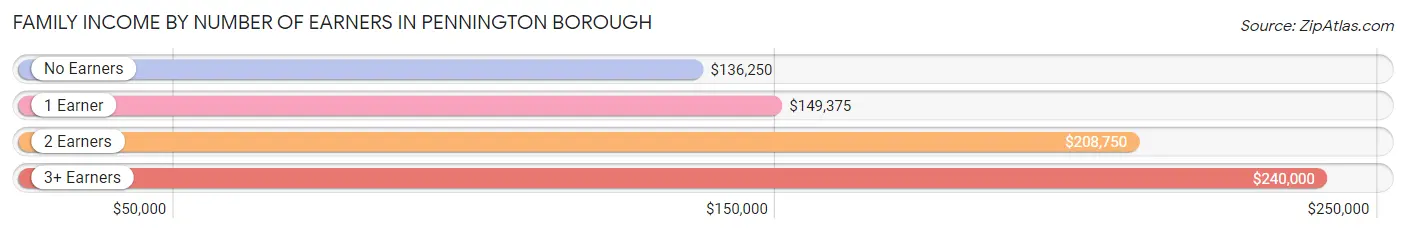
| Number of Earners | # Families | Median Income |
| No Earners | 80 (10.0%) | $136,250 |
| 1 Earner | 269 (33.5%) | $149,375 |
| 2 Earners | 351 (43.7%) | $208,750 |
| 3+ Earners | 104 (12.9%) | $240,000 |
| Total | 804 (100.0%) | $195,926 |
Household Income in Pennington borough
Household Income Brackets in Pennington borough
With 447 households falling in the category, the $200,000+ income range is the most frequent in Pennington borough, accounting for 39.3% of all households. In contrast, only 6 households (0.5%) fall into the $10,000 to $14,999 income bracket, making it the least populous group.
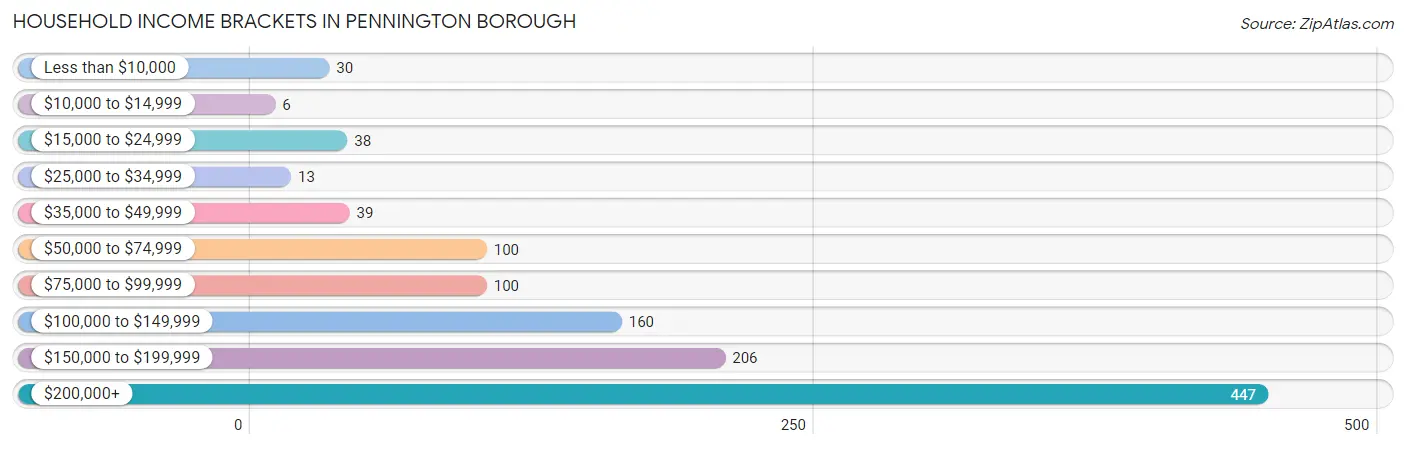
| Income Bracket | # Households | % Households |
| Less than $10,000 | 30 | 2.6% |
| $10,000 to $14,999 | 6 | 0.5% |
| $15,000 to $24,999 | 38 | 3.3% |
| $25,000 to $34,999 | 13 | 1.1% |
| $35,000 to $49,999 | 39 | 3.4% |
| $50,000 to $74,999 | 100 | 8.8% |
| $75,000 to $99,999 | 100 | 8.8% |
| $100,000 to $149,999 | 160 | 14.1% |
| $150,000 to $199,999 | 206 | 18.1% |
| $200,000+ | 447 | 39.3% |
Household Income by Householder Age in Pennington borough
The median household income in Pennington borough is $166,957, with the highest median household income of $205,500 found in the 45 to 64 years age bracket for the primary householder. A total of 464 households (40.8%) fall into this category.
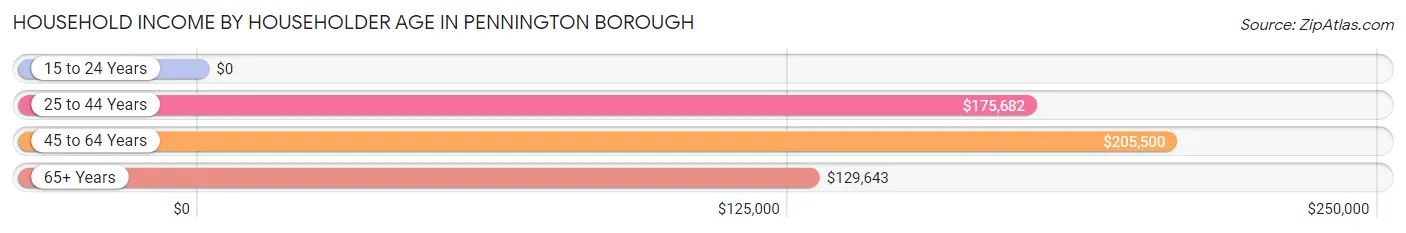
| Income Bracket | # Households | Median Income |
| 15 to 24 Years | 0 (0.0%) | $0 |
| 25 to 44 Years | 236 (20.7%) | $175,682 |
| 45 to 64 Years | 464 (40.8%) | $205,500 |
| 65+ Years | 438 (38.5%) | $129,643 |
| Total | 1,138 (100.0%) | $166,957 |
Poverty in Pennington borough
Income Below Poverty by Sex and Age in Pennington borough
With 3.1% poverty level for males and 3.6% for females among the residents of Pennington borough, 75 year old and over males and 16 and 17 year old females are the most vulnerable to poverty, with 8 males (14.3%) and 8 females (13.8%) in their respective age groups living below the poverty level.
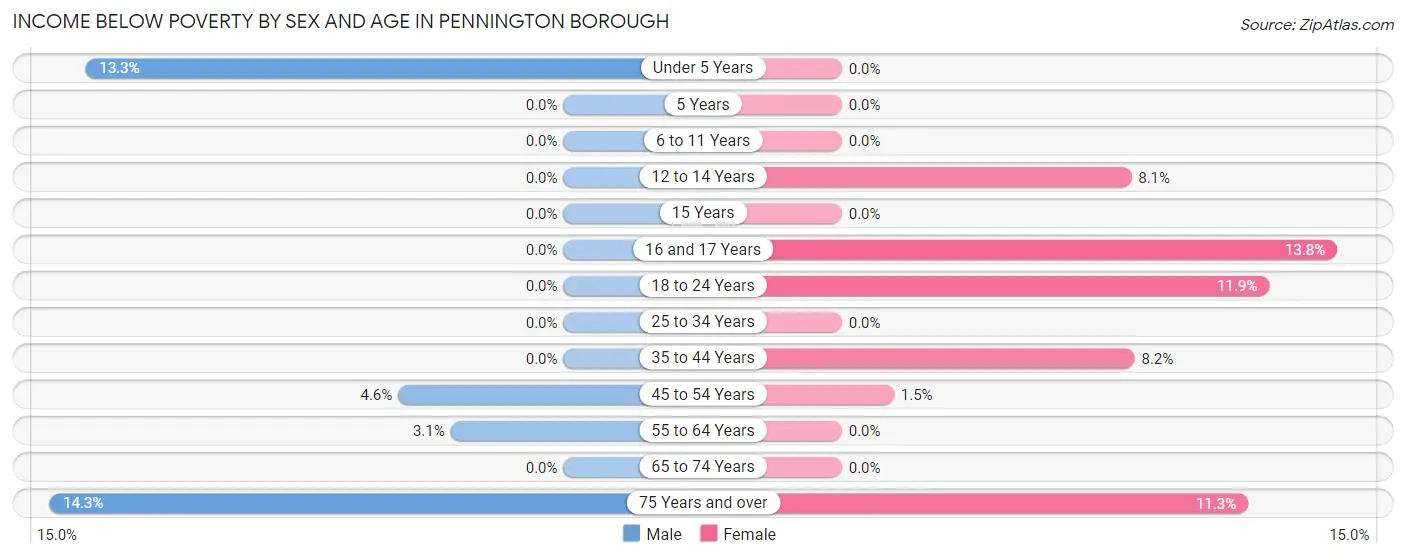
| Age Bracket | Male | Female |
| Under 5 Years | 17 (13.3%) | 0 (0.0%) |
| 5 Years | 0 (0.0%) | 0 (0.0%) |
| 6 to 11 Years | 0 (0.0%) | 0 (0.0%) |
| 12 to 14 Years | 0 (0.0%) | 5 (8.1%) |
| 15 Years | 0 (0.0%) | 0 (0.0%) |
| 16 and 17 Years | 0 (0.0%) | 8 (13.8%) |
| 18 to 24 Years | 0 (0.0%) | 5 (11.9%) |
| 25 to 34 Years | 0 (0.0%) | 0 (0.0%) |
| 35 to 44 Years | 0 (0.0%) | 11 (8.2%) |
| 45 to 54 Years | 11 (4.6%) | 3 (1.5%) |
| 55 to 64 Years | 6 (3.1%) | 0 (0.0%) |
| 65 to 74 Years | 0 (0.0%) | 0 (0.0%) |
| 75 Years and over | 8 (14.3%) | 19 (11.3%) |
| Total | 42 (3.1%) | 51 (3.6%) |
Income Above Poverty by Sex and Age in Pennington borough
According to the poverty statistics in Pennington borough, males aged 5 years and females aged under 5 years are the age groups that are most secure financially, with 100.0% of males and 100.0% of females in these age groups living above the poverty line.
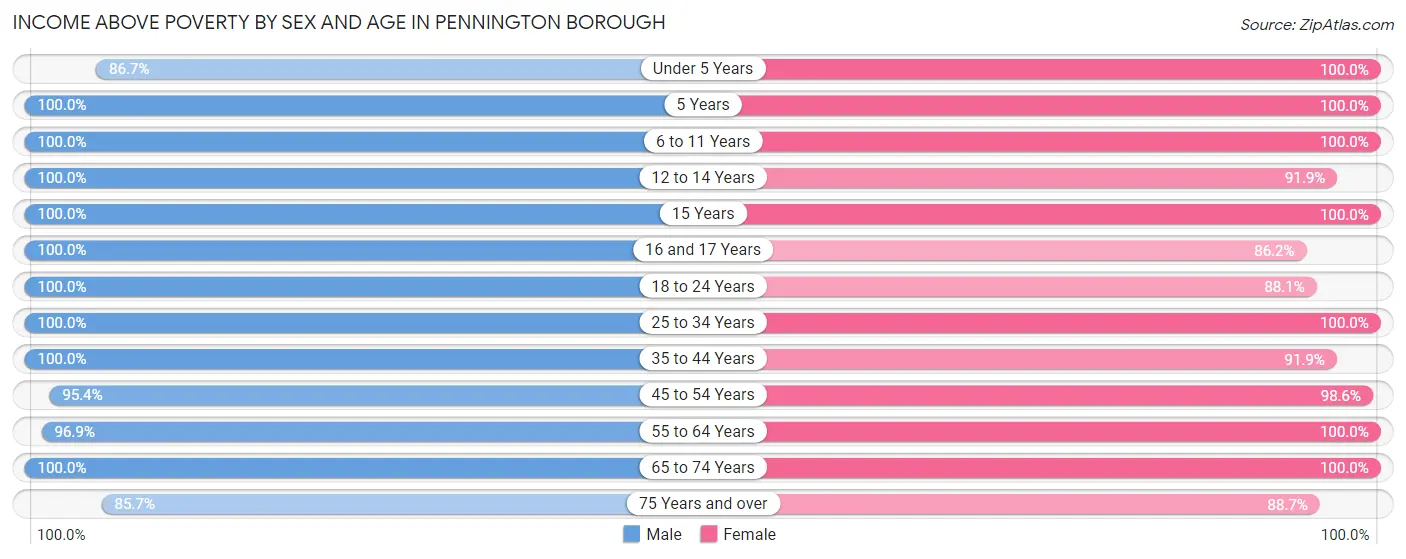
| Age Bracket | Male | Female |
| Under 5 Years | 111 (86.7%) | 37 (100.0%) |
| 5 Years | 6 (100.0%) | 3 (100.0%) |
| 6 to 11 Years | 59 (100.0%) | 99 (100.0%) |
| 12 to 14 Years | 70 (100.0%) | 57 (91.9%) |
| 15 Years | 17 (100.0%) | 14 (100.0%) |
| 16 and 17 Years | 77 (100.0%) | 50 (86.2%) |
| 18 to 24 Years | 89 (100.0%) | 37 (88.1%) |
| 25 to 34 Years | 75 (100.0%) | 153 (100.0%) |
| 35 to 44 Years | 153 (100.0%) | 124 (91.8%) |
| 45 to 54 Years | 228 (95.4%) | 204 (98.6%) |
| 55 to 64 Years | 185 (96.9%) | 245 (100.0%) |
| 65 to 74 Years | 205 (100.0%) | 174 (100.0%) |
| 75 Years and over | 48 (85.7%) | 149 (88.7%) |
| Total | 1,323 (96.9%) | 1,346 (96.4%) |
Income Below Poverty Among Married-Couple Families in Pennington borough
The poverty statistics for married-couple families in Pennington borough show that 1.6% or 11 of the total 705 families live below the poverty line. Families with 1 or 2 children have the highest poverty rate of 4.0%, comprising of 11 families. On the other hand, families with no children have the lowest poverty rate of 0.0%, which includes 0 families.
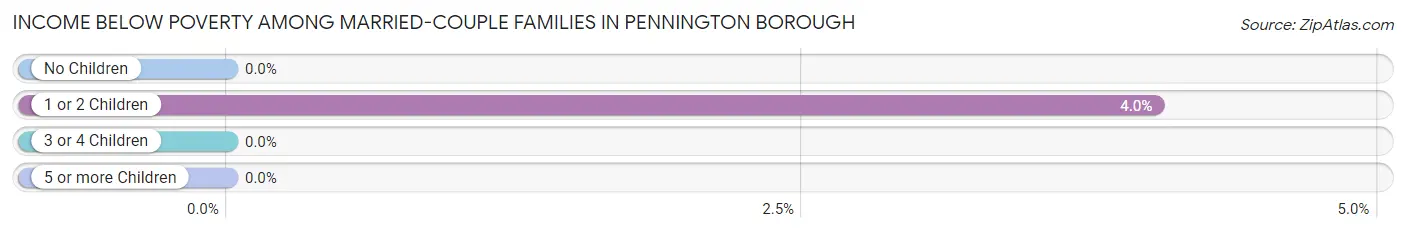
| Children | Above Poverty | Below Poverty |
| No Children | 398 (100.0%) | 0 (0.0%) |
| 1 or 2 Children | 262 (96.0%) | 11 (4.0%) |
| 3 or 4 Children | 34 (100.0%) | 0 (0.0%) |
| 5 or more Children | 0 (0.0%) | 0 (0.0%) |
| Total | 694 (98.4%) | 11 (1.6%) |
Income Below Poverty Among Single-Parent Households in Pennington borough
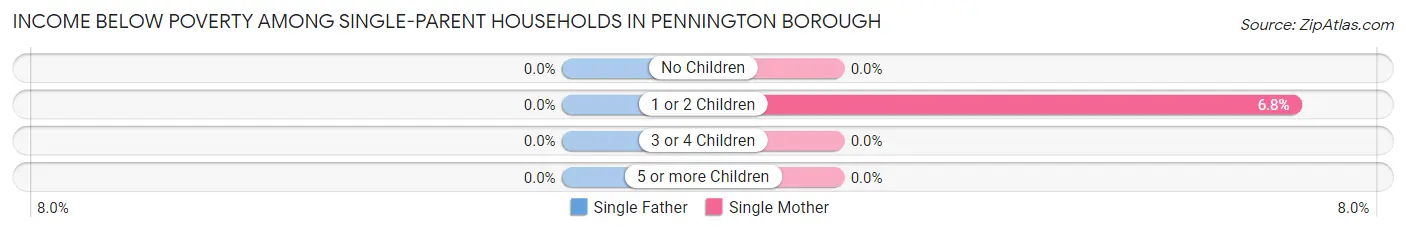
| Children | Single Father | Single Mother |
| No Children | 0 (0.0%) | 0 (0.0%) |
| 1 or 2 Children | 0 (0.0%) | 3 (6.8%) |
| 3 or 4 Children | 0 (0.0%) | 0 (0.0%) |
| 5 or more Children | 0 (0.0%) | 0 (0.0%) |
| Total | 0 (0.0%) | 3 (4.2%) |
Income Below Poverty Among Married-Couple vs Single-Parent Households in Pennington borough
The poverty data for Pennington borough shows that 11 of the married-couple family households (1.6%) and 3 of the single-parent households (3.0%) are living below the poverty level. Within the married-couple family households, those with 1 or 2 children have the highest poverty rate, with 11 households (4.0%) falling below the poverty line. Among the single-parent households, those with 1 or 2 children have the highest poverty rate, with 3 household (4.3%) living below poverty.
| Children | Married-Couple Families | Single-Parent Households |
| No Children | 0 (0.0%) | 0 (0.0%) |
| 1 or 2 Children | 11 (4.0%) | 3 (4.3%) |
| 3 or 4 Children | 0 (0.0%) | 0 (0.0%) |
| 5 or more Children | 0 (0.0%) | 0 (0.0%) |
| Total | 11 (1.6%) | 3 (3.0%) |
Race in Pennington borough
The most populous races in Pennington borough are White / Caucasian (2,385 | 85.8%), Asian (210 | 7.5%), and Hispanic or Latino (149 | 5.4%).
| Race | # Population | % Population |
| Asian | 210 | 7.5% |
| Black / African American | 52 | 1.9% |
| Hawaiian / Pacific | 0 | 0.0% |
| Hispanic or Latino | 149 | 5.4% |
| Native / Alaskan | 0 | 0.0% |
| White / Caucasian | 2,385 | 85.8% |
| Two or more Races | 110 | 4.0% |
| Some other Race | 23 | 0.8% |
| Total | 2,780 | 100.0% |
Ancestry in Pennington borough
The most populous ancestries reported in Pennington borough are Irish (574 | 20.6%), English (558 | 20.1%), German (380 | 13.7%), Italian (312 | 11.2%), and Polish (176 | 6.3%), together accounting for 71.9% of all Pennington borough residents.
| Ancestry | # Population | % Population |
| American | 36 | 1.3% |
| Arab | 36 | 1.3% |
| Armenian | 7 | 0.3% |
| Austrian | 36 | 1.3% |
| Bhutanese | 44 | 1.6% |
| British | 4 | 0.1% |
| Burmese | 19 | 0.7% |
| Cuban | 18 | 0.6% |
| Danish | 31 | 1.1% |
| Dutch | 69 | 2.5% |
| Eastern European | 31 | 1.1% |
| Ecuadorian | 7 | 0.3% |
| English | 558 | 20.1% |
| European | 60 | 2.2% |
| Filipino | 9 | 0.3% |
| French | 27 | 1.0% |
| French Canadian | 16 | 0.6% |
| German | 380 | 13.7% |
| Hungarian | 53 | 1.9% |
| Indian (Asian) | 89 | 3.2% |
| Iraqi | 21 | 0.8% |
| Irish | 574 | 20.6% |
| Israeli | 31 | 1.1% |
| Italian | 312 | 11.2% |
| Korean | 19 | 0.7% |
| Lithuanian | 5 | 0.2% |
| Mexican | 46 | 1.7% |
| Norwegian | 43 | 1.5% |
| Peruvian | 6 | 0.2% |
| Polish | 176 | 6.3% |
| Portuguese | 5 | 0.2% |
| Puerto Rican | 40 | 1.4% |
| Romanian | 24 | 0.9% |
| Russian | 26 | 0.9% |
| Scotch-Irish | 12 | 0.4% |
| Scottish | 44 | 1.6% |
| Slovak | 21 | 0.8% |
| South American | 13 | 0.5% |
| Spaniard | 32 | 1.1% |
| Swedish | 31 | 1.1% |
| Swiss | 11 | 0.4% |
| Thai | 81 | 2.9% |
| Ukrainian | 4 | 0.1% |
| Welsh | 23 | 0.8% | View All 44 Rows |
Immigrants in Pennington borough
The most numerous immigrant groups reported in Pennington borough came from Asia (134 | 4.8%), Europe (93 | 3.4%), Eastern Asia (67 | 2.4%), India (64 | 2.3%), and South Central Asia (64 | 2.3%), together accounting for 15.2% of all Pennington borough residents.
| Immigration Origin | # Population | % Population |
| Asia | 134 | 4.8% |
| Canada | 16 | 0.6% |
| Caribbean | 6 | 0.2% |
| Central America | 17 | 0.6% |
| China | 41 | 1.5% |
| Cuba | 6 | 0.2% |
| Eastern Asia | 67 | 2.4% |
| Eastern Europe | 26 | 0.9% |
| Ecuador | 7 | 0.3% |
| England | 3 | 0.1% |
| Europe | 93 | 3.4% |
| France | 3 | 0.1% |
| India | 64 | 2.3% |
| Italy | 35 | 1.3% |
| Japan | 12 | 0.4% |
| Korea | 14 | 0.5% |
| Latin America | 36 | 1.3% |
| Mexico | 17 | 0.6% |
| Moldova | 3 | 0.1% |
| Netherlands | 6 | 0.2% |
| Northern Europe | 21 | 0.8% |
| Peru | 6 | 0.2% |
| Philippines | 3 | 0.1% |
| Poland | 7 | 0.3% |
| Romania | 6 | 0.2% |
| Russia | 5 | 0.2% |
| South America | 13 | 0.5% |
| South Central Asia | 64 | 2.3% |
| South Eastern Asia | 3 | 0.1% |
| Southern Europe | 37 | 1.3% |
| Ukraine | 5 | 0.2% |
| Western Europe | 9 | 0.3% | View All 32 Rows |
Sex and Age in Pennington borough
Sex and Age in Pennington borough
The most populous age groups in Pennington borough are 45 to 49 Years (152 | 11.1%) for men and 60 to 64 Years (164 | 11.6%) for women.
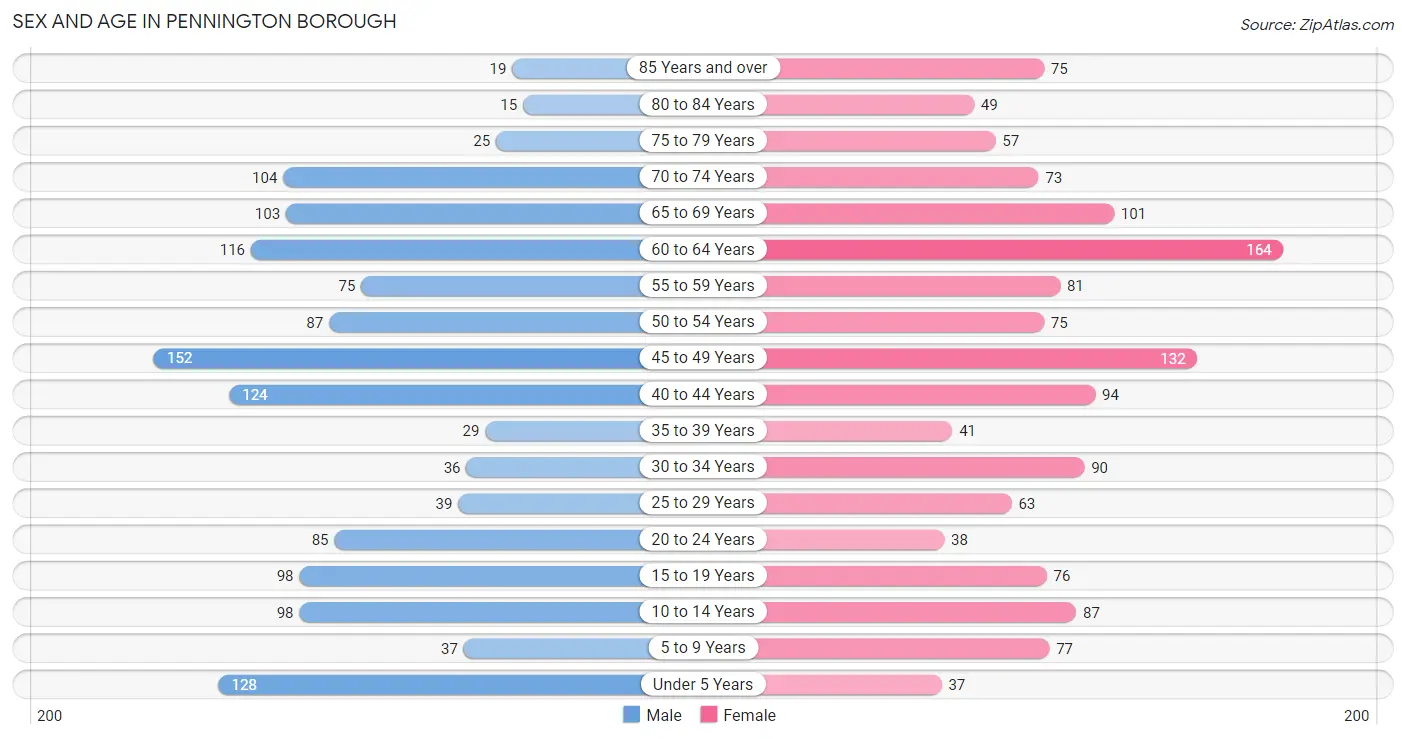
| Age Bracket | Male | Female |
| Under 5 Years | 128 (9.3%) | 37 (2.6%) |
| 5 to 9 Years | 37 (2.7%) | 77 (5.5%) |
| 10 to 14 Years | 98 (7.1%) | 87 (6.2%) |
| 15 to 19 Years | 98 (7.1%) | 76 (5.4%) |
| 20 to 24 Years | 85 (6.2%) | 38 (2.7%) |
| 25 to 29 Years | 39 (2.9%) | 63 (4.5%) |
| 30 to 34 Years | 36 (2.6%) | 90 (6.4%) |
| 35 to 39 Years | 29 (2.1%) | 41 (2.9%) |
| 40 to 44 Years | 124 (9.0%) | 94 (6.7%) |
| 45 to 49 Years | 152 (11.1%) | 132 (9.4%) |
| 50 to 54 Years | 87 (6.4%) | 75 (5.3%) |
| 55 to 59 Years | 75 (5.5%) | 81 (5.7%) |
| 60 to 64 Years | 116 (8.5%) | 164 (11.6%) |
| 65 to 69 Years | 103 (7.5%) | 101 (7.2%) |
| 70 to 74 Years | 104 (7.6%) | 73 (5.2%) |
| 75 to 79 Years | 25 (1.8%) | 57 (4.0%) |
| 80 to 84 Years | 15 (1.1%) | 49 (3.5%) |
| 85 Years and over | 19 (1.4%) | 75 (5.3%) |
| Total | 1,370 (100.0%) | 1,410 (100.0%) |
Families and Households in Pennington borough
Median Family Size in Pennington borough
The median family size in Pennington borough is 2.89 persons per family, with married-couple families (705 | 87.7%) accounting for the largest median family size of 2.94 persons per family. On the other hand, single male/father families (27 | 3.4%) represent the smallest median family size with 2.52 persons per family.
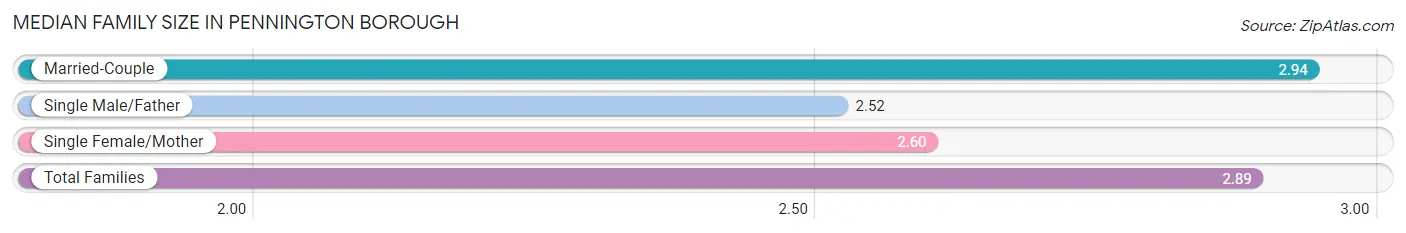
| Family Type | # Families | Family Size |
| Married-Couple | 705 (87.7%) | 2.94 |
| Single Male/Father | 27 (3.4%) | 2.52 |
| Single Female/Mother | 72 (9.0%) | 2.60 |
| Total Families | 804 (100.0%) | 2.89 |
Median Household Size in Pennington borough
The median household size in Pennington borough is 2.37 persons per household, with married-couple households (705 | 62.0%) accounting for the largest median household size of 2.94 persons per household. non-family households (334 | 29.3%) represent the smallest median household size with 1.10 persons per household.
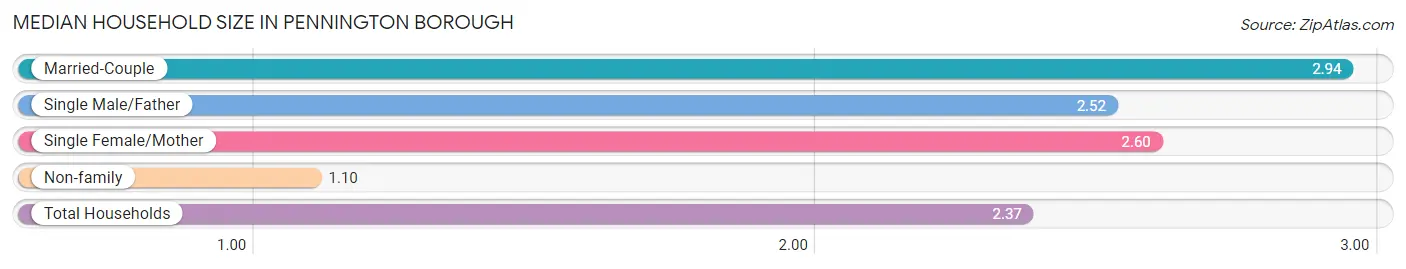
| Household Type | # Households | Household Size |
| Married-Couple | 705 (62.0%) | 2.94 |
| Single Male/Father | 27 (2.4%) | 2.52 |
| Single Female/Mother | 72 (6.3%) | 2.60 |
| Non-family | 334 (29.3%) | 1.10 |
| Total Households | 1,138 (100.0%) | 2.37 |
Household Size by Marriage Status in Pennington borough
Out of a total of 1,138 households in Pennington borough, 804 (70.7%) are family households, while 334 (29.3%) are nonfamily households. The most numerous type of family households are 2-person households, comprising 383, and the most common type of nonfamily households are 1-person households, comprising 300.
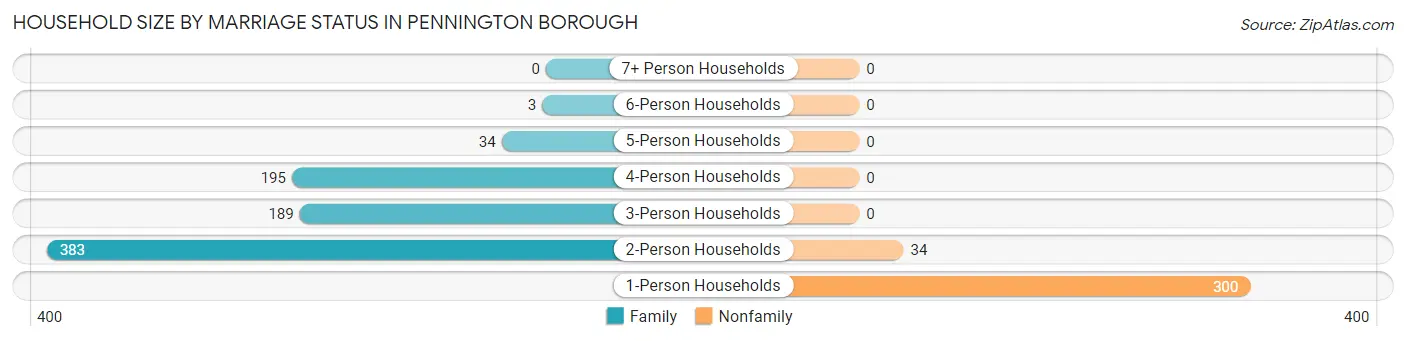
| Household Size | Family Households | Nonfamily Households |
| 1-Person Households | - | 300 (26.4%) |
| 2-Person Households | 383 (33.7%) | 34 (3.0%) |
| 3-Person Households | 189 (16.6%) | 0 (0.0%) |
| 4-Person Households | 195 (17.1%) | 0 (0.0%) |
| 5-Person Households | 34 (3.0%) | 0 (0.0%) |
| 6-Person Households | 3 (0.3%) | 0 (0.0%) |
| 7+ Person Households | 0 (0.0%) | 0 (0.0%) |
| Total | 804 (70.7%) | 334 (29.3%) |
Female Fertility in Pennington borough
Fertility by Age in Pennington borough
Average fertility rate in Pennington borough is 7.0 births per 1,000 women. Women in the age bracket of 35 to 50 years have the highest fertility rate with 14.0 births per 1,000 women. Women in the age bracket of 35 to 50 years acount for 100.0% of all women with births.
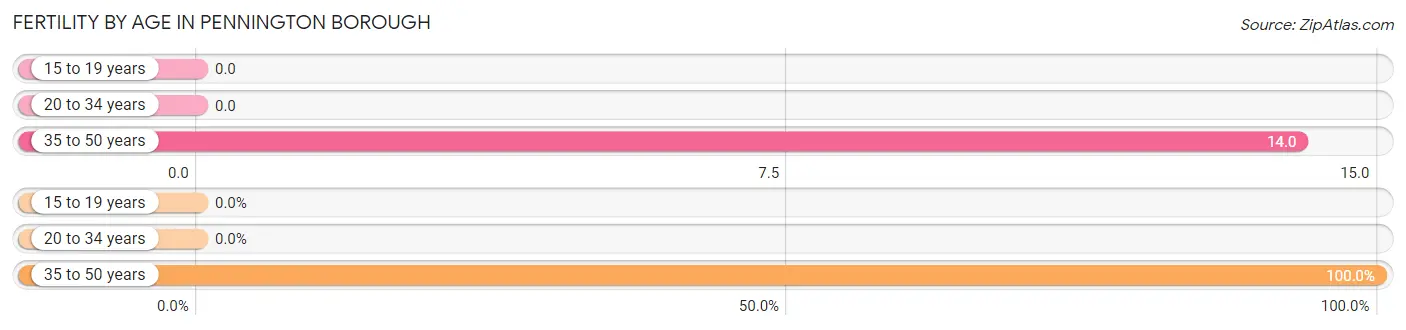
| Age Bracket | Women with Births | Births / 1,000 Women |
| 15 to 19 years | 0 (0.0%) | 0.0 |
| 20 to 34 years | 0 (0.0%) | 0.0 |
| 35 to 50 years | 4 (100.0%) | 14.0 |
| Total | 4 (100.0%) | 7.0 |
Fertility by Age by Marriage Status in Pennington borough
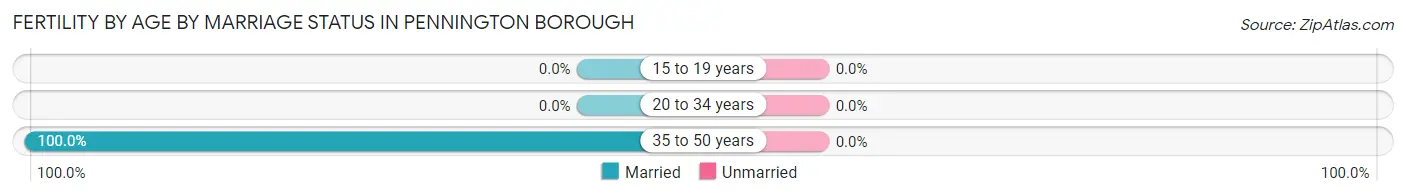
| Age Bracket | Married | Unmarried |
| 15 to 19 years | 0 (0.0%) | 0 (0.0%) |
| 20 to 34 years | 0 (0.0%) | 0 (0.0%) |
| 35 to 50 years | 4 (100.0%) | 0 (0.0%) |
| Total | 4 (100.0%) | 0 (0.0%) |
Fertility by Education in Pennington borough
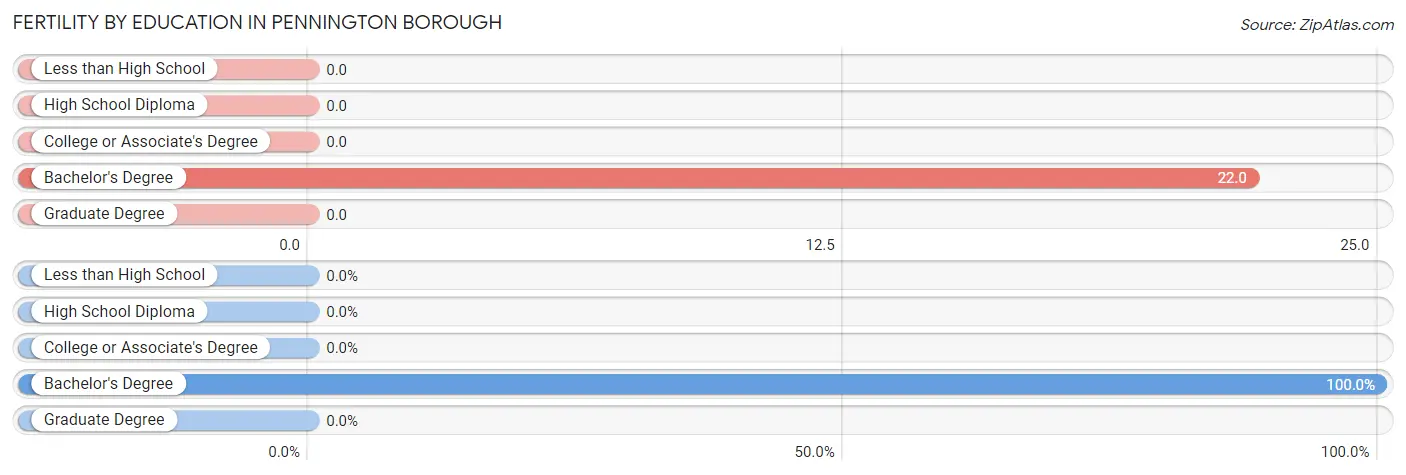
| Educational Attainment | Women with Births | Births / 1,000 Women |
| Less than High School | 0 (0.0%) | 0.0 |
| High School Diploma | 0 (0.0%) | 0.0 |
| College or Associate's Degree | 0 (0.0%) | 0.0 |
| Bachelor's Degree | 4 (100.0%) | 22.0 |
| Graduate Degree | 0 (0.0%) | 0.0 |
| Total | 4 (100.0%) | 7.0 |
Fertility by Education by Marriage Status in Pennington borough
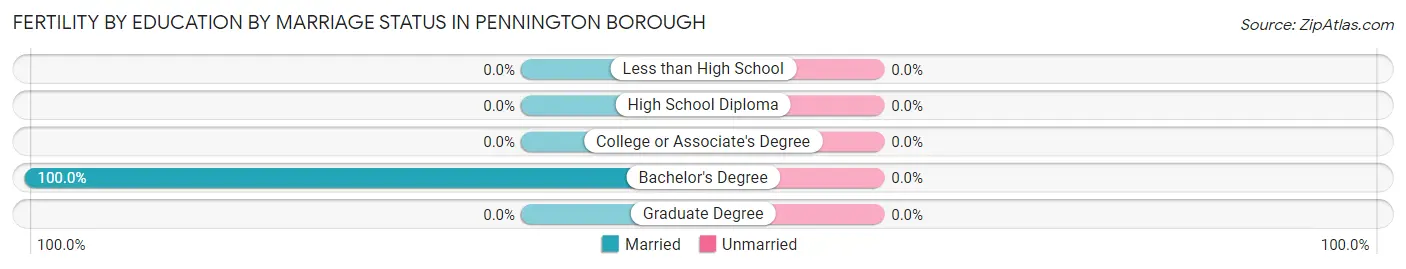
| Educational Attainment | Married | Unmarried |
| Less than High School | 0 (0.0%) | 0 (0.0%) |
| High School Diploma | 0 (0.0%) | 0 (0.0%) |
| College or Associate's Degree | 0 (0.0%) | 0 (0.0%) |
| Bachelor's Degree | 4 (100.0%) | 0 (0.0%) |
| Graduate Degree | 0 (0.0%) | 0 (0.0%) |
| Total | 4 (100.0%) | 0 (0.0%) |
Employment Characteristics in Pennington borough
Employment by Class of Employer in Pennington borough
Among the 1,443 employed individuals in Pennington borough, private company employees (717 | 49.7%), not-for-profit organizations (261 | 18.1%), and local government employees (134 | 9.3%) make up the most common classes of employment.
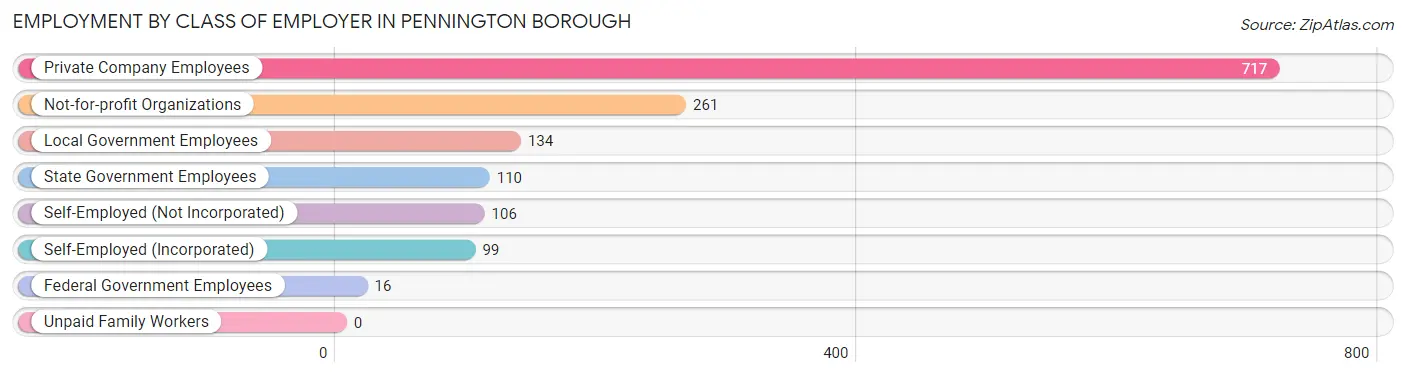
| Employer Class | # Employees | % Employees |
| Private Company Employees | 717 | 49.7% |
| Self-Employed (Incorporated) | 99 | 6.9% |
| Self-Employed (Not Incorporated) | 106 | 7.3% |
| Not-for-profit Organizations | 261 | 18.1% |
| Local Government Employees | 134 | 9.3% |
| State Government Employees | 110 | 7.6% |
| Federal Government Employees | 16 | 1.1% |
| Unpaid Family Workers | 0 | 0.0% |
| Total | 1,443 | 100.0% |
Employment Status by Age in Pennington borough
According to the labor force statistics for Pennington borough, out of the total population over 16 years of age (2,285), 66.3% or 1,515 individuals are in the labor force, with 2.8% or 42 of them unemployed. The age group with the highest labor force participation rate is 25 to 29 years, with 94.1% or 96 individuals in the labor force. Within the labor force, the 16 to 19 years age range has the highest percentage of unemployed individuals, with 30.4% or 21 of them being unemployed.
| Age Bracket | In Labor Force | Unemployed |
| 16 to 19 Years | 69 (48.3%) | 21 (30.4%) |
| 20 to 24 Years | 99 (80.5%) | 19 (19.2%) |
| 25 to 29 Years | 96 (94.1%) | 0 (0.0%) |
| 30 to 34 Years | 118 (93.7%) | 0 (0.0%) |
| 35 to 44 Years | 219 (76.0%) | 0 (0.0%) |
| 45 to 54 Years | 381 (85.4%) | 3 (0.8%) |
| 55 to 59 Years | 124 (79.5%) | 0 (0.0%) |
| 60 to 64 Years | 213 (76.1%) | 0 (0.0%) |
| 65 to 74 Years | 168 (44.1%) | 0 (0.0%) |
| 75 Years and over | 27 (11.3%) | 0 (0.0%) |
| Total | 1,515 (66.3%) | 42 (2.8%) |
Employment Status by Educational Attainment in Pennington borough
According to labor force statistics for Pennington borough, 82.3% of individuals (1,151) out of the total population between 25 and 64 years of age (1,398) are in the labor force, with 0.3% or 3 of them being unemployed. The group with the highest labor force participation rate are those with the educational attainment of bachelor's degree or higher, with 84.4% or 950 individuals in the labor force. Within the labor force, individuals with high school diploma education have the highest percentage of unemployment, with 3.0% or 3 of them being unemployed.
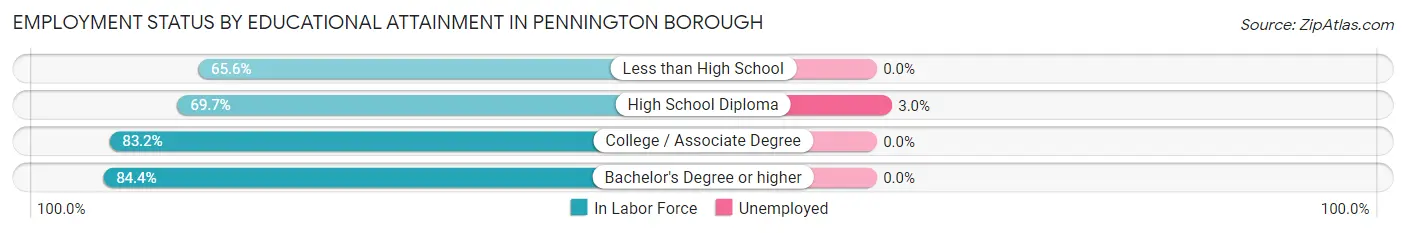
| Educational Attainment | In Labor Force | Unemployed |
| Less than High School | 21 (65.6%) | 0 (0.0%) |
| High School Diploma | 101 (69.7%) | 4 (3.0%) |
| College / Associate Degree | 79 (83.2%) | 0 (0.0%) |
| Bachelor's Degree or higher | 950 (84.4%) | 0 (0.0%) |
| Total | 1,151 (82.3%) | 4 (0.3%) |
Employment Occupations by Sex in Pennington borough
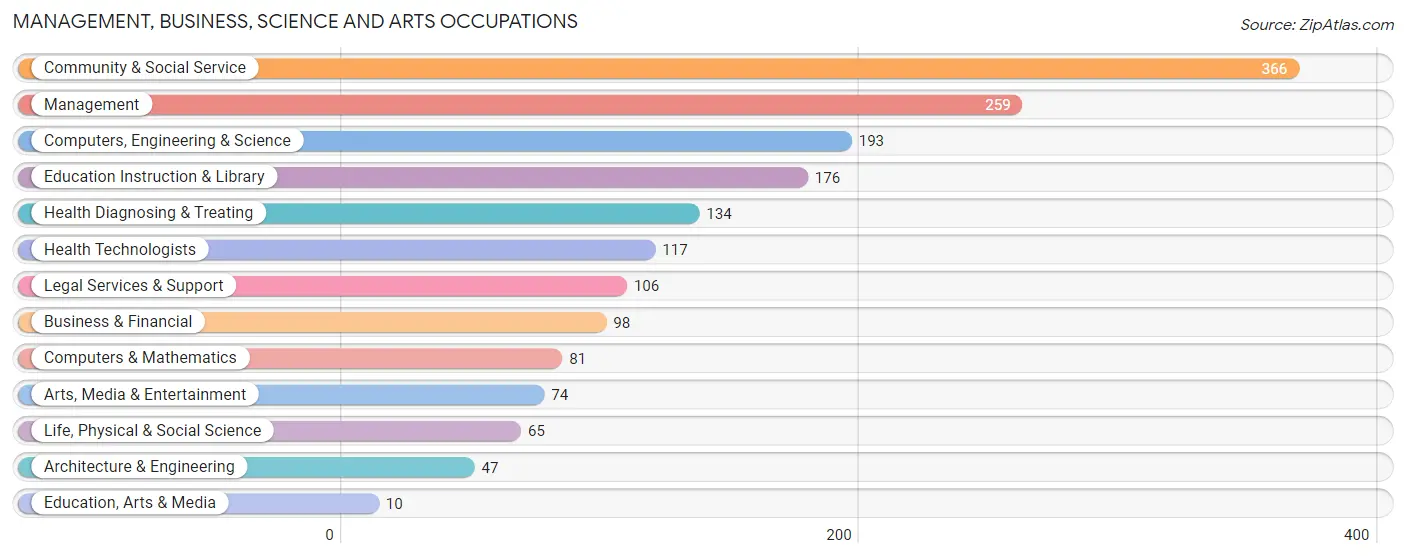
Management, Business, Science and Arts Occupations
The most common Management, Business, Science and Arts occupations in Pennington borough are Community & Social Service (366 | 24.9%), Management (259 | 17.6%), Computers, Engineering & Science (193 | 13.1%), Education Instruction & Library (176 | 12.0%), and Health Diagnosing & Treating (134 | 9.1%).
Management, Business, Science and Arts Occupations by Sex
Within the Management, Business, Science and Arts occupations in Pennington borough, the most male-oriented occupations are Life, Physical & Social Science (84.6%), Architecture & Engineering (80.8%), and Computers, Engineering & Science (77.2%), while the most female-oriented occupations are Education, Arts & Media (100.0%), Health Diagnosing & Treating (82.1%), and Health Technologists (79.5%).
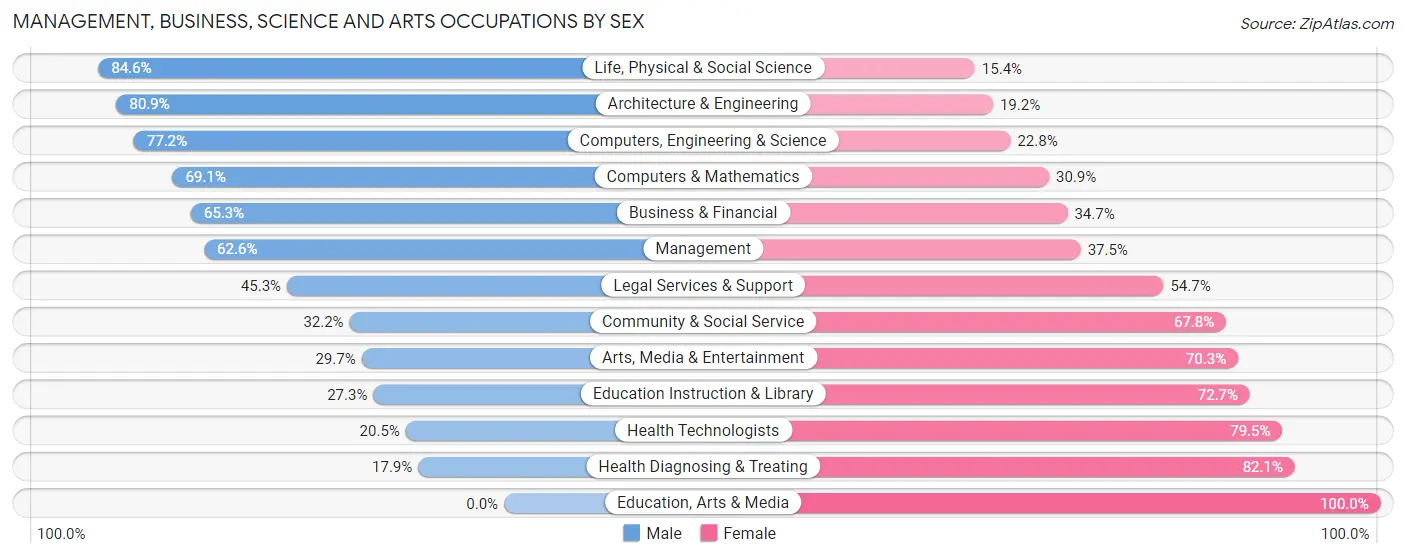
| Occupation | Male | Female |
| Management | 162 (62.5%) | 97 (37.4%) |
| Business & Financial | 64 (65.3%) | 34 (34.7%) |
| Computers, Engineering & Science | 149 (77.2%) | 44 (22.8%) |
| Computers & Mathematics | 56 (69.1%) | 25 (30.9%) |
| Architecture & Engineering | 38 (80.8%) | 9 (19.2%) |
| Life, Physical & Social Science | 55 (84.6%) | 10 (15.4%) |
| Community & Social Service | 118 (32.2%) | 248 (67.8%) |
| Education, Arts & Media | 0 (0.0%) | 10 (100.0%) |
| Legal Services & Support | 48 (45.3%) | 58 (54.7%) |
| Education Instruction & Library | 48 (27.3%) | 128 (72.7%) |
| Arts, Media & Entertainment | 22 (29.7%) | 52 (70.3%) |
| Health Diagnosing & Treating | 24 (17.9%) | 110 (82.1%) |
| Health Technologists | 24 (20.5%) | 93 (79.5%) |
| Total (Category) | 517 (49.2%) | 533 (50.8%) |
| Total (Overall) | 810 (55.1%) | 661 (44.9%) |
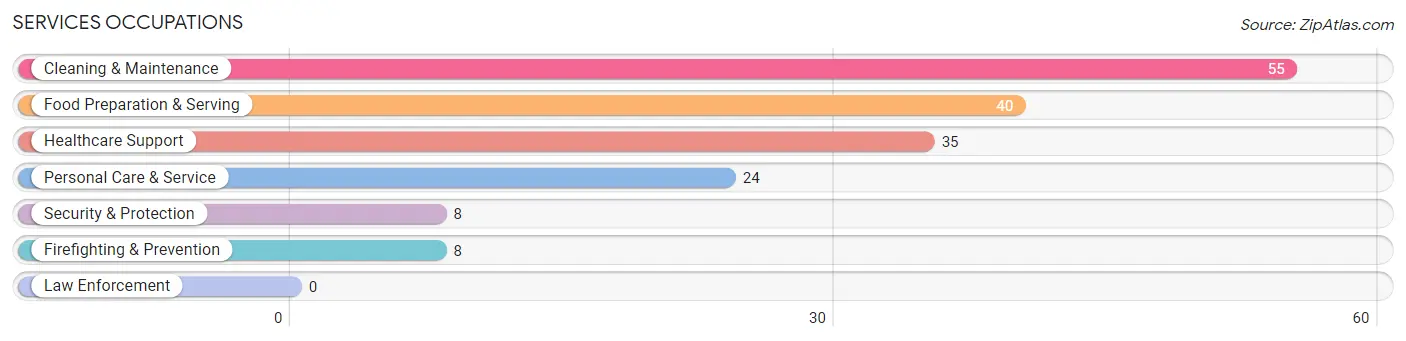
Services Occupations
The most common Services occupations in Pennington borough are Cleaning & Maintenance (55 | 3.7%), Food Preparation & Serving (40 | 2.7%), Healthcare Support (35 | 2.4%), Personal Care & Service (24 | 1.6%), and Security & Protection (8 | 0.5%).
Services Occupations by Sex
Within the Services occupations in Pennington borough, the most male-oriented occupations are Security & Protection (100.0%), Firefighting & Prevention (100.0%), and Cleaning & Maintenance (100.0%), while the most female-oriented occupations are Personal Care & Service (41.7%), Food Preparation & Serving (22.5%), and Healthcare Support (17.1%).
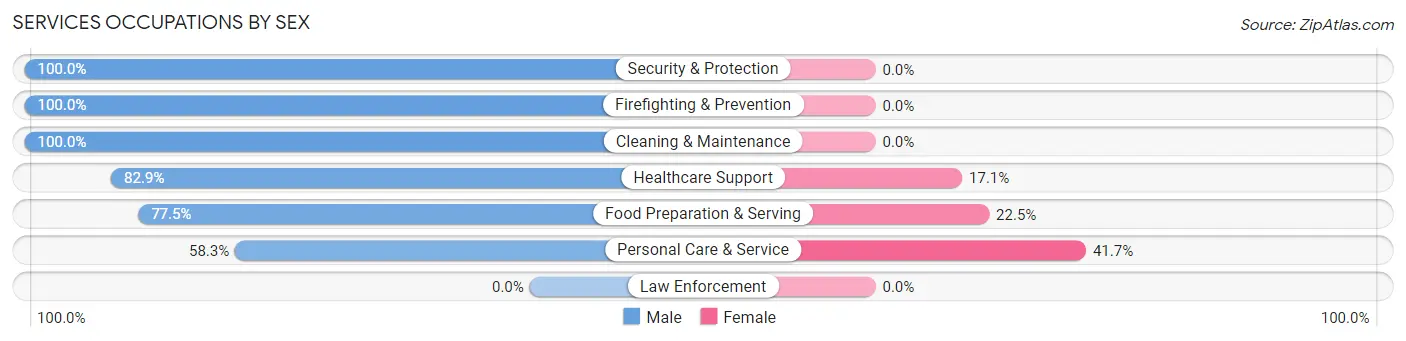
| Occupation | Male | Female |
| Healthcare Support | 29 (82.9%) | 6 (17.1%) |
| Security & Protection | 8 (100.0%) | 0 (0.0%) |
| Firefighting & Prevention | 8 (100.0%) | 0 (0.0%) |
| Law Enforcement | 0 (0.0%) | 0 (0.0%) |
| Food Preparation & Serving | 31 (77.5%) | 9 (22.5%) |
| Cleaning & Maintenance | 55 (100.0%) | 0 (0.0%) |
| Personal Care & Service | 14 (58.3%) | 10 (41.7%) |
| Total (Category) | 137 (84.6%) | 25 (15.4%) |
| Total (Overall) | 810 (55.1%) | 661 (44.9%) |
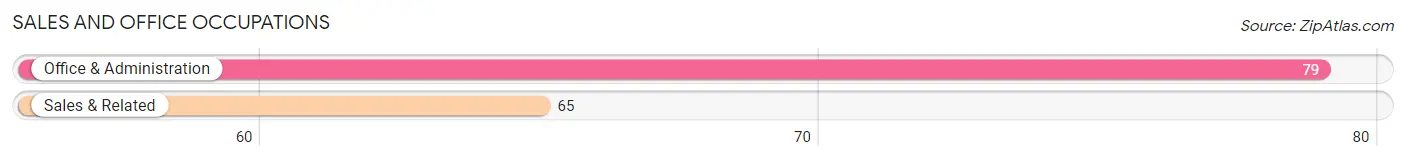
Sales and Office Occupations
The most common Sales and Office occupations in Pennington borough are Office & Administration (79 | 5.4%), and Sales & Related (65 | 4.4%).
Sales and Office Occupations by Sex
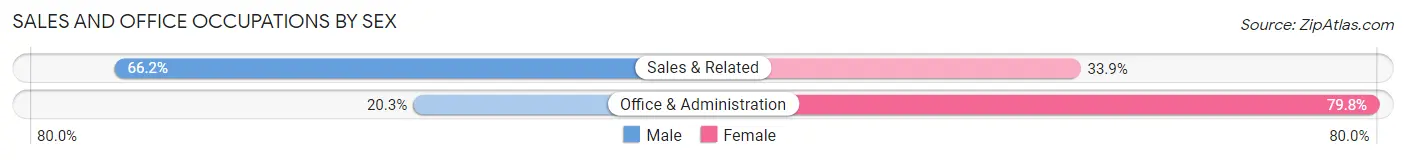
| Occupation | Male | Female |
| Sales & Related | 43 (66.1%) | 22 (33.9%) |
| Office & Administration | 16 (20.3%) | 63 (79.7%) |
| Total (Category) | 59 (41.0%) | 85 (59.0%) |
| Total (Overall) | 810 (55.1%) | 661 (44.9%) |
Natural Resources, Construction and Maintenance Occupations
The most common Natural Resources, Construction and Maintenance occupations in Pennington borough are Installation, Maintenance & Repair (42 | 2.9%), Construction & Extraction (23 | 1.6%), and Farming, Fishing & Forestry (21 | 1.4%).
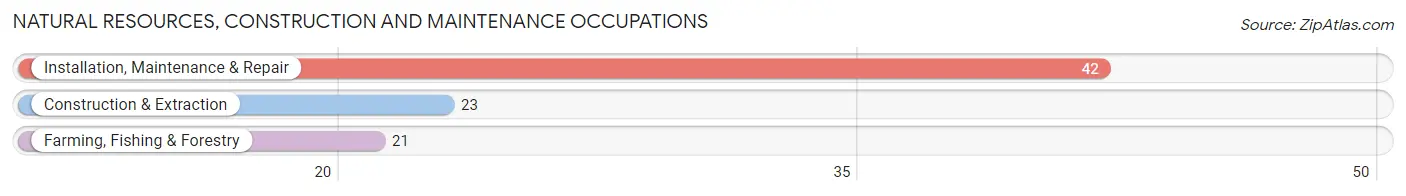
Natural Resources, Construction and Maintenance Occupations by Sex
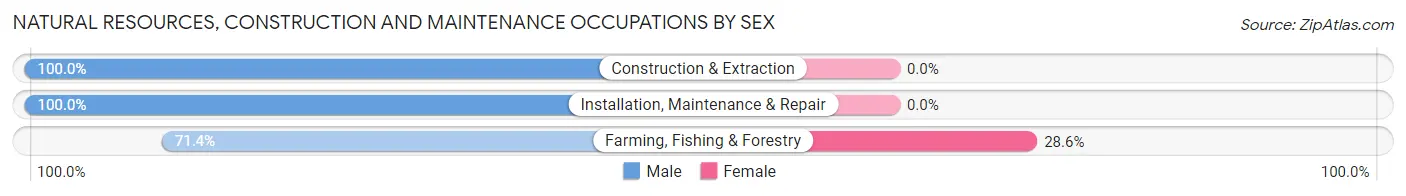
| Occupation | Male | Female |
| Farming, Fishing & Forestry | 15 (71.4%) | 6 (28.6%) |
| Construction & Extraction | 23 (100.0%) | 0 (0.0%) |
| Installation, Maintenance & Repair | 42 (100.0%) | 0 (0.0%) |
| Total (Category) | 80 (93.0%) | 6 (7.0%) |
| Total (Overall) | 810 (55.1%) | 661 (44.9%) |
Production, Transportation and Moving Occupations
The most common Production, Transportation and Moving occupations in Pennington borough are Production (15 | 1.0%), Transportation (8 | 0.5%), and Material Moving (6 | 0.4%).
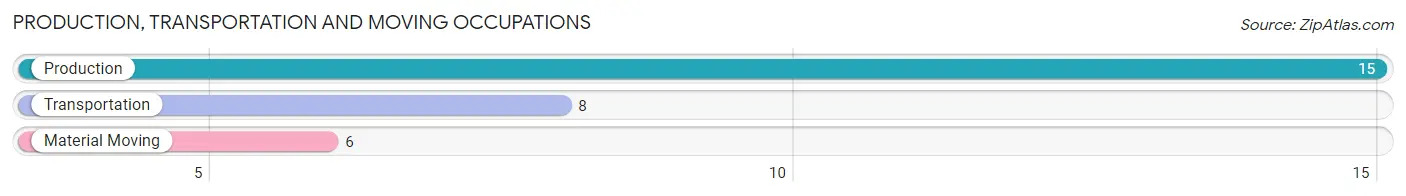
Production, Transportation and Moving Occupations by Sex
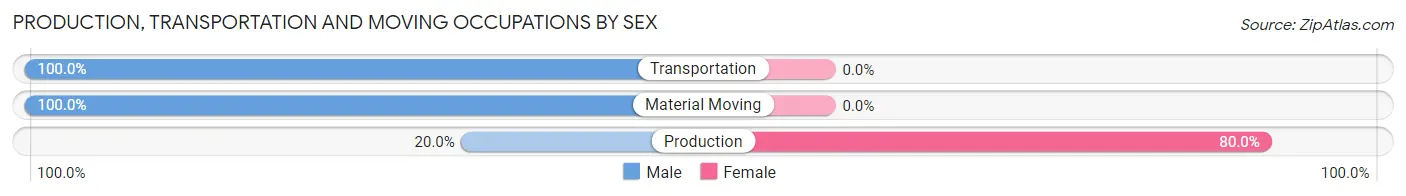
| Occupation | Male | Female |
| Production | 3 (20.0%) | 12 (80.0%) |
| Transportation | 8 (100.0%) | 0 (0.0%) |
| Material Moving | 6 (100.0%) | 0 (0.0%) |
| Total (Category) | 17 (58.6%) | 12 (41.4%) |
| Total (Overall) | 810 (55.1%) | 661 (44.9%) |
Employment Industries by Sex in Pennington borough
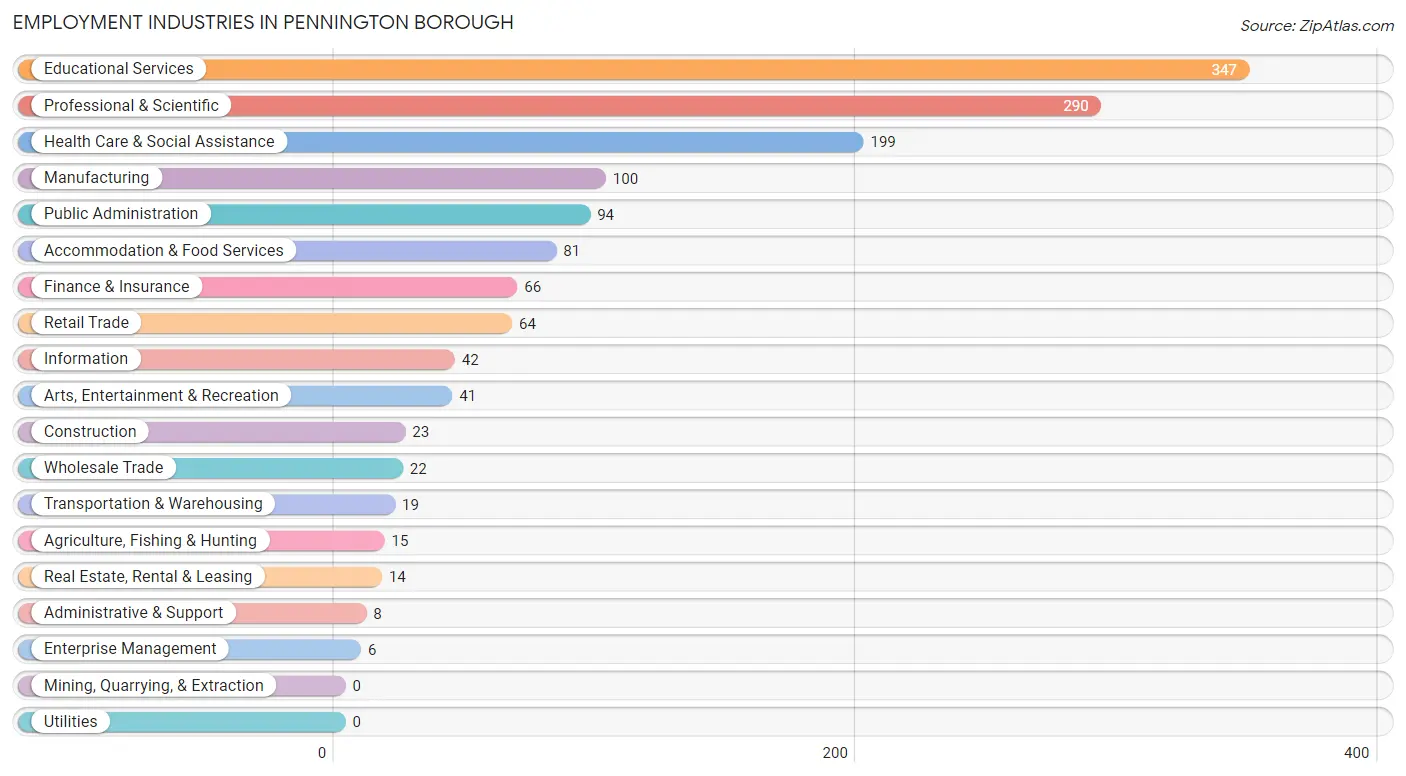
Employment Industries in Pennington borough
The major employment industries in Pennington borough include Educational Services (347 | 23.6%), Professional & Scientific (290 | 19.7%), Health Care & Social Assistance (199 | 13.5%), Manufacturing (100 | 6.8%), and Public Administration (94 | 6.4%).
Employment Industries by Sex in Pennington borough
The Pennington borough industries that see more men than women are Agriculture, Fishing & Hunting (100.0%), Construction (100.0%), and Wholesale Trade (100.0%), whereas the industries that tend to have a higher number of women are Information (71.4%), Educational Services (63.4%), and Public Administration (62.8%).
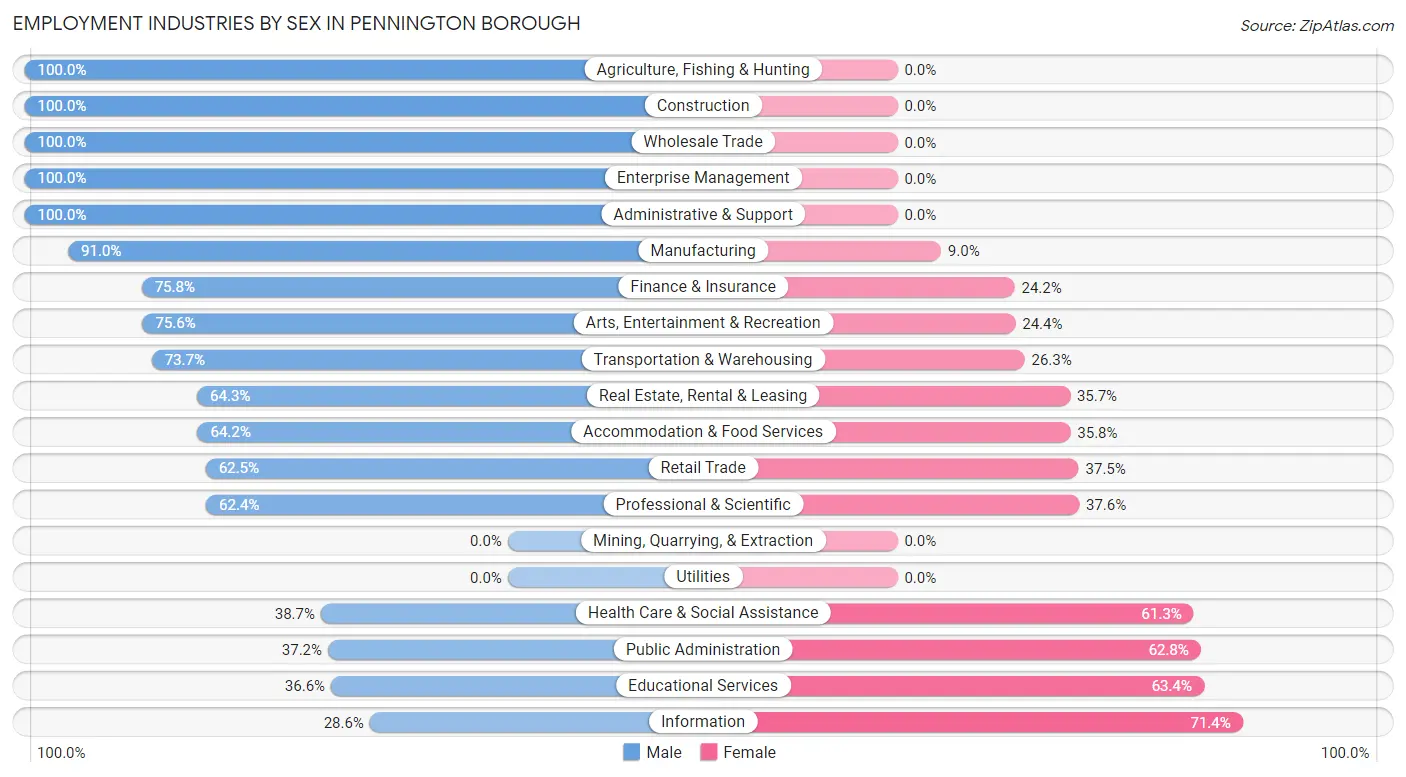
| Industry | Male | Female |
| Agriculture, Fishing & Hunting | 15 (100.0%) | 0 (0.0%) |
| Mining, Quarrying, & Extraction | 0 (0.0%) | 0 (0.0%) |
| Construction | 23 (100.0%) | 0 (0.0%) |
| Manufacturing | 91 (91.0%) | 9 (9.0%) |
| Wholesale Trade | 22 (100.0%) | 0 (0.0%) |
| Retail Trade | 40 (62.5%) | 24 (37.5%) |
| Transportation & Warehousing | 14 (73.7%) | 5 (26.3%) |
| Utilities | 0 (0.0%) | 0 (0.0%) |
| Information | 12 (28.6%) | 30 (71.4%) |
| Finance & Insurance | 50 (75.8%) | 16 (24.2%) |
| Real Estate, Rental & Leasing | 9 (64.3%) | 5 (35.7%) |
| Professional & Scientific | 181 (62.4%) | 109 (37.6%) |
| Enterprise Management | 6 (100.0%) | 0 (0.0%) |
| Administrative & Support | 8 (100.0%) | 0 (0.0%) |
| Educational Services | 127 (36.6%) | 220 (63.4%) |
| Health Care & Social Assistance | 77 (38.7%) | 122 (61.3%) |
| Arts, Entertainment & Recreation | 31 (75.6%) | 10 (24.4%) |
| Accommodation & Food Services | 52 (64.2%) | 29 (35.8%) |
| Public Administration | 35 (37.2%) | 59 (62.8%) |
| Total | 810 (55.1%) | 661 (44.9%) |
Education in Pennington borough
School Enrollment in Pennington borough
The most common levels of schooling among the 606 students in Pennington borough are high school (211 | 34.8%), middle school (143 | 23.6%), and elementary school (91 | 15.0%).
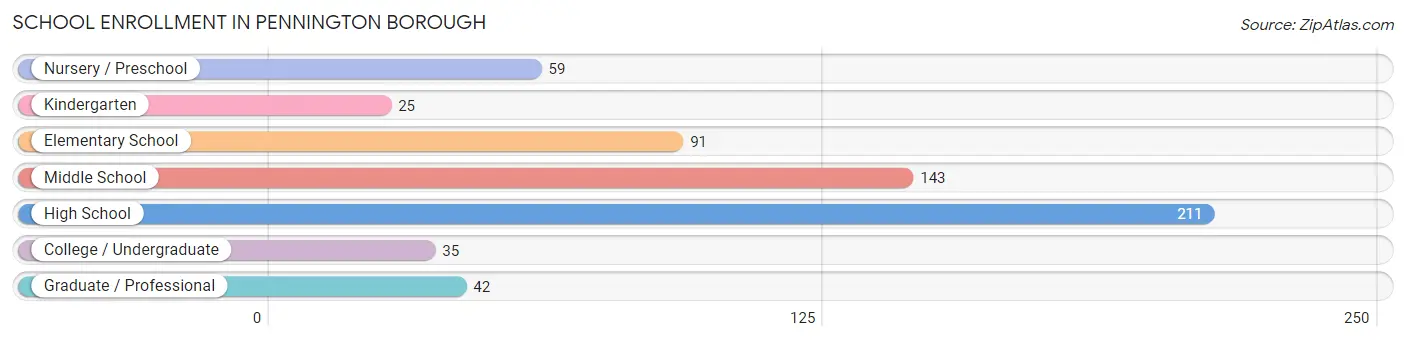
| School Level | # Students | % Students |
| Nursery / Preschool | 59 | 9.7% |
| Kindergarten | 25 | 4.1% |
| Elementary School | 91 | 15.0% |
| Middle School | 143 | 23.6% |
| High School | 211 | 34.8% |
| College / Undergraduate | 35 | 5.8% |
| Graduate / Professional | 42 | 6.9% |
| Total | 606 | 100.0% |
School Enrollment by Age by Funding Source in Pennington borough
Out of a total of 606 students who are enrolled in schools in Pennington borough, 133 (21.9%) attend a private institution, while the remaining 473 (78.1%) are enrolled in public schools. The age group of 25 to 34 year olds has the highest likelihood of being enrolled in private schools, with 3 (100.0% in the age bracket) enrolled. Conversely, the age group of 15 to 17 year olds has the lowest likelihood of being enrolled in a private school, with 153 (92.2% in the age bracket) attending a public institution.
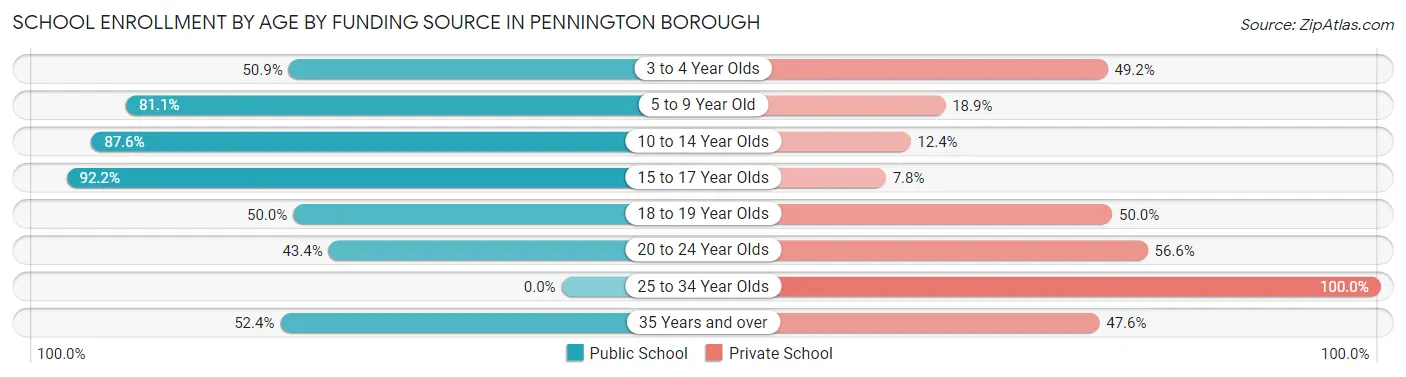
| Age Bracket | Public School | Private School |
| 3 to 4 Year Olds | 30 (50.8%) | 29 (49.1%) |
| 5 to 9 Year Old | 90 (81.1%) | 21 (18.9%) |
| 10 to 14 Year Olds | 162 (87.6%) | 23 (12.4%) |
| 15 to 17 Year Olds | 153 (92.2%) | 13 (7.8%) |
| 18 to 19 Year Olds | 4 (50.0%) | 4 (50.0%) |
| 20 to 24 Year Olds | 23 (43.4%) | 30 (56.6%) |
| 25 to 34 Year Olds | 0 (0.0%) | 3 (100.0%) |
| 35 Years and over | 11 (52.4%) | 10 (47.6%) |
| Total | 473 (78.1%) | 133 (21.9%) |
Educational Attainment by Field of Study in Pennington borough
Business (194 | 11.4%), bio, nature & agricultural (187 | 11.0%), literature & languages (187 | 11.0%), social sciences (144 | 8.5%), and visual & performing arts (135 | 7.9%) are the most common fields of study among 1,704 individuals in Pennington borough who have obtained a bachelor's degree or higher.
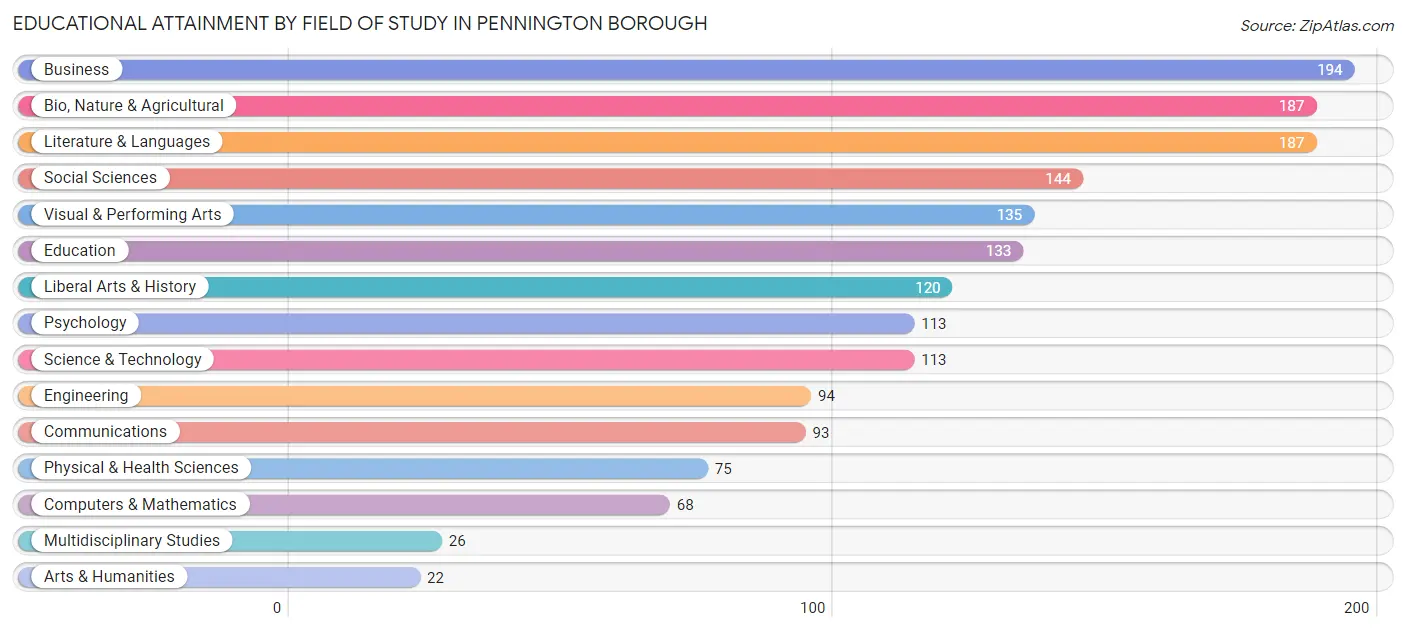
| Field of Study | # Graduates | % Graduates |
| Computers & Mathematics | 68 | 4.0% |
| Bio, Nature & Agricultural | 187 | 11.0% |
| Physical & Health Sciences | 75 | 4.4% |
| Psychology | 113 | 6.6% |
| Social Sciences | 144 | 8.5% |
| Engineering | 94 | 5.5% |
| Multidisciplinary Studies | 26 | 1.5% |
| Science & Technology | 113 | 6.6% |
| Business | 194 | 11.4% |
| Education | 133 | 7.8% |
| Literature & Languages | 187 | 11.0% |
| Liberal Arts & History | 120 | 7.0% |
| Visual & Performing Arts | 135 | 7.9% |
| Communications | 93 | 5.5% |
| Arts & Humanities | 22 | 1.3% |
| Total | 1,704 | 100.0% |
Transportation & Commute in Pennington borough
Vehicle Availability by Sex in Pennington borough
The most prevalent vehicle ownership categories in Pennington borough are males with 2 vehicles (354, accounting for 47.6%) and females with 2 vehicles (307, making up 56.1%).
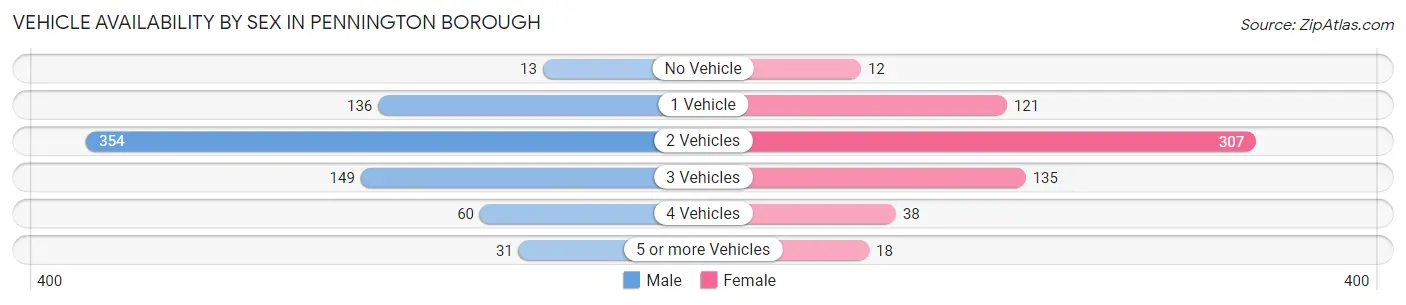
| Vehicles Available | Male | Female |
| No Vehicle | 13 (1.8%) | 12 (1.9%) |
| 1 Vehicle | 136 (18.3%) | 121 (19.2%) |
| 2 Vehicles | 354 (47.6%) | 307 (48.6%) |
| 3 Vehicles | 149 (20.1%) | 135 (21.4%) |
| 4 Vehicles | 60 (8.1%) | 38 (6.0%) |
| 5 or more Vehicles | 31 (4.2%) | 18 (2.9%) |
| Total | 743 (100.0%) | 631 (100.0%) |
Commute Time in Pennington borough
The most frequently occuring commute durations in Pennington borough are 15 to 19 minutes (226 commuters, 20.3%), 20 to 24 minutes (192 commuters, 17.2%), and 5 to 9 minutes (185 commuters, 16.6%).
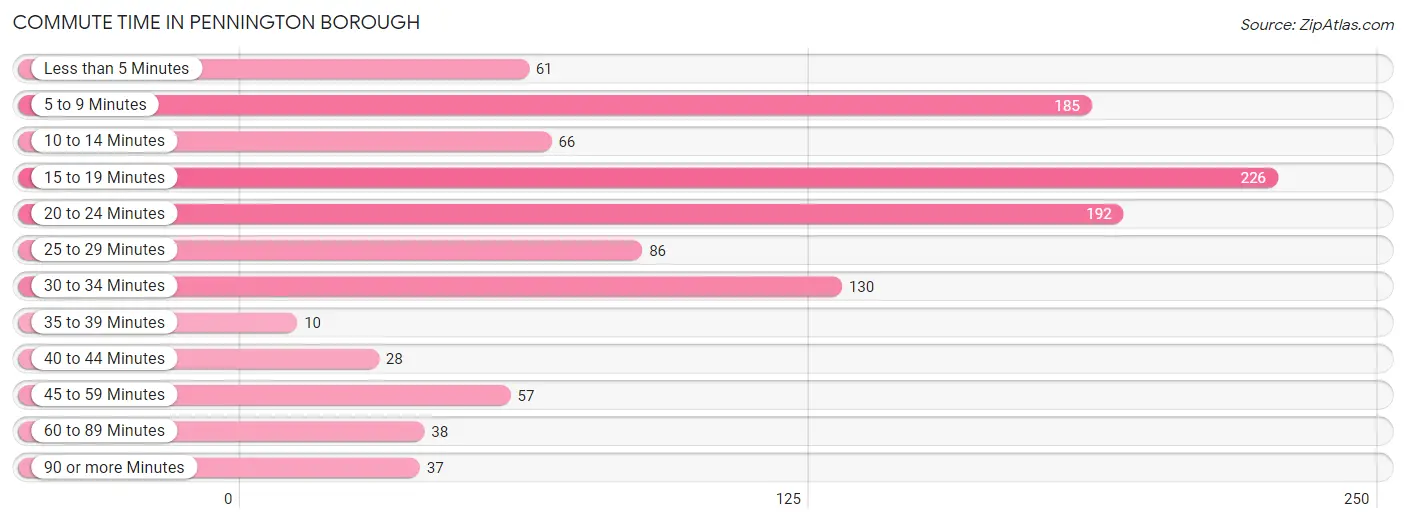
| Commute Time | # Commuters | % Commuters |
| Less than 5 Minutes | 61 | 5.5% |
| 5 to 9 Minutes | 185 | 16.6% |
| 10 to 14 Minutes | 66 | 5.9% |
| 15 to 19 Minutes | 226 | 20.3% |
| 20 to 24 Minutes | 192 | 17.2% |
| 25 to 29 Minutes | 86 | 7.7% |
| 30 to 34 Minutes | 130 | 11.7% |
| 35 to 39 Minutes | 10 | 0.9% |
| 40 to 44 Minutes | 28 | 2.5% |
| 45 to 59 Minutes | 57 | 5.1% |
| 60 to 89 Minutes | 38 | 3.4% |
| 90 or more Minutes | 37 | 3.3% |
Commute Time by Sex in Pennington borough
The most common commute times in Pennington borough are 15 to 19 minutes (161 commuters, 26.6%) for males and 5 to 9 minutes (118 commuters, 23.1%) for females.
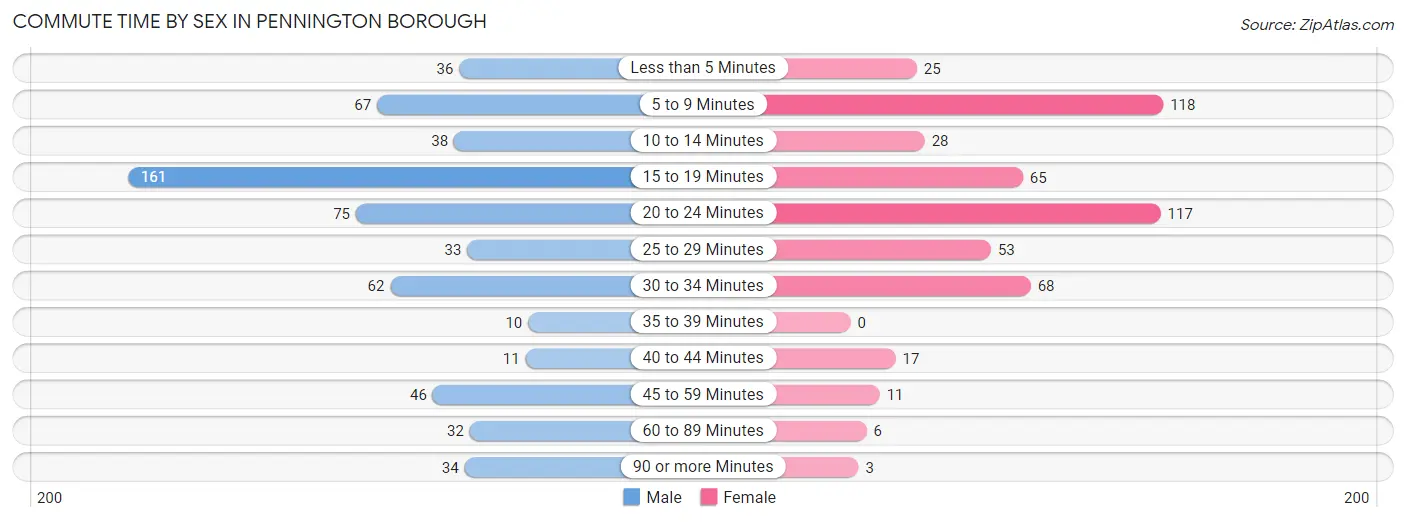
| Commute Time | Male | Female |
| Less than 5 Minutes | 36 (5.9%) | 25 (4.9%) |
| 5 to 9 Minutes | 67 (11.1%) | 118 (23.1%) |
| 10 to 14 Minutes | 38 (6.3%) | 28 (5.5%) |
| 15 to 19 Minutes | 161 (26.6%) | 65 (12.7%) |
| 20 to 24 Minutes | 75 (12.4%) | 117 (22.9%) |
| 25 to 29 Minutes | 33 (5.4%) | 53 (10.4%) |
| 30 to 34 Minutes | 62 (10.2%) | 68 (13.3%) |
| 35 to 39 Minutes | 10 (1.7%) | 0 (0.0%) |
| 40 to 44 Minutes | 11 (1.8%) | 17 (3.3%) |
| 45 to 59 Minutes | 46 (7.6%) | 11 (2.1%) |
| 60 to 89 Minutes | 32 (5.3%) | 6 (1.2%) |
| 90 or more Minutes | 34 (5.6%) | 3 (0.6%) |
Time of Departure to Work by Sex in Pennington borough
The most frequent times of departure to work in Pennington borough are 7:00 AM to 7:29 AM (90, 14.9%) for males and 7:30 AM to 7:59 AM (131, 25.6%) for females.
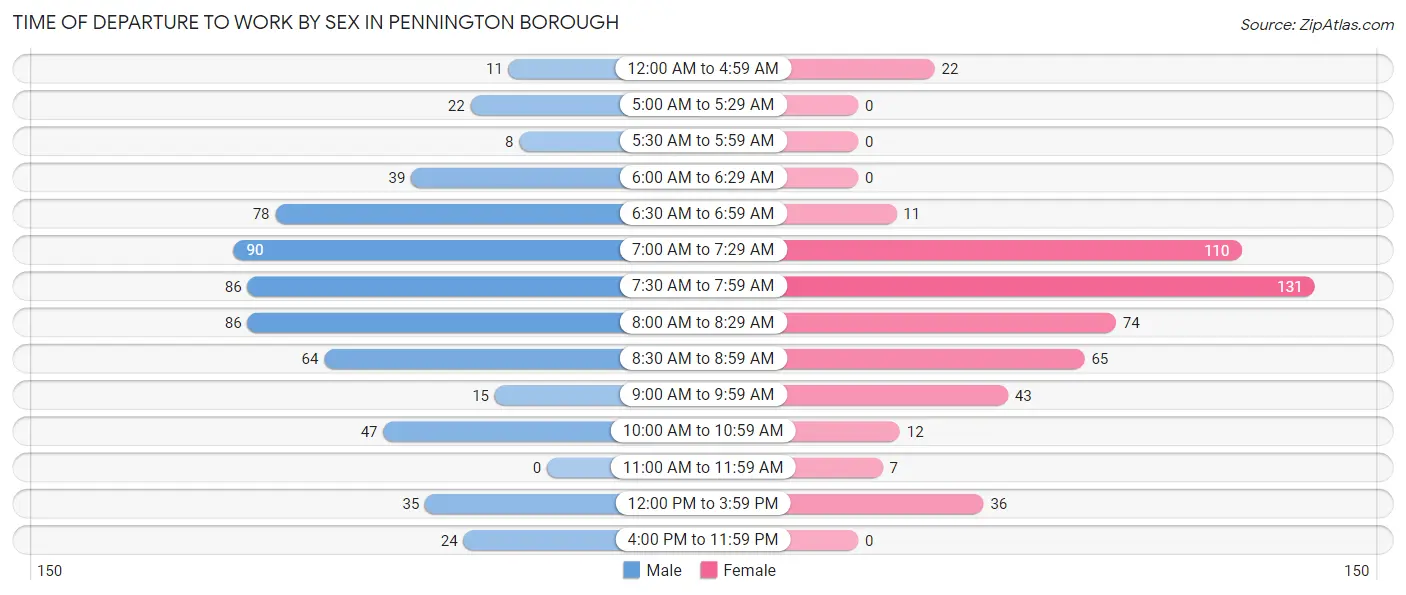
| Time of Departure | Male | Female |
| 12:00 AM to 4:59 AM | 11 (1.8%) | 22 (4.3%) |
| 5:00 AM to 5:29 AM | 22 (3.6%) | 0 (0.0%) |
| 5:30 AM to 5:59 AM | 8 (1.3%) | 0 (0.0%) |
| 6:00 AM to 6:29 AM | 39 (6.5%) | 0 (0.0%) |
| 6:30 AM to 6:59 AM | 78 (12.9%) | 11 (2.1%) |
| 7:00 AM to 7:29 AM | 90 (14.9%) | 110 (21.5%) |
| 7:30 AM to 7:59 AM | 86 (14.2%) | 131 (25.6%) |
| 8:00 AM to 8:29 AM | 86 (14.2%) | 74 (14.5%) |
| 8:30 AM to 8:59 AM | 64 (10.6%) | 65 (12.7%) |
| 9:00 AM to 9:59 AM | 15 (2.5%) | 43 (8.4%) |
| 10:00 AM to 10:59 AM | 47 (7.8%) | 12 (2.4%) |
| 11:00 AM to 11:59 AM | 0 (0.0%) | 7 (1.4%) |
| 12:00 PM to 3:59 PM | 35 (5.8%) | 36 (7.0%) |
| 4:00 PM to 11:59 PM | 24 (4.0%) | 0 (0.0%) |
| Total | 605 (100.0%) | 511 (100.0%) |
Housing Occupancy in Pennington borough
Occupancy by Ownership in Pennington borough
Of the total 1,138 dwellings in Pennington borough, owner-occupied units account for 920 (80.8%), while renter-occupied units make up 218 (19.2%).
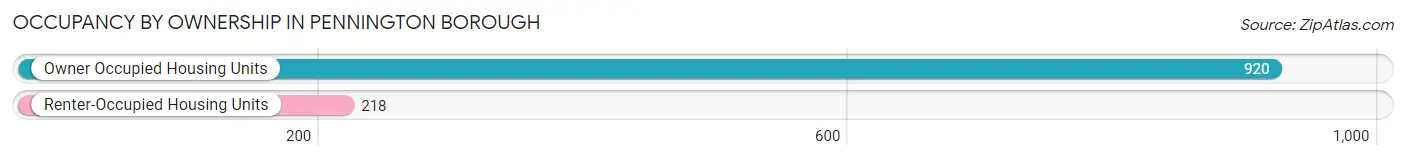
| Occupancy | # Housing Units | % Housing Units |
| Owner Occupied Housing Units | 920 | 80.8% |
| Renter-Occupied Housing Units | 218 | 19.2% |
| Total Occupied Housing Units | 1,138 | 100.0% |
Occupancy by Household Size in Pennington borough
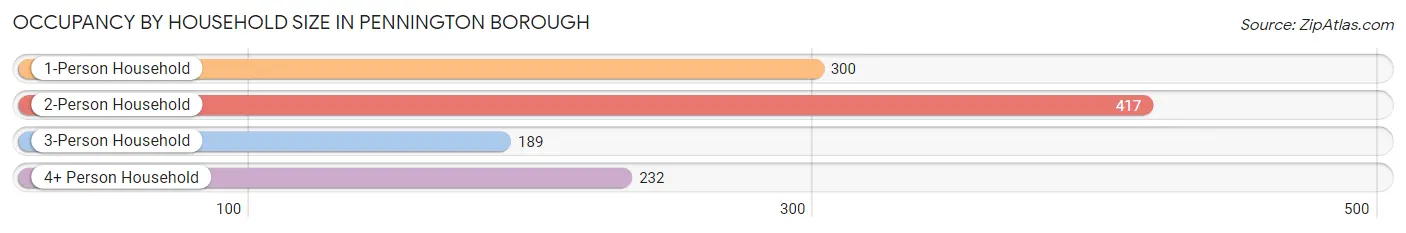
| Household Size | # Housing Units | % Housing Units |
| 1-Person Household | 300 | 26.4% |
| 2-Person Household | 417 | 36.6% |
| 3-Person Household | 189 | 16.6% |
| 4+ Person Household | 232 | 20.4% |
| Total Housing Units | 1,138 | 100.0% |
Occupancy by Ownership by Household Size in Pennington borough
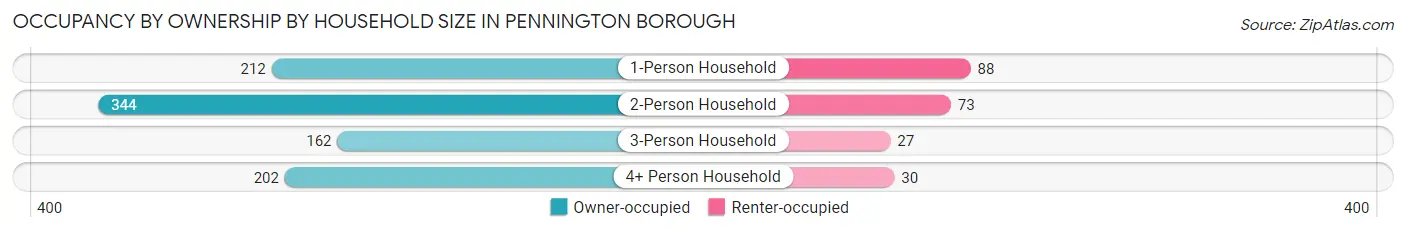
| Household Size | Owner-occupied | Renter-occupied |
| 1-Person Household | 212 (70.7%) | 88 (29.3%) |
| 2-Person Household | 344 (82.5%) | 73 (17.5%) |
| 3-Person Household | 162 (85.7%) | 27 (14.3%) |
| 4+ Person Household | 202 (87.1%) | 30 (12.9%) |
| Total Housing Units | 920 (80.8%) | 218 (19.2%) |
Occupancy by Educational Attainment in Pennington borough
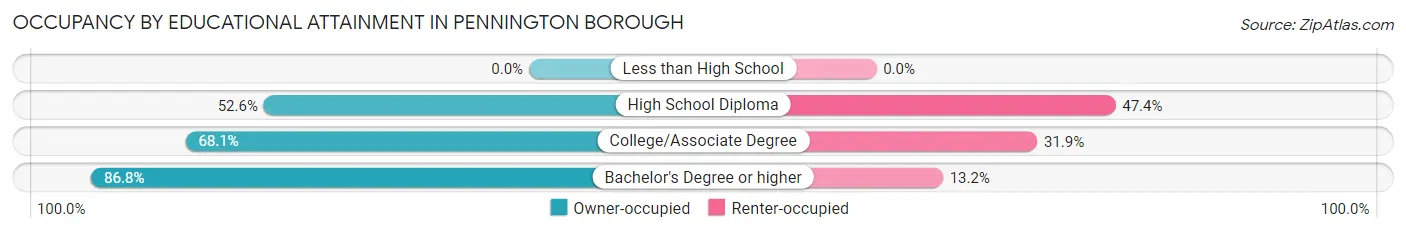
| Household Size | Owner-occupied | Renter-occupied |
| Less than High School | 0 (0.0%) | 0 (0.0%) |
| High School Diploma | 71 (52.6%) | 64 (47.4%) |
| College/Associate Degree | 79 (68.1%) | 37 (31.9%) |
| Bachelor's Degree or higher | 770 (86.8%) | 117 (13.2%) |
Occupancy by Age of Householder in Pennington borough
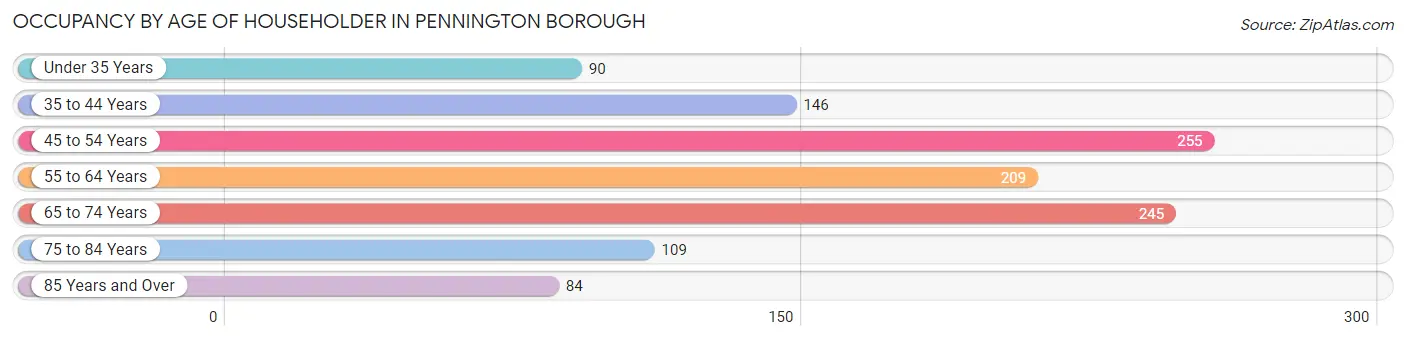
| Age Bracket | # Households | % Households |
| Under 35 Years | 90 | 7.9% |
| 35 to 44 Years | 146 | 12.8% |
| 45 to 54 Years | 255 | 22.4% |
| 55 to 64 Years | 209 | 18.4% |
| 65 to 74 Years | 245 | 21.5% |
| 75 to 84 Years | 109 | 9.6% |
| 85 Years and Over | 84 | 7.4% |
| Total | 1,138 | 100.0% |
Housing Finances in Pennington borough
Median Income by Occupancy in Pennington borough
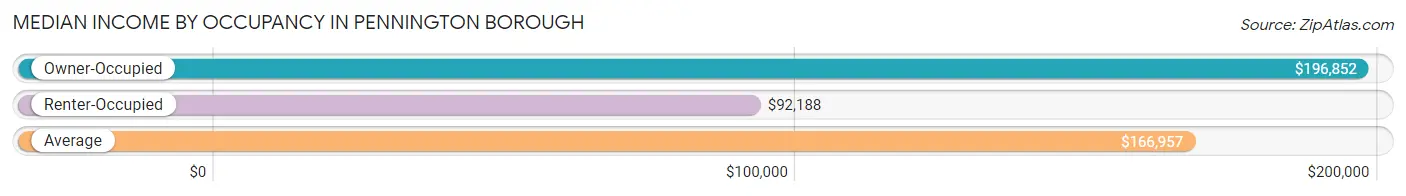
| Occupancy Type | # Households | Median Income |
| Owner-Occupied | 920 (80.8%) | $196,852 |
| Renter-Occupied | 218 (19.2%) | $92,188 |
| Average | 1,138 (100.0%) | $166,957 |
Occupancy by Householder Income Bracket in Pennington borough
| Income Bracket | Owner-occupied | Renter-occupied |
| Less than $5,000 | 0 (0.0%) | 30 (13.8%) |
| $5,000 to $9,999 | 0 (0.0%) | 0 (0.0%) |
| $10,000 to $14,999 | 6 (0.6%) | 0 (0.0%) |
| $15,000 to $19,999 | 21 (2.3%) | 5 (2.3%) |
| $20,000 to $24,999 | 11 (1.2%) | 0 (0.0%) |
| $25,000 to $34,999 | 13 (1.4%) | 0 (0.0%) |
| $35,000 to $49,999 | 33 (3.6%) | 6 (2.8%) |
| $50,000 to $74,999 | 76 (8.3%) | 24 (11.0%) |
| $75,000 to $99,999 | 53 (5.8%) | 47 (21.6%) |
| $100,000 to $149,999 | 123 (13.4%) | 37 (17.0%) |
| $150,000 or more | 584 (63.5%) | 69 (31.7%) |
| Total | 920 (100.0%) | 218 (100.0%) |
Monthly Housing Cost Tiers in Pennington borough
| Monthly Cost | Owner-occupied | Renter-occupied |
| Less than $300 | 0 (0.0%) | 0 (0.0%) |
| $300 to $499 | 25 (2.7%) | 0 (0.0%) |
| $500 to $799 | 24 (2.6%) | 0 (0.0%) |
| $800 to $999 | 30 (3.3%) | 0 (0.0%) |
| $1,000 to $1,499 | 111 (12.1%) | 6 (2.8%) |
| $1,500 to $1,999 | 129 (14.0%) | 125 (57.3%) |
| $2,000 to $2,499 | 117 (12.7%) | 18 (8.3%) |
| $2,500 to $2,999 | 147 (16.0%) | 16 (7.3%) |
| $3,000 or more | 337 (36.6%) | 28 (12.8%) |
| Total | 920 (100.0%) | 218 (100.0%) |
Physical Housing Characteristics in Pennington borough
Housing Structures in Pennington borough
| Structure Type | # Housing Units | % Housing Units |
| Single Unit, Detached | 792 | 69.6% |
| Single Unit, Attached | 157 | 13.8% |
| 2 Unit Apartments | 20 | 1.8% |
| 3 or 4 Unit Apartments | 64 | 5.6% |
| 5 to 9 Unit Apartments | 3 | 0.3% |
| 10 or more Apartments | 102 | 9.0% |
| Mobile Home / Other | 0 | 0.0% |
| Total | 1,138 | 100.0% |
Housing Structures by Occupancy in Pennington borough
| Structure Type | Owner-occupied | Renter-occupied |
| Single Unit, Detached | 724 (91.4%) | 68 (8.6%) |
| Single Unit, Attached | 132 (84.1%) | 25 (15.9%) |
| 2 Unit Apartments | 11 (55.0%) | 9 (45.0%) |
| 3 or 4 Unit Apartments | 21 (32.8%) | 43 (67.2%) |
| 5 to 9 Unit Apartments | 0 (0.0%) | 3 (100.0%) |
| 10 or more Apartments | 32 (31.4%) | 70 (68.6%) |
| Mobile Home / Other | 0 (0.0%) | 0 (0.0%) |
| Total | 920 (80.8%) | 218 (19.2%) |
Housing Structures by Number of Rooms in Pennington borough
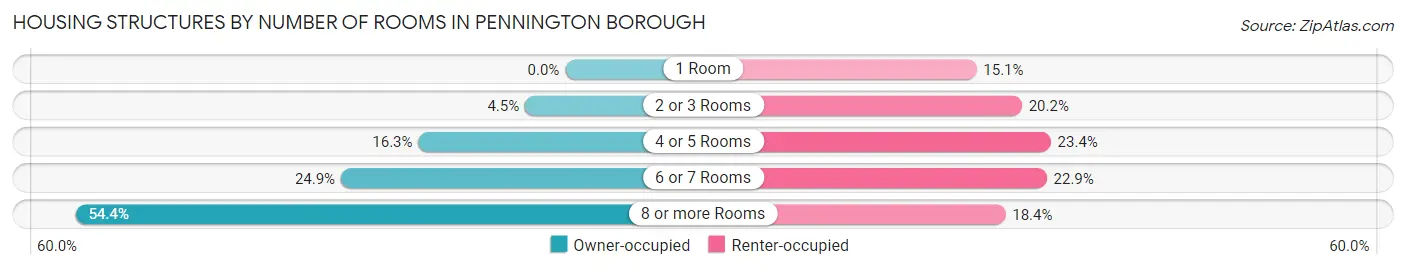
| Number of Rooms | Owner-occupied | Renter-occupied |
| 1 Room | 0 (0.0%) | 33 (15.1%) |
| 2 or 3 Rooms | 41 (4.5%) | 44 (20.2%) |
| 4 or 5 Rooms | 150 (16.3%) | 51 (23.4%) |
| 6 or 7 Rooms | 229 (24.9%) | 50 (22.9%) |
| 8 or more Rooms | 500 (54.3%) | 40 (18.3%) |
| Total | 920 (100.0%) | 218 (100.0%) |
Housing Structure by Heating Type in Pennington borough
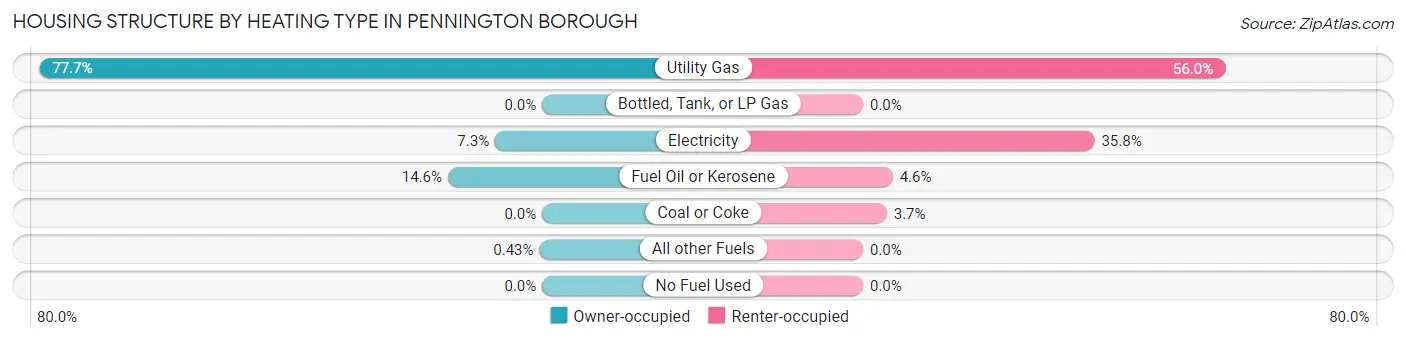
| Heating Type | Owner-occupied | Renter-occupied |
| Utility Gas | 715 (77.7%) | 122 (56.0%) |
| Bottled, Tank, or LP Gas | 0 (0.0%) | 0 (0.0%) |
| Electricity | 67 (7.3%) | 78 (35.8%) |
| Fuel Oil or Kerosene | 134 (14.6%) | 10 (4.6%) |
| Coal or Coke | 0 (0.0%) | 8 (3.7%) |
| All other Fuels | 4 (0.4%) | 0 (0.0%) |
| No Fuel Used | 0 (0.0%) | 0 (0.0%) |
| Total | 920 (100.0%) | 218 (100.0%) |
Household Vehicle Usage in Pennington borough
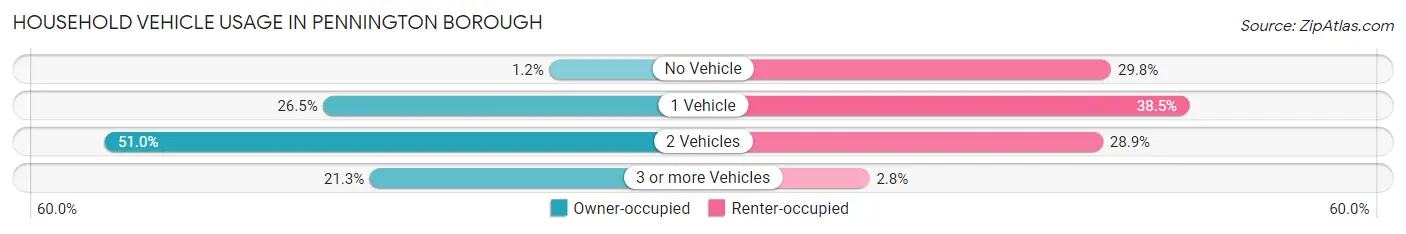
| Vehicles per Household | Owner-occupied | Renter-occupied |
| No Vehicle | 11 (1.2%) | 65 (29.8%) |
| 1 Vehicle | 244 (26.5%) | 84 (38.5%) |
| 2 Vehicles | 469 (51.0%) | 63 (28.9%) |
| 3 or more Vehicles | 196 (21.3%) | 6 (2.8%) |
| Total | 920 (100.0%) | 218 (100.0%) |
Real Estate & Mortgages in Pennington borough
Real Estate and Mortgage Overview in Pennington borough
| Characteristic | Without Mortgage | With Mortgage |
| Housing Units | 348 | 572 |
| Median Property Value | $545,500 | $570,100 |
| Median Household Income | $165,000 | $397 |
| Monthly Housing Costs | $1,501 | $328 |
| Real Estate Taxes | $10,001 | $0 |
Property Value by Mortgage Status in Pennington borough
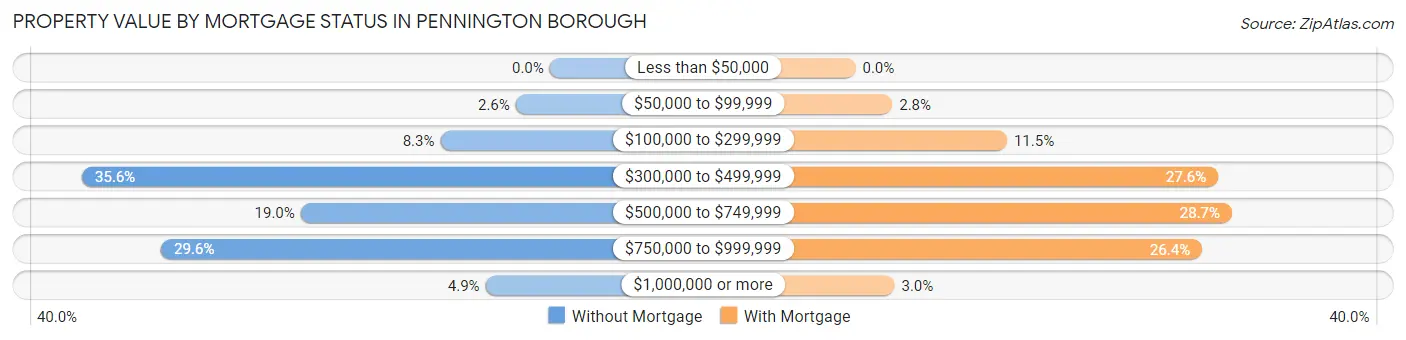
| Property Value | Without Mortgage | With Mortgage |
| Less than $50,000 | 0 (0.0%) | 0 (0.0%) |
| $50,000 to $99,999 | 9 (2.6%) | 16 (2.8%) |
| $100,000 to $299,999 | 29 (8.3%) | 66 (11.5%) |
| $300,000 to $499,999 | 124 (35.6%) | 158 (27.6%) |
| $500,000 to $749,999 | 66 (19.0%) | 164 (28.7%) |
| $750,000 to $999,999 | 103 (29.6%) | 151 (26.4%) |
| $1,000,000 or more | 17 (4.9%) | 17 (3.0%) |
| Total | 348 (100.0%) | 572 (100.0%) |
Household Income by Mortgage Status in Pennington borough
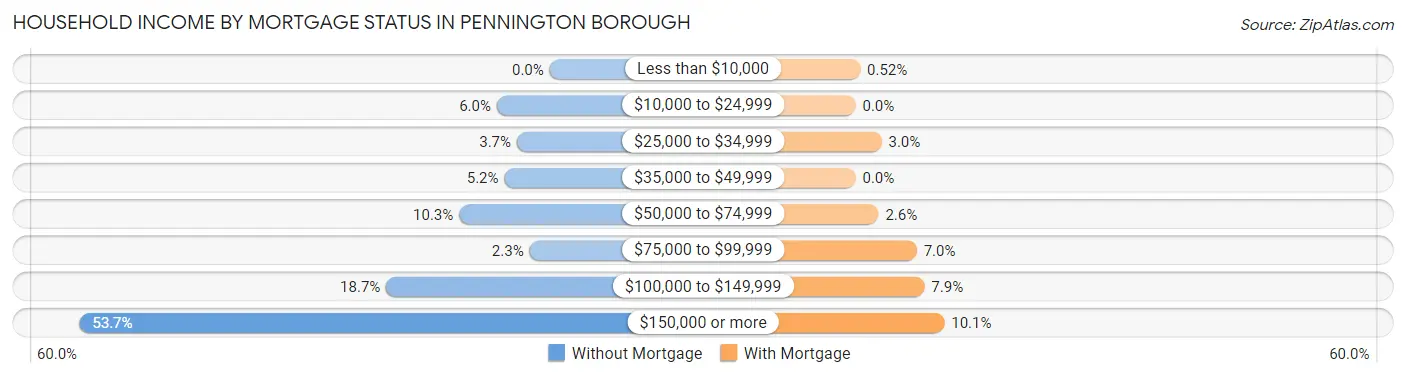
| Household Income | Without Mortgage | With Mortgage |
| Less than $10,000 | 0 (0.0%) | 3 (0.5%) |
| $10,000 to $24,999 | 21 (6.0%) | 0 (0.0%) |
| $25,000 to $34,999 | 13 (3.7%) | 17 (3.0%) |
| $35,000 to $49,999 | 18 (5.2%) | 0 (0.0%) |
| $50,000 to $74,999 | 36 (10.3%) | 15 (2.6%) |
| $75,000 to $99,999 | 8 (2.3%) | 40 (7.0%) |
| $100,000 to $149,999 | 65 (18.7%) | 45 (7.9%) |
| $150,000 or more | 187 (53.7%) | 58 (10.1%) |
| Total | 348 (100.0%) | 572 (100.0%) |
Property Value to Household Income Ratio in Pennington borough
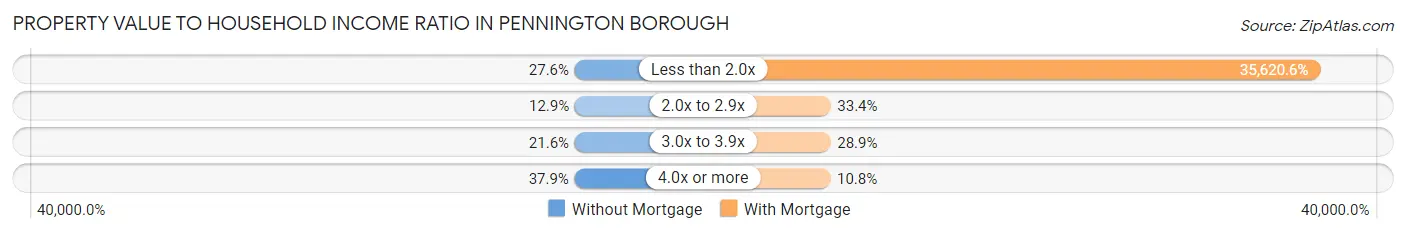
| Value-to-Income Ratio | Without Mortgage | With Mortgage |
| Less than 2.0x | 96 (27.6%) | 203,750 (35,620.6%) |
| 2.0x to 2.9x | 45 (12.9%) | 191 (33.4%) |
| 3.0x to 3.9x | 75 (21.5%) | 165 (28.8%) |
| 4.0x or more | 132 (37.9%) | 62 (10.8%) |
| Total | 348 (100.0%) | 572 (100.0%) |
Real Estate Taxes by Mortgage Status in Pennington borough
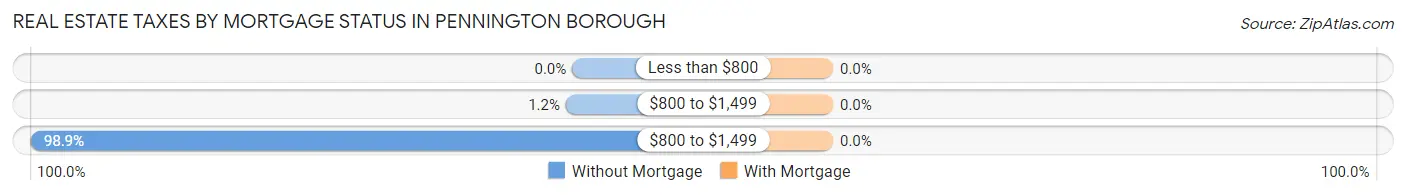
| Property Taxes | Without Mortgage | With Mortgage |
| Less than $800 | 0 (0.0%) | 0 (0.0%) |
| $800 to $1,499 | 4 (1.1%) | 0 (0.0%) |
| $800 to $1,499 | 344 (98.9%) | 0 (0.0%) |
| Total | 348 (100.0%) | 572 (100.0%) |
Health & Disability in Pennington borough
Health Insurance Coverage by Age in Pennington borough
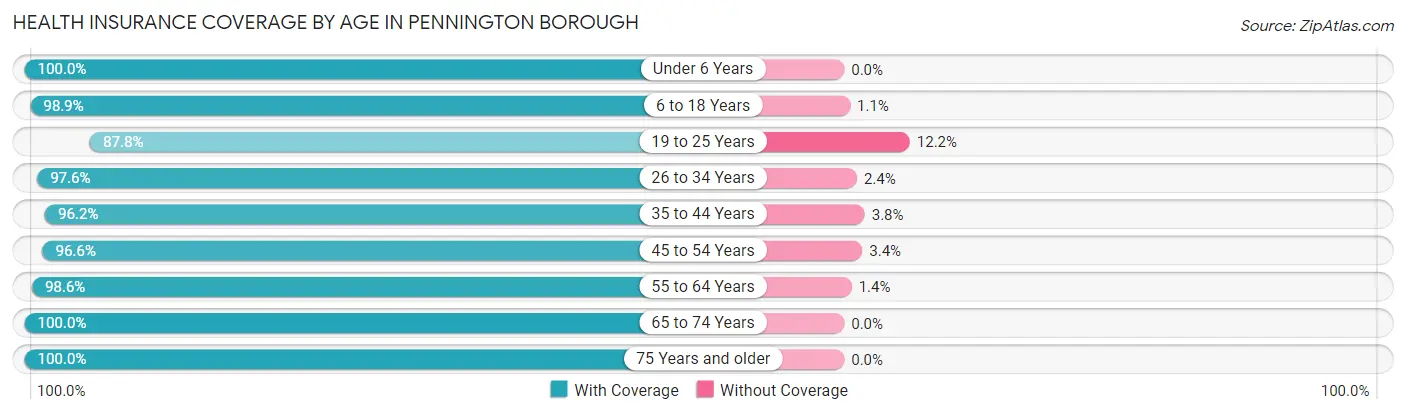
| Age Bracket | With Coverage | Without Coverage |
| Under 6 Years | 174 (100.0%) | 0 (0.0%) |
| 6 to 18 Years | 459 (98.9%) | 5 (1.1%) |
| 19 to 25 Years | 122 (87.8%) | 17 (12.2%) |
| 26 to 34 Years | 207 (97.6%) | 5 (2.4%) |
| 35 to 44 Years | 277 (96.2%) | 11 (3.8%) |
| 45 to 54 Years | 431 (96.6%) | 15 (3.4%) |
| 55 to 64 Years | 430 (98.6%) | 6 (1.4%) |
| 65 to 74 Years | 379 (100.0%) | 0 (0.0%) |
| 75 Years and older | 224 (100.0%) | 0 (0.0%) |
| Total | 2,703 (97.9%) | 59 (2.1%) |
Health Insurance Coverage by Citizenship Status in Pennington borough
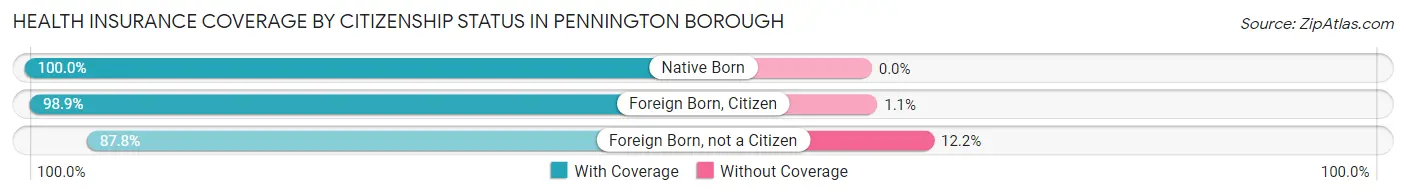
| Citizenship Status | With Coverage | Without Coverage |
| Native Born | 174 (100.0%) | 0 (0.0%) |
| Foreign Born, Citizen | 459 (98.9%) | 5 (1.1%) |
| Foreign Born, not a Citizen | 122 (87.8%) | 17 (12.2%) |
Health Insurance Coverage by Household Income in Pennington borough
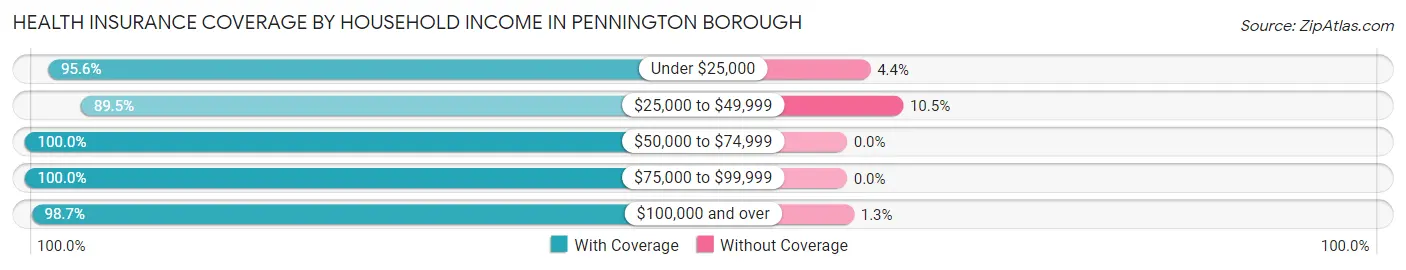
| Household Income | With Coverage | Without Coverage |
| Under $25,000 | 109 (95.6%) | 5 (4.4%) |
| $25,000 to $49,999 | 51 (89.5%) | 6 (10.5%) |
| $50,000 to $74,999 | 219 (100.0%) | 0 (0.0%) |
| $75,000 to $99,999 | 163 (100.0%) | 0 (0.0%) |
| $100,000 and over | 2,112 (98.7%) | 28 (1.3%) |
Public vs Private Health Insurance Coverage by Age in Pennington borough
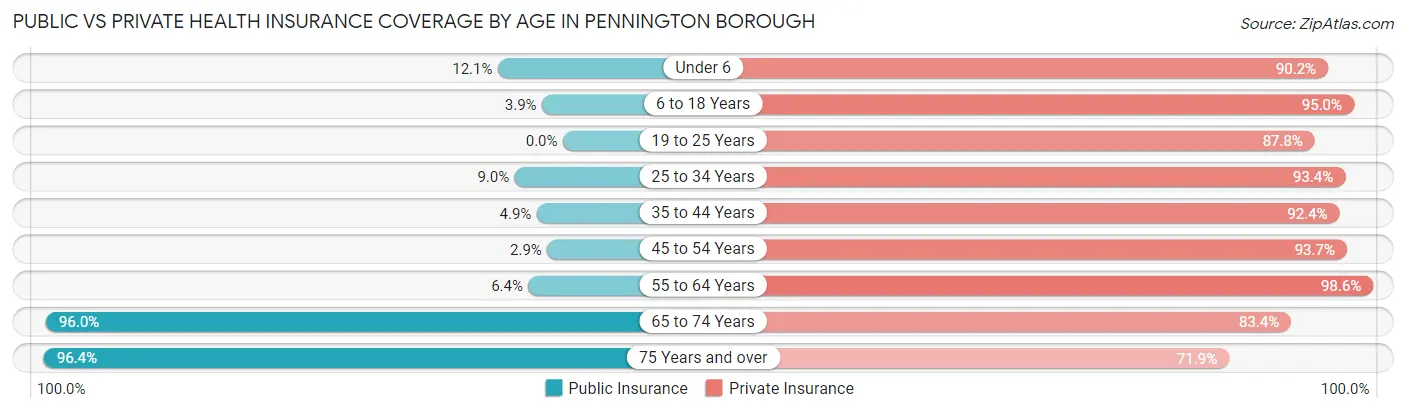
| Age Bracket | Public Insurance | Private Insurance |
| Under 6 | 21 (12.1%) | 157 (90.2%) |
| 6 to 18 Years | 18 (3.9%) | 441 (95.0%) |
| 19 to 25 Years | 0 (0.0%) | 122 (87.8%) |
| 25 to 34 Years | 19 (9.0%) | 198 (93.4%) |
| 35 to 44 Years | 14 (4.9%) | 266 (92.4%) |
| 45 to 54 Years | 13 (2.9%) | 418 (93.7%) |
| 55 to 64 Years | 28 (6.4%) | 430 (98.6%) |
| 65 to 74 Years | 364 (96.0%) | 316 (83.4%) |
| 75 Years and over | 216 (96.4%) | 161 (71.9%) |
| Total | 693 (25.1%) | 2,509 (90.8%) |
Disability Status by Sex by Age in Pennington borough
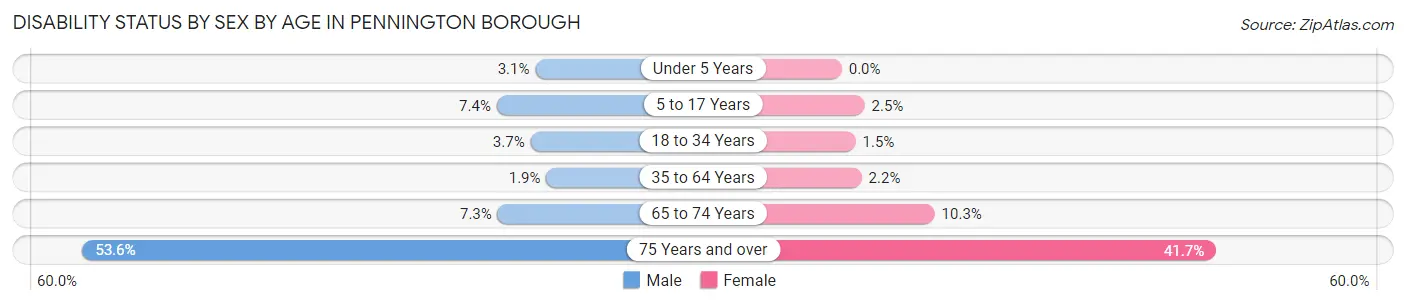
| Age Bracket | Male | Female |
| Under 5 Years | 4 (3.1%) | 0 (0.0%) |
| 5 to 17 Years | 17 (7.4%) | 6 (2.5%) |
| 18 to 34 Years | 6 (3.7%) | 3 (1.5%) |
| 35 to 64 Years | 11 (1.9%) | 13 (2.2%) |
| 65 to 74 Years | 15 (7.3%) | 18 (10.3%) |
| 75 Years and over | 30 (53.6%) | 70 (41.7%) |
Disability Class by Sex by Age in Pennington borough
Disability Class: Hearing Difficulty
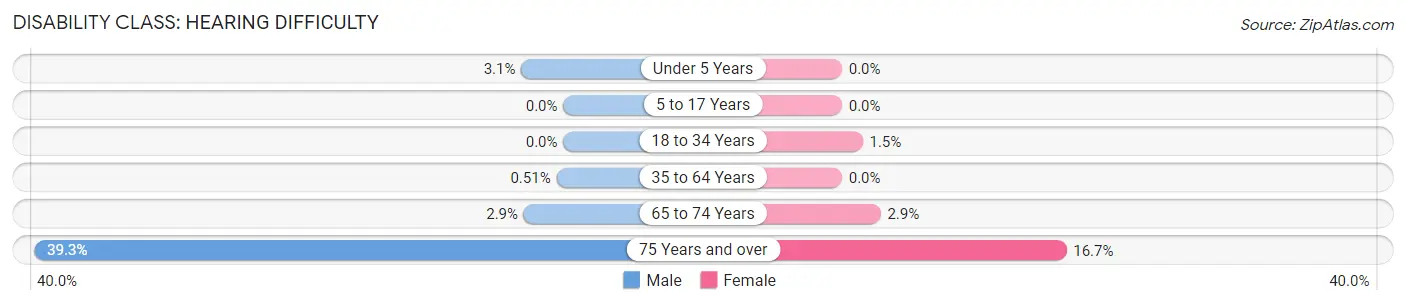
| Age Bracket | Male | Female |
| Under 5 Years | 4 (3.1%) | 0 (0.0%) |
| 5 to 17 Years | 0 (0.0%) | 0 (0.0%) |
| 18 to 34 Years | 0 (0.0%) | 3 (1.5%) |
| 35 to 64 Years | 3 (0.5%) | 0 (0.0%) |
| 65 to 74 Years | 6 (2.9%) | 5 (2.9%) |
| 75 Years and over | 22 (39.3%) | 28 (16.7%) |
Disability Class: Vision Difficulty
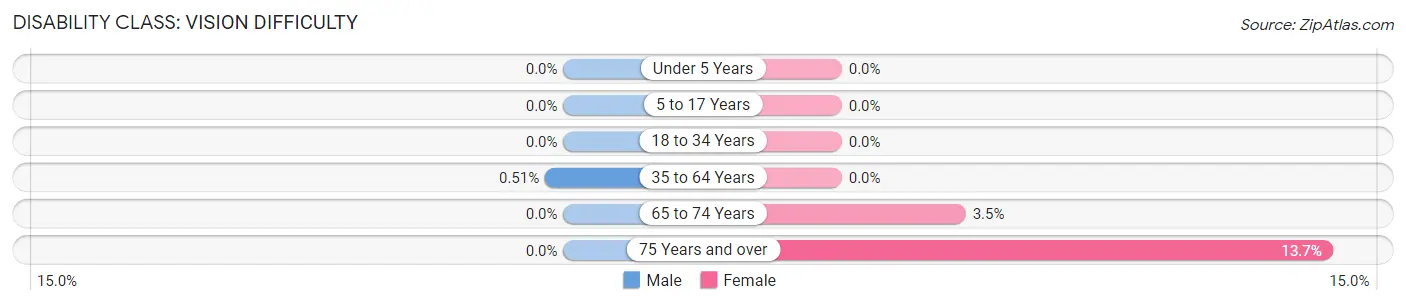
| Age Bracket | Male | Female |
| Under 5 Years | 0 (0.0%) | 0 (0.0%) |
| 5 to 17 Years | 0 (0.0%) | 0 (0.0%) |
| 18 to 34 Years | 0 (0.0%) | 0 (0.0%) |
| 35 to 64 Years | 3 (0.5%) | 0 (0.0%) |
| 65 to 74 Years | 0 (0.0%) | 6 (3.5%) |
| 75 Years and over | 0 (0.0%) | 23 (13.7%) |
Disability Class: Cognitive Difficulty
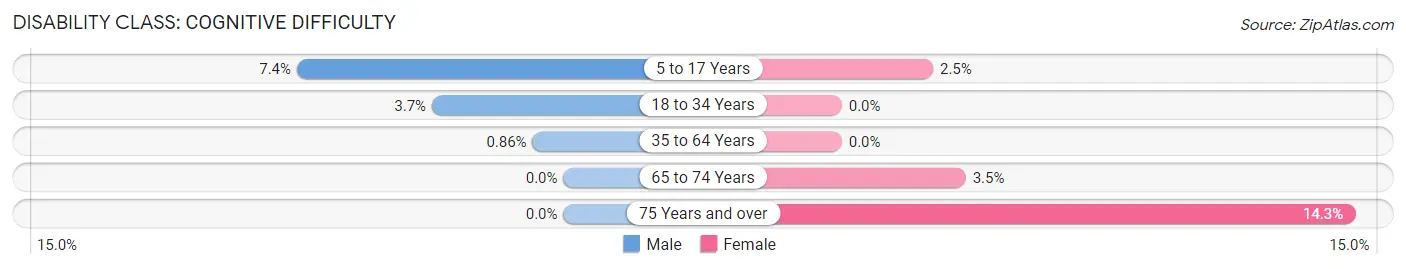
| Age Bracket | Male | Female |
| 5 to 17 Years | 17 (7.4%) | 6 (2.5%) |
| 18 to 34 Years | 6 (3.7%) | 0 (0.0%) |
| 35 to 64 Years | 5 (0.9%) | 0 (0.0%) |
| 65 to 74 Years | 0 (0.0%) | 6 (3.5%) |
| 75 Years and over | 0 (0.0%) | 24 (14.3%) |
Disability Class: Ambulatory Difficulty
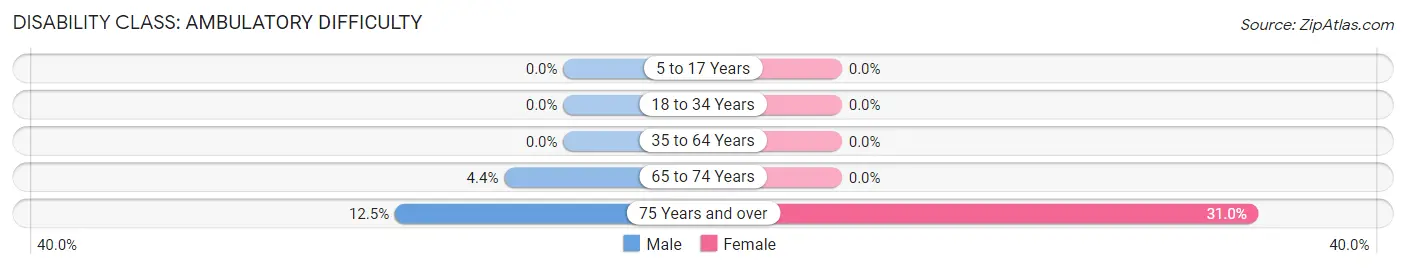
| Age Bracket | Male | Female |
| 5 to 17 Years | 0 (0.0%) | 0 (0.0%) |
| 18 to 34 Years | 0 (0.0%) | 0 (0.0%) |
| 35 to 64 Years | 0 (0.0%) | 0 (0.0%) |
| 65 to 74 Years | 9 (4.4%) | 0 (0.0%) |
| 75 Years and over | 7 (12.5%) | 52 (30.9%) |
Disability Class: Self-Care Difficulty
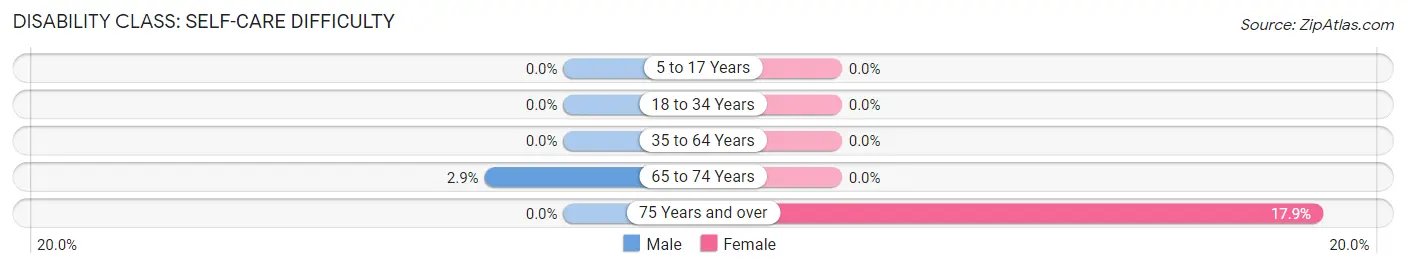
| Age Bracket | Male | Female |
| 5 to 17 Years | 0 (0.0%) | 0 (0.0%) |
| 18 to 34 Years | 0 (0.0%) | 0 (0.0%) |
| 35 to 64 Years | 0 (0.0%) | 0 (0.0%) |
| 65 to 74 Years | 6 (2.9%) | 0 (0.0%) |
| 75 Years and over | 0 (0.0%) | 30 (17.9%) |
Technology Access in Pennington borough
Computing Device Access in Pennington borough
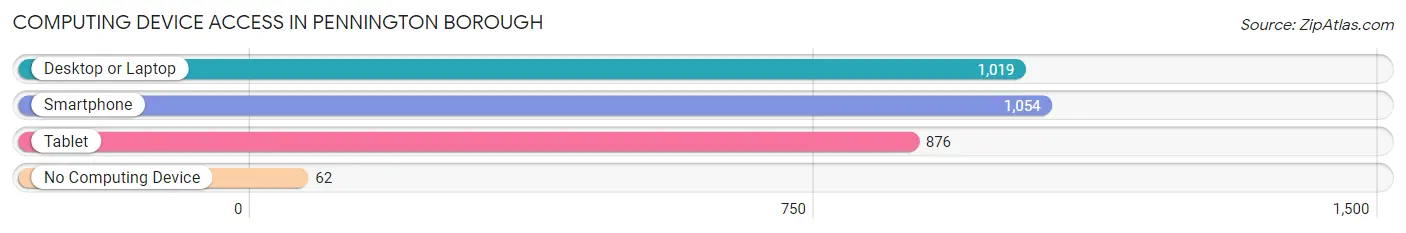
| Device Type | # Households | % Households |
| Desktop or Laptop | 1,019 | 89.5% |
| Smartphone | 1,054 | 92.6% |
| Tablet | 876 | 77.0% |
| No Computing Device | 62 | 5.4% |
| Total | 1,138 | 100.0% |
Internet Access in Pennington borough
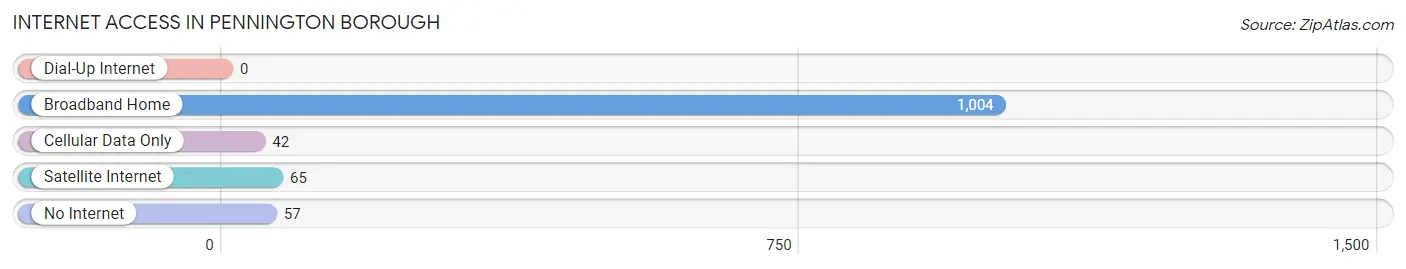
| Internet Type | # Households | % Households |
| Dial-Up Internet | 0 | 0.0% |
| Broadband Home | 1,004 | 88.2% |
| Cellular Data Only | 42 | 3.7% |
| Satellite Internet | 65 | 5.7% |
| No Internet | 57 | 5.0% |
| Total | 1,138 | 100.0% |
Pennington borough Summary
Pennington Borough is a small borough located in Mercer County, New Jersey. It is situated in the heart of the Delaware Valley, just a few miles from the state capital of Trenton. The borough is home to a population of 2,585 people, according to the 2010 United States Census.
History
Pennington Borough was first settled in the late 1700s by a group of Quakers from Bucks County, Pennsylvania. The area was originally known as "The Great Swamp" and was used for hunting and fishing. In 1790, the area was officially incorporated as Pennington Borough. The name was chosen in honor of Thomas Pennington, a prominent Quaker leader who had been instrumental in the settlement of the area.
In the early 1800s, Pennington Borough began to grow and develop. The first school was built in 1809, and the first post office was established in 1820. The first church was built in 1825, and the first newspaper was published in 1829.
The borough continued to grow and develop throughout the 19th century. In 1876, the first railroad line was built, connecting Pennington to Trenton. This allowed for increased trade and commerce, and the borough began to thrive.
Geography
Pennington Borough is located in Mercer County, New Jersey. It is situated in the heart of the Delaware Valley, just a few miles from the state capital of Trenton. The borough is bordered by Hopewell Township to the north, Lawrence Township to the east, Ewing Township to the south, and West Amwell Township to the west.
The borough covers an area of 1.3 square miles, all of which is land. The terrain is mostly flat, with some rolling hills in the northern part of the borough. The highest point in the borough is located at the intersection of Pennington-Rocky Hill Road and Pennington-Hopewell Road, where the elevation is approximately 200 feet above sea level.
Economy
The economy of Pennington Borough is largely based on small businesses and retail. The borough is home to a variety of small businesses, including restaurants, shops, and professional services. The borough also has a number of larger employers, including the Pennington School, a private K-12 school, and the Pennington Medical Center, a hospital and medical center.
Demographics
As of the 2010 United States Census, Pennington Borough had a population of 2,585 people. The racial makeup of the borough was 87.3% White, 5.7% African American, 0.2% Native American, 4.2% Asian, 0.1% Pacific Islander, and 2.5% from other races. Hispanic or Latino of any race were 5.3% of the population.
The median household income in Pennington Borough was $107,917, and the median family income was $125,917. The per capita income was $50,917. About 4.3% of families and 5.2% of the population were below the poverty line.
Pennington Borough is a small borough with a rich history and a vibrant economy. It is home to a diverse population and a variety of businesses and services. The borough is a great place to live, work, and play.
Common Questions
What is Per Capita Income in Pennington borough?
Per Capita income in Pennington borough is $84,590.
What is the Median Family Income in Pennington borough?
Median Family Income in Pennington borough is $195,926.
What is the Median Household income in Pennington borough?
Median Household Income in Pennington borough is $166,957.
What is Income or Wage Gap in Pennington borough?
Income or Wage Gap in Pennington borough is 10.9%.
Women in Pennington borough earn 89.1 cents for every dollar earned by a man.
What is Inequality or Gini Index in Pennington borough?
Inequality or Gini Index in Pennington borough is 0.41.
What is the Total Population of Pennington borough?
Total Population of Pennington borough is 2,780.
What is the Total Male Population of Pennington borough?
Total Male Population of Pennington borough is 1,370.
What is the Total Female Population of Pennington borough?
Total Female Population of Pennington borough is 1,410.
What is the Ratio of Males per 100 Females in Pennington borough?
There are 97.16 Males per 100 Females in Pennington borough.
What is the Ratio of Females per 100 Males in Pennington borough?
There are 102.92 Females per 100 Males in Pennington borough.
What is the Median Population Age in Pennington borough?
Median Population Age in Pennington borough is 47.5 Years.
What is the Average Family Size in Pennington borough
Average Family Size in Pennington borough is 2.9 People.
What is the Average Household Size in Pennington borough
Average Household Size in Pennington borough is 2.4 People.
How Large is the Labor Force in Pennington borough?
There are 1,515 People in the Labor Forcein in Pennington borough.
What is the Percentage of People in the Labor Force in Pennington borough?
66.3% of People are in the Labor Force in Pennington borough.
What is the Unemployment Rate in Pennington borough?
Unemployment Rate in Pennington borough is 2.8%.