Cities with the Highest Percentage of Bhutanese Population in New Jersey
RELATED REPORTS & OPTIONS
Bhutanese
New Jersey
Compare Cities
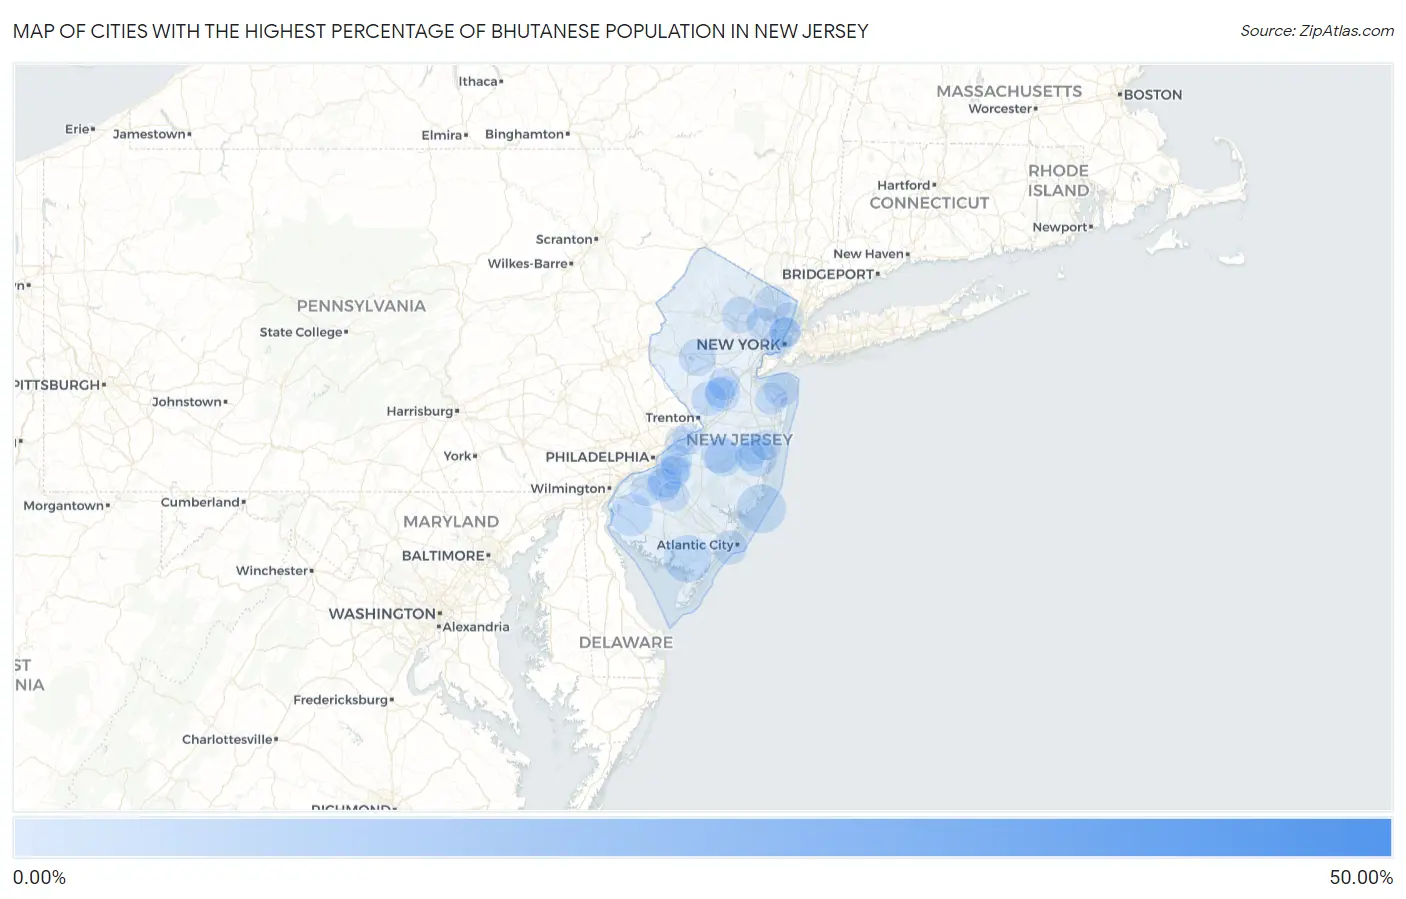
Map of Cities with the Highest Percentage of Bhutanese Population in New Jersey
0.00%
50.00%
Cities with the Highest Percentage of Bhutanese Population in New Jersey
| City | Bhutanese | vs State | vs National | |
| 1. | Deerfield Street | 46.00% | 0.29%(+45.7)#1 | 0.49%(+45.5)#3 |
| 2. | Laurel Heights | 9.96% | 0.29%(+9.67)#2 | 0.49%(+9.47)#144 |
| 3. | Newtonville | 8.83% | 0.29%(+8.55)#3 | 0.49%(+8.35)#158 |
| 4. | Edgewater Borough | 7.44% | 0.29%(+7.15)#4 | 0.49%(+6.95)#183 |
| 5. | Ocean Gate Borough | 5.59% | 0.29%(+5.30)#5 | 0.49%(+5.10)#245 |
| 6. | North Beach Haven | 3.73% | 0.29%(+3.45)#6 | 0.49%(+3.25)#366 |
| 7. | Springfield | 3.56% | 0.29%(+3.27)#7 | 0.49%(+3.07)#380 |
| 8. | Fort Lee Borough | 3.53% | 0.29%(+3.24)#8 | 0.49%(+3.04)#384 |
| 9. | Belleplain | 3.46% | 0.29%(+3.17)#9 | 0.49%(+2.97)#393 |
| 10. | Carlls Corner | 3.02% | 0.29%(+2.73)#10 | 0.49%(+2.53)#454 |
| 11. | Glen Rock Borough | 2.78% | 0.29%(+2.49)#11 | 0.49%(+2.29)#502 |
| 12. | Alloway | 2.66% | 0.29%(+2.37)#12 | 0.49%(+2.17)#533 |
| 13. | Little Ferry Borough | 2.57% | 0.29%(+2.29)#13 | 0.49%(+2.09)#555 |
| 14. | Demarest Borough | 2.56% | 0.29%(+2.27)#14 | 0.49%(+2.07)#559 |
| 15. | The Hills | 2.51% | 0.29%(+2.23)#15 | 0.49%(+2.03)#569 |
| 16. | Saddle River Borough | 2.50% | 0.29%(+2.21)#16 | 0.49%(+2.01)#572 |
| 17. | Norwood Borough | 2.33% | 0.29%(+2.05)#17 | 0.49%(+1.85)#624 |
| 18. | Berlin Borough | 2.28% | 0.29%(+2.00)#18 | 0.49%(+1.80)#641 |
| 19. | Silver Lake | 2.16% | 0.29%(+1.88)#19 | 0.49%(+1.68)#704 |
| 20. | Ridgefield Borough | 2.08% | 0.29%(+1.79)#20 | 0.49%(+1.59)#743 |
| 21. | Caldwell Borough | 2.06% | 0.29%(+1.77)#21 | 0.49%(+1.57)#751 |
| 22. | Holiday City South | 1.97% | 0.29%(+1.69)#22 | 0.49%(+1.48)#784 |
| 23. | Leonia Borough | 1.95% | 0.29%(+1.67)#23 | 0.49%(+1.46)#793 |
| 24. | South Toms River Borough | 1.94% | 0.29%(+1.65)#24 | 0.49%(+1.45)#799 |
| 25. | Country Lake Estates | 1.87% | 0.29%(+1.58)#25 | 0.49%(+1.38)#831 |
| 26. | Allendale Borough | 1.82% | 0.29%(+1.53)#26 | 0.49%(+1.33)#869 |
| 27. | White House Station | 1.77% | 0.29%(+1.48)#27 | 0.49%(+1.28)#905 |
| 28. | Closter Borough | 1.77% | 0.29%(+1.48)#28 | 0.49%(+1.28)#909 |
| 29. | Ridgewood | 1.74% | 0.29%(+1.45)#29 | 0.49%(+1.25)#927 |
| 30. | Browns Mills | 1.72% | 0.29%(+1.43)#30 | 0.49%(+1.23)#940 |
| 31. | Boonton | 1.66% | 0.29%(+1.38)#31 | 0.49%(+1.18)#985 |
| 32. | Farmingdale Borough | 1.66% | 0.29%(+1.37)#32 | 0.49%(+1.17)#989 |
| 33. | Pennington Borough | 1.58% | 0.29%(+1.30)#33 | 0.49%(+1.10)#1,059 |
| 34. | Mckee | 1.57% | 0.29%(+1.28)#34 | 0.49%(+1.08)#1,068 |
| 35. | Fieldsboro Borough | 1.50% | 0.29%(+1.22)#35 | 0.49%(+1.02)#1,113 |
| 36. | Monmouth Junction | 1.46% | 0.29%(+1.17)#36 | 0.49%(+0.969)#1,157 |
| 37. | Haworth Borough | 1.35% | 0.29%(+1.06)#37 | 0.49%(+0.859)#1,243 |
| 38. | Lyons | 1.34% | 0.29%(+1.06)#38 | 0.49%(+0.856)#1,249 |
| 39. | Navesink | 1.33% | 0.29%(+1.05)#39 | 0.49%(+0.844)#1,263 |
| 40. | Princeton | 1.32% | 0.29%(+1.04)#40 | 0.49%(+0.836)#1,270 |
| 41. | Neshanic | 1.32% | 0.29%(+1.03)#41 | 0.49%(+0.833)#1,274 |
| 42. | New Gretna | 1.30% | 0.29%(+1.01)#42 | 0.49%(+0.811)#1,305 |
| 43. | Ventnor City | 1.26% | 0.29%(+0.974)#43 | 0.49%(+0.773)#1,348 |
| 44. | Blackwood | 1.24% | 0.29%(+0.956)#44 | 0.49%(+0.755)#1,366 |
| 45. | Echelon | 1.21% | 0.29%(+0.924)#45 | 0.49%(+0.723)#1,398 |
| 46. | Rutgers University-Busch Campus | 1.19% | 0.29%(+0.899)#46 | 0.49%(+0.698)#1,427 |
| 47. | Millington | 1.16% | 0.29%(+0.870)#47 | 0.49%(+0.669)#1,467 |
| 48. | Englewood Cliffs Borough | 1.12% | 0.29%(+0.836)#48 | 0.49%(+0.635)#1,506 |
| 49. | Turnersville | 1.10% | 0.29%(+0.818)#49 | 0.49%(+0.617)#1,526 |
| 50. | Hampton Borough | 1.03% | 0.29%(+0.747)#50 | 0.49%(+0.546)#1,619 |
| 51. | Lincroft | 1.02% | 0.29%(+0.729)#51 | 0.49%(+0.528)#1,652 |
| 52. | Midland Park Borough | 1.00% | 0.29%(+0.710)#52 | 0.49%(+0.509)#1,690 |
| 53. | Shiloh Borough | 0.98% | 0.29%(+0.697)#53 | 0.49%(+0.496)#1,719 |
| 54. | Bloomingdale Borough | 0.96% | 0.29%(+0.671)#54 | 0.49%(+0.470)#1,763 |
| 55. | Old Tappan Borough | 0.96% | 0.29%(+0.669)#55 | 0.49%(+0.468)#1,769 |
| 56. | Upper Montclair | 0.94% | 0.29%(+0.654)#56 | 0.49%(+0.453)#1,796 |
| 57. | Mullica Hill | 0.92% | 0.29%(+0.634)#57 | 0.49%(+0.433)#1,838 |
| 58. | Franklin Park | 0.91% | 0.29%(+0.622)#58 | 0.49%(+0.421)#1,864 |
| 59. | River Edge Borough | 0.91% | 0.29%(+0.620)#59 | 0.49%(+0.419)#1,871 |
| 60. | Ho Ho Kus Borough | 0.90% | 0.29%(+0.611)#60 | 0.49%(+0.410)#1,893 |
| 61. | Pemberton Borough | 0.90% | 0.29%(+0.610)#61 | 0.49%(+0.409)#1,895 |
| 62. | Sicklerville | 0.90% | 0.29%(+0.610)#62 | 0.49%(+0.409)#1,897 |
| 63. | Tenafly Borough | 0.88% | 0.29%(+0.596)#63 | 0.49%(+0.395)#1,928 |
| 64. | Hopewell Borough | 0.88% | 0.29%(+0.590)#64 | 0.49%(+0.389)#1,942 |
| 65. | Guttenberg | 0.88% | 0.29%(+0.589)#65 | 0.49%(+0.388)#1,947 |
| 66. | Burlington | 0.87% | 0.29%(+0.588)#66 | 0.49%(+0.387)#1,953 |
| 67. | Spotswood Borough | 0.87% | 0.29%(+0.586)#67 | 0.49%(+0.385)#1,960 |
| 68. | Montvale Borough | 0.84% | 0.29%(+0.557)#68 | 0.49%(+0.356)#2,024 |
| 69. | Alpine Borough | 0.83% | 0.29%(+0.542)#69 | 0.49%(+0.341)#2,058 |
| 70. | Avalon Borough | 0.82% | 0.29%(+0.536)#70 | 0.49%(+0.335)#2,071 |
| 71. | Great Notch | 0.82% | 0.29%(+0.535)#71 | 0.49%(+0.334)#2,076 |
| 72. | Ramapo College Of New Jersey | 0.80% | 0.29%(+0.516)#72 | 0.49%(+0.315)#2,123 |
| 73. | Glen Ridge Borough | 0.80% | 0.29%(+0.509)#73 | 0.49%(+0.308)#2,146 |
| 74. | Maywood Borough | 0.79% | 0.29%(+0.500)#74 | 0.49%(+0.299)#2,167 |
| 75. | Leisure Village West | 0.79% | 0.29%(+0.499)#75 | 0.49%(+0.298)#2,168 |
| 76. | William Paterson University Of New Jersey | 0.77% | 0.29%(+0.488)#76 | 0.49%(+0.287)#2,201 |
| 77. | Oradell Borough | 0.77% | 0.29%(+0.481)#77 | 0.49%(+0.280)#2,218 |
| 78. | Oaklyn Borough | 0.76% | 0.29%(+0.476)#78 | 0.49%(+0.275)#2,228 |
| 79. | Ramblewood | 0.76% | 0.29%(+0.473)#79 | 0.49%(+0.272)#2,233 |
| 80. | Springdale | 0.75% | 0.29%(+0.461)#80 | 0.49%(+0.260)#2,258 |
| 81. | Matawan Borough | 0.71% | 0.29%(+0.426)#81 | 0.49%(+0.225)#2,338 |
| 82. | Rutherford Borough | 0.70% | 0.29%(+0.417)#82 | 0.49%(+0.216)#2,368 |
| 83. | Williamstown | 0.68% | 0.29%(+0.397)#83 | 0.49%(+0.196)#2,417 |
| 84. | Cliffside Park Borough | 0.68% | 0.29%(+0.391)#84 | 0.49%(+0.190)#2,431 |
| 85. | Englewood | 0.65% | 0.29%(+0.359)#85 | 0.49%(+0.158)#2,521 |
| 86. | Fair Lawn Borough | 0.64% | 0.29%(+0.354)#86 | 0.49%(+0.153)#2,536 |
| 87. | Palisades Park Borough | 0.64% | 0.29%(+0.351)#87 | 0.49%(+0.150)#2,545 |
| 88. | Pine Ridge At Crestwood | 0.64% | 0.29%(+0.349)#88 | 0.49%(+0.148)#2,555 |
| 89. | Heathcote | 0.62% | 0.29%(+0.334)#89 | 0.49%(+0.133)#2,619 |
| 90. | Mountainside Borough | 0.62% | 0.29%(+0.329)#90 | 0.49%(+0.128)#2,633 |
| 91. | Metuchen Borough | 0.62% | 0.29%(+0.329)#91 | 0.49%(+0.128)#2,634 |
| 92. | Paramus Borough | 0.60% | 0.29%(+0.315)#92 | 0.49%(+0.114)#2,670 |
| 93. | Leisure Village East | 0.60% | 0.29%(+0.315)#93 | 0.49%(+0.114)#2,671 |
| 94. | Jersey City | 0.57% | 0.29%(+0.283)#94 | 0.49%(+0.082)#2,783 |
| 95. | Newport | 0.57% | 0.29%(+0.281)#95 | 0.49%(+0.080)#2,794 |
| 96. | Riverdale Borough | 0.56% | 0.29%(+0.277)#96 | 0.49%(+0.076)#2,819 |
| 97. | Beverly | 0.56% | 0.29%(+0.273)#97 | 0.49%(+0.072)#2,838 |
| 98. | West New York | 0.55% | 0.29%(+0.267)#98 | 0.49%(+0.066)#2,863 |
| 99. | Franklin Lakes Borough | 0.54% | 0.29%(+0.250)#99 | 0.49%(+0.049)#2,929 |
| 100. | National Park Borough | 0.53% | 0.29%(+0.242)#100 | 0.49%(+0.041)#2,963 |
Common Questions
What are the Top 10 Cities with the Highest Percentage of Bhutanese Population in New Jersey?
Top 10 Cities with the Highest Percentage of Bhutanese Population in New Jersey are:
#1
3.73%
#2
3.46%
#3
2.66%
#4
1.97%
#5
1.87%
#6
1.77%
#7
1.74%
#8
1.72%
#9
1.66%
#10
1.46%
What city has the Highest Percentage of Bhutanese Population in New Jersey?
North Beach Haven has the Highest Percentage of Bhutanese Population in New Jersey with 3.73%.
What is the Percentage of Bhutanese Population in the State of New Jersey?
Percentage of Bhutanese Population in New Jersey is 0.29%.
What is the Percentage of Bhutanese Population in the United States?
Percentage of Bhutanese Population in the United States is 0.49%.