Cities with the Highest Child Poverty Level Among Boys Under the Age of 16 in New Jersey
RELATED REPORTS & OPTIONS
Highest Poverty | Boys 0-16
New Jersey
Compare Cities
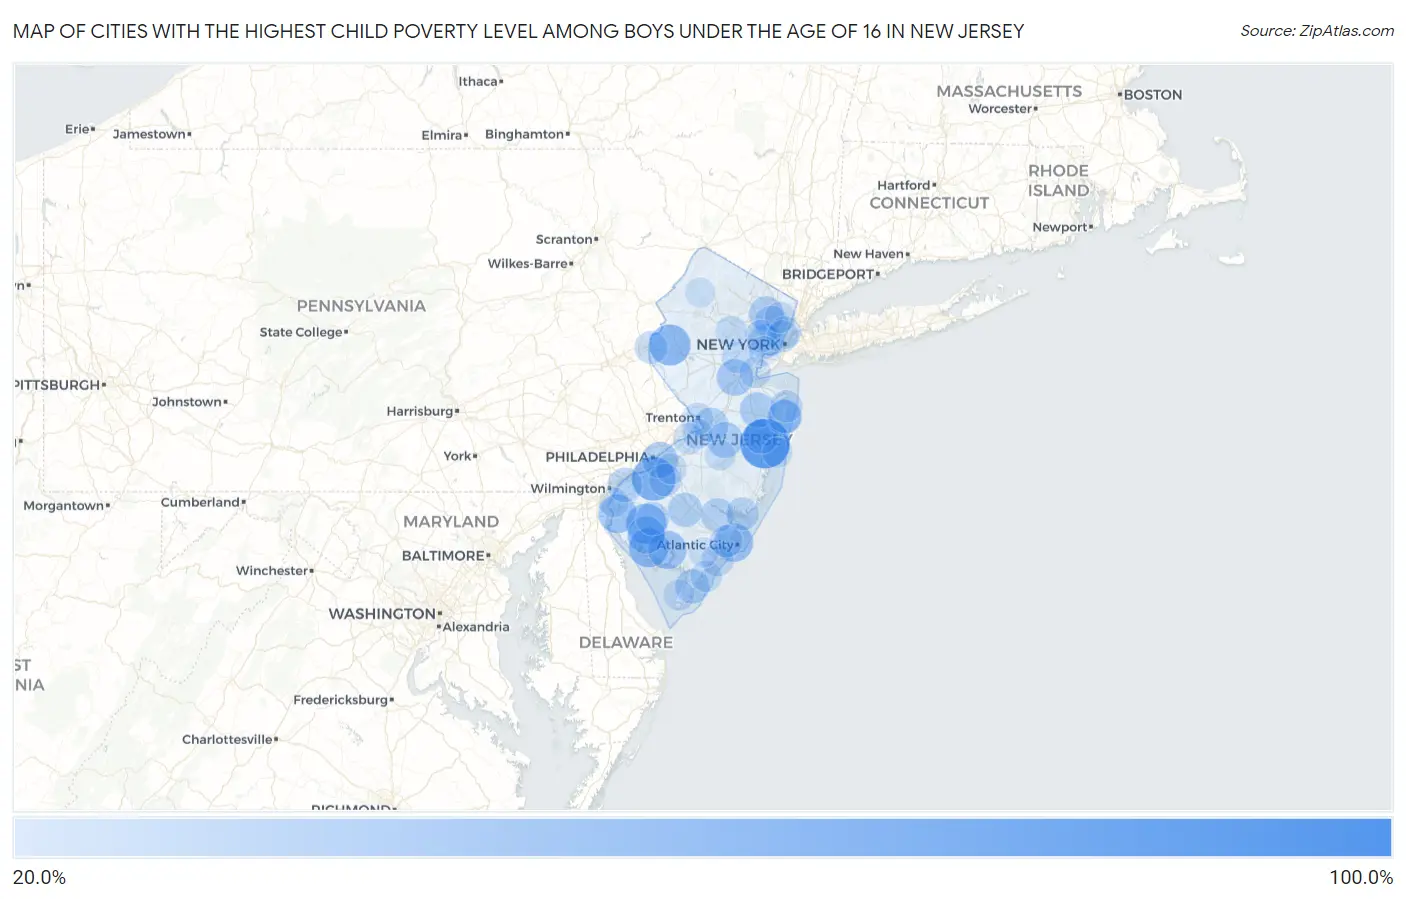
Map of Cities with the Highest Child Poverty Level Among Boys Under the Age of 16 in New Jersey
0.0%
100.0%
Cities with the Highest Child Poverty Level Among Boys Under the Age of 16 in New Jersey
| City | Child Poverty (Boys) | vs State | vs National | |
| 1. | Stone Harbor Borough | 100.0% | 13.4%(+86.6)#1 | 16.9%(+83.1)#84 |
| 2. | Dorchester | 100.0% | 13.4%(+86.6)#2 | 16.9%(+83.1)#394 |
| 3. | Leisure Village | 86.4% | 13.4%(+73.0)#3 | 16.9%(+69.5)#803 |
| 4. | Harrisonville | 85.5% | 13.4%(+72.1)#4 | 16.9%(+68.6)#826 |
| 5. | Silver Lake Cdp Essex County | 72.9% | 13.4%(+59.5)#5 | 16.9%(+56.0)#1,284 |
| 6. | Pluckemin | 72.3% | 13.4%(+58.9)#6 | 16.9%(+55.4)#1,309 |
| 7. | Arrowhead Lake | 71.4% | 13.4%(+58.0)#7 | 16.9%(+54.5)#1,354 |
| 8. | Oak Valley | 66.9% | 13.4%(+53.5)#8 | 16.9%(+50.0)#1,560 |
| 9. | Crosswicks | 65.0% | 13.4%(+51.6)#9 | 16.9%(+48.1)#1,687 |
| 10. | Port Morris | 63.0% | 13.4%(+49.6)#10 | 16.9%(+46.1)#1,807 |
| 11. | Asbury | 57.9% | 13.4%(+44.5)#11 | 16.9%(+41.0)#2,168 |
| 12. | Woodbine Borough | 56.9% | 13.4%(+43.5)#12 | 16.9%(+40.0)#2,244 |
| 13. | Seabrook Farms | 54.9% | 13.4%(+41.5)#13 | 16.9%(+38.0)#2,403 |
| 14. | Seaside Heights Borough | 53.2% | 13.4%(+39.8)#14 | 16.9%(+36.3)#2,570 |
| 15. | Cedarville | 53.0% | 13.4%(+39.6)#15 | 16.9%(+36.1)#2,580 |
| 16. | Neptune City Borough | 51.5% | 13.4%(+38.1)#16 | 16.9%(+34.6)#2,735 |
| 17. | Atlantic City | 50.0% | 13.4%(+36.6)#17 | 16.9%(+33.1)#2,988 |
| 18. | Salem | 49.5% | 13.4%(+36.1)#18 | 16.9%(+32.6)#3,009 |
| 19. | Laurel Lake | 48.3% | 13.4%(+34.9)#19 | 16.9%(+31.4)#3,138 |
| 20. | Bridgeton | 45.9% | 13.4%(+32.5)#20 | 16.9%(+29.0)#3,442 |
| 21. | East Newark Borough | 45.1% | 13.4%(+31.6)#21 | 16.9%(+28.2)#3,555 |
| 22. | Lindenwold Borough | 43.2% | 13.4%(+29.8)#22 | 16.9%(+26.3)#3,813 |
| 23. | New Brunswick | 42.7% | 13.4%(+29.3)#23 | 16.9%(+25.8)#3,911 |
| 24. | Dunellen Borough | 42.2% | 13.4%(+28.8)#24 | 16.9%(+25.3)#3,967 |
| 25. | Camden | 41.0% | 13.4%(+27.6)#25 | 16.9%(+24.1)#4,153 |
| 26. | Wharton Borough | 40.7% | 13.4%(+27.3)#26 | 16.9%(+23.8)#4,201 |
| 27. | New Egypt | 40.0% | 13.4%(+26.6)#27 | 16.9%(+23.1)#4,294 |
| 28. | Hampton Borough | 40.0% | 13.4%(+26.6)#28 | 16.9%(+23.1)#4,297 |
| 29. | Penns Grove Borough | 39.9% | 13.4%(+26.4)#29 | 16.9%(+23.0)#4,359 |
| 30. | East Freehold | 39.0% | 13.4%(+25.6)#30 | 16.9%(+22.1)#4,490 |
| 31. | Paterson | 37.1% | 13.4%(+23.7)#31 | 16.9%(+20.2)#4,844 |
| 32. | Lakewood | 37.0% | 13.4%(+23.6)#32 | 16.9%(+20.1)#4,863 |
| 33. | Newark | 36.5% | 13.4%(+23.1)#33 | 16.9%(+19.6)#4,949 |
| 34. | Carlstadt Borough | 36.4% | 13.4%(+23.0)#34 | 16.9%(+19.5)#4,952 |
| 35. | Pine Hill Borough | 36.4% | 13.4%(+23.0)#35 | 16.9%(+19.5)#4,957 |
| 36. | Victory Gardens Borough | 36.3% | 13.4%(+22.9)#36 | 16.9%(+19.4)#4,996 |
| 37. | Groveville | 36.2% | 13.4%(+22.8)#37 | 16.9%(+19.3)#5,013 |
| 38. | Cape May Court House | 36.2% | 13.4%(+22.8)#38 | 16.9%(+19.3)#5,023 |
| 39. | South River Borough | 36.0% | 13.4%(+22.6)#39 | 16.9%(+19.1)#5,056 |
| 40. | Pedricktown | 35.9% | 13.4%(+22.5)#40 | 16.9%(+19.0)#5,079 |
| 41. | Asbury Park | 35.7% | 13.4%(+22.2)#41 | 16.9%(+18.8)#5,141 |
| 42. | Keansburg Borough | 35.6% | 13.4%(+22.2)#42 | 16.9%(+18.7)#5,144 |
| 43. | Collings Lakes | 35.5% | 13.4%(+22.1)#43 | 16.9%(+18.6)#5,168 |
| 44. | Gouldtown | 34.0% | 13.4%(+20.6)#44 | 16.9%(+17.1)#5,495 |
| 45. | Sunset Lake | 34.0% | 13.4%(+20.5)#45 | 16.9%(+17.1)#5,507 |
| 46. | Longport Borough | 33.3% | 13.4%(+19.9)#46 | 16.9%(+16.4)#5,637 |
| 47. | Wrightstown Borough | 33.3% | 13.4%(+19.9)#47 | 16.9%(+16.4)#5,666 |
| 48. | Loch Arbour | 33.3% | 13.4%(+19.9)#48 | 16.9%(+16.4)#5,702 |
| 49. | Passaic | 33.1% | 13.4%(+19.7)#49 | 16.9%(+16.2)#5,791 |
| 50. | Egg Harbor City | 33.0% | 13.4%(+19.5)#50 | 16.9%(+16.1)#5,807 |
| 51. | Olivet | 32.5% | 13.4%(+19.0)#51 | 16.9%(+15.5)#5,925 |
| 52. | Fairview Borough | 32.2% | 13.4%(+18.7)#52 | 16.9%(+15.3)#6,000 |
| 53. | Vauxhall | 31.4% | 13.4%(+17.9)#53 | 16.9%(+14.5)#6,202 |
| 54. | Stockton Borough | 30.6% | 13.4%(+17.1)#54 | 16.9%(+13.7)#6,422 |
| 55. | Phillipsburg | 30.5% | 13.4%(+17.1)#55 | 16.9%(+13.6)#6,442 |
| 56. | Mystic Island | 30.5% | 13.4%(+17.1)#56 | 16.9%(+13.6)#6,443 |
| 57. | East Orange | 29.5% | 13.4%(+16.0)#57 | 16.9%(+12.6)#6,691 |
| 58. | Ocean City | 29.4% | 13.4%(+16.0)#58 | 16.9%(+12.5)#6,732 |
| 59. | Lake Como Borough | 29.3% | 13.4%(+15.9)#59 | 16.9%(+12.4)#6,747 |
| 60. | Blackwood | 29.3% | 13.4%(+15.8)#60 | 16.9%(+12.4)#6,755 |
| 61. | Pleasantville | 29.0% | 13.4%(+15.6)#61 | 16.9%(+12.1)#6,817 |
| 62. | Lakehurst Borough | 28.6% | 13.4%(+15.2)#62 | 16.9%(+11.7)#6,907 |
| 63. | West New York | 28.5% | 13.4%(+15.1)#63 | 16.9%(+11.6)#6,958 |
| 64. | Long Branch | 28.4% | 13.4%(+15.0)#64 | 16.9%(+11.5)#6,983 |
| 65. | Glassboro Borough | 27.9% | 13.4%(+14.4)#65 | 16.9%(+11.0)#7,141 |
| 66. | Trenton | 27.3% | 13.4%(+13.9)#66 | 16.9%(+10.4)#7,311 |
| 67. | Branchville Borough | 27.3% | 13.4%(+13.9)#67 | 16.9%(+10.4)#7,330 |
| 68. | Woodlynne Borough | 27.2% | 13.4%(+13.8)#68 | 16.9%(+10.3)#7,370 |
| 69. | Merchantville Borough | 27.1% | 13.4%(+13.7)#69 | 16.9%(+10.2)#7,380 |
| 70. | Union City | 27.0% | 13.4%(+13.6)#70 | 16.9%(+10.1)#7,419 |
| 71. | Plainfield | 26.9% | 13.4%(+13.4)#71 | 16.9%(+9.96)#7,466 |
| 72. | Sea Isle City | 26.7% | 13.4%(+13.2)#72 | 16.9%(+9.76)#7,518 |
| 73. | Somerdale Borough | 26.4% | 13.4%(+13.0)#73 | 16.9%(+9.47)#7,629 |
| 74. | Avon By The Sea Borough | 26.3% | 13.4%(+12.9)#74 | 16.9%(+9.41)#7,635 |
| 75. | Dennisville | 26.3% | 13.4%(+12.9)#75 | 16.9%(+9.41)#7,637 |
| 76. | Westville Borough | 25.9% | 13.4%(+12.5)#76 | 16.9%(+8.98)#7,786 |
| 77. | Landing | 25.6% | 13.4%(+12.2)#77 | 16.9%(+8.68)#7,863 |
| 78. | Morristown | 25.5% | 13.4%(+12.1)#78 | 16.9%(+8.64)#7,876 |
| 79. | Burlington | 25.5% | 13.4%(+12.1)#79 | 16.9%(+8.59)#7,898 |
| 80. | Brooklawn Borough | 25.5% | 13.4%(+12.0)#80 | 16.9%(+8.56)#7,913 |
| 81. | Perth Amboy | 25.2% | 13.4%(+11.8)#81 | 16.9%(+8.32)#7,975 |
| 82. | Mount Ephraim Borough | 25.1% | 13.4%(+11.6)#82 | 16.9%(+8.15)#8,016 |
| 83. | Palisades Park Borough | 25.0% | 13.4%(+11.6)#83 | 16.9%(+8.13)#8,019 |
| 84. | Villas | 24.7% | 13.4%(+11.3)#84 | 16.9%(+7.78)#8,212 |
| 85. | Delmont | 24.6% | 13.4%(+11.2)#85 | 16.9%(+7.69)#8,243 |
| 86. | Ashland | 24.4% | 13.4%(+11.0)#86 | 16.9%(+7.52)#8,292 |
| 87. | Bloomingdale Borough | 24.1% | 13.4%(+10.7)#87 | 16.9%(+7.23)#8,380 |
| 88. | Hackensack | 24.1% | 13.4%(+10.7)#88 | 16.9%(+7.23)#8,388 |
| 89. | Browns Mills | 23.7% | 13.4%(+10.2)#89 | 16.9%(+6.76)#8,543 |
| 90. | Sewell | 23.2% | 13.4%(+9.75)#90 | 16.9%(+6.27)#8,711 |
| 91. | Woodland Park Borough | 23.0% | 13.4%(+9.62)#91 | 16.9%(+6.13)#8,772 |
| 92. | Hamburg Borough | 23.0% | 13.4%(+9.58)#92 | 16.9%(+6.10)#8,778 |
| 93. | Dover Beaches North | 22.9% | 13.4%(+9.44)#93 | 16.9%(+5.95)#8,818 |
| 94. | Roebling | 22.7% | 13.4%(+9.32)#94 | 16.9%(+5.84)#8,850 |
| 95. | Elizabeth | 22.0% | 13.4%(+8.57)#95 | 16.9%(+5.09)#9,124 |
| 96. | Newton | 21.9% | 13.4%(+8.45)#96 | 16.9%(+4.97)#9,158 |
| 97. | Manville Borough | 21.8% | 13.4%(+8.37)#97 | 16.9%(+4.88)#9,187 |
| 98. | Corbin City | 21.7% | 13.4%(+8.32)#98 | 16.9%(+4.84)#9,211 |
| 99. | Pennsville | 21.7% | 13.4%(+8.25)#99 | 16.9%(+4.76)#9,238 |
| 100. | Gillette | 21.5% | 13.4%(+8.13)#100 | 16.9%(+4.64)#9,271 |
Common Questions
What are the Top 10 Cities with the Highest Child Poverty Level Among Boys Under the Age of 16 in New Jersey?
Top 10 Cities with the Highest Child Poverty Level Among Boys Under the Age of 16 in New Jersey are:
#1
86.4%
#2
66.9%
#3
57.9%
#4
54.9%
#5
53.0%
#6
50.0%
#7
49.5%
#8
48.3%
#9
45.9%
#10
42.7%
What city has the Highest Child Poverty Level Among Boys Under the Age of 16 in New Jersey?
Leisure Village has the Highest Child Poverty Level Among Boys Under the Age of 16 in New Jersey with 86.4%.
What is the Poverty Level Among Boys Under the Age of 16 in the State of New Jersey?
Poverty Level Among Boys Under the Age of 16 in New Jersey is 13.4%.
What is the Poverty Level Among Boys Under the Age of 16 in the United States?
Poverty Level Among Boys Under the Age of 16 in the United States is 16.9%.