Cities with the Largest Bhutanese Community in New Jersey
RELATED REPORTS & OPTIONS
Bhutanese
New Jersey
Compare Cities
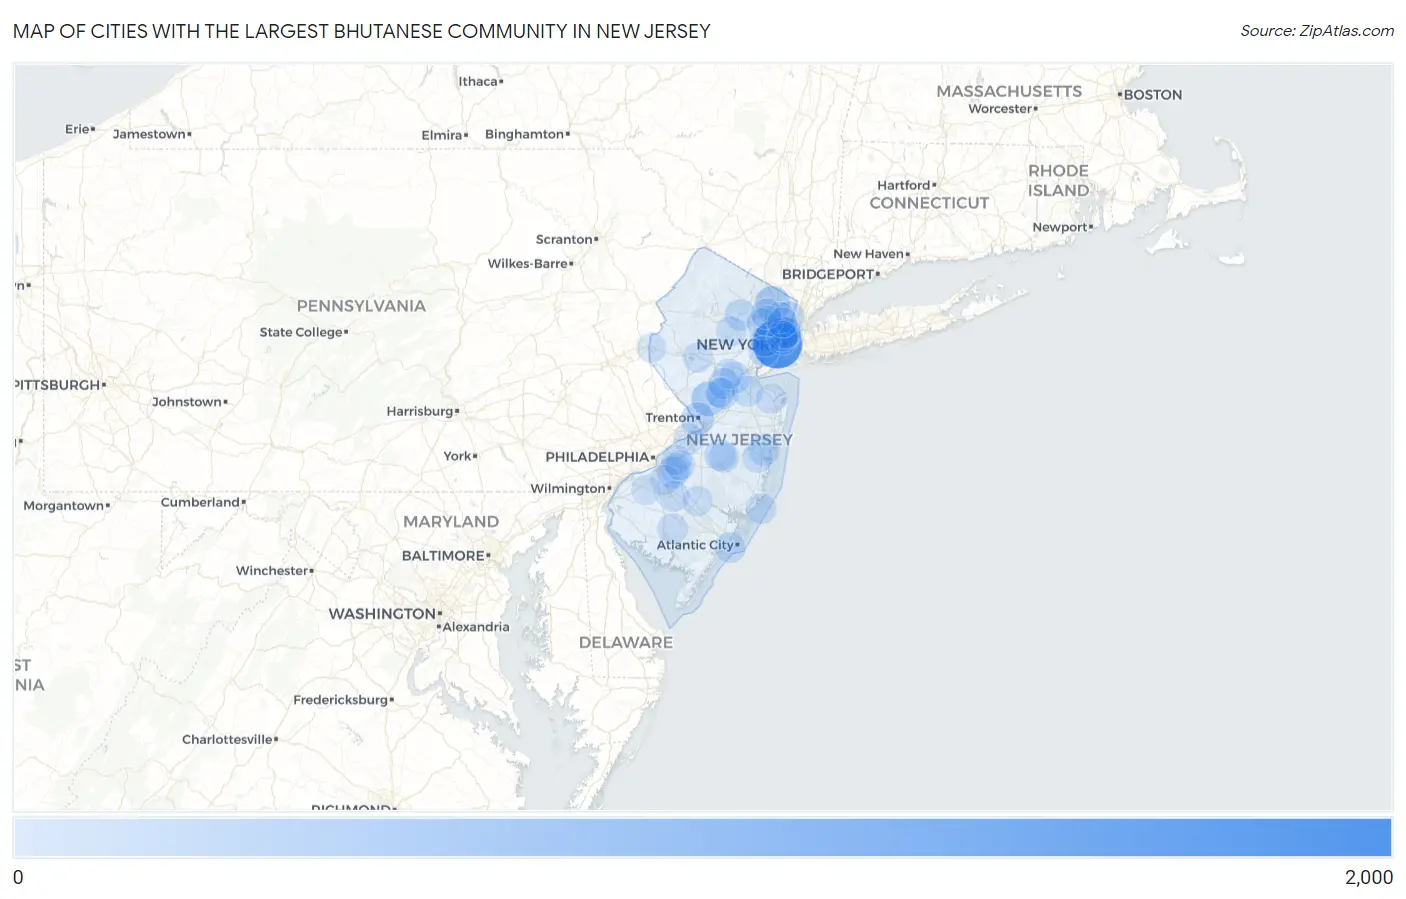
Map of Cities with the Largest Bhutanese Community in New Jersey
0
2,000
Cities with the Largest Bhutanese Community in New Jersey
| City | Bhutanese | vs State | vs National | |
| 1. | Jersey City | 1,639 | 26,496(6.19%)#1 | 1,614,103(0.10%)#136 |
| 2. | Fort Lee Borough | 1,405 | 26,496(5.30%)#2 | 1,614,103(0.09%)#163 |
| 3. | Edgewater Borough | 1,071 | 26,496(4.04%)#3 | 1,614,103(0.07%)#227 |
| 4. | Ridgewood | 453 | 26,496(1.71%)#4 | 1,614,103(0.03%)#523 |
| 5. | Sicklerville | 411 | 26,496(1.55%)#5 | 1,614,103(0.03%)#574 |
| 6. | Princeton | 403 | 26,496(1.52%)#6 | 1,614,103(0.02%)#583 |
| 7. | Glen Rock Borough | 336 | 26,496(1.27%)#7 | 1,614,103(0.02%)#687 |
| 8. | West New York | 290 | 26,496(1.09%)#8 | 1,614,103(0.02%)#758 |
| 9. | Little Ferry Borough | 282 | 26,496(1.06%)#9 | 1,614,103(0.02%)#778 |
| 10. | The Hills | 275 | 26,496(1.04%)#10 | 1,614,103(0.02%)#794 |
| 11. | Trenton | 264 | 26,496(1.00%)#11 | 1,614,103(0.02%)#828 |
| 12. | Ridgefield Borough | 238 | 26,496(0.90%)#12 | 1,614,103(0.01%)#907 |
| 13. | Fair Lawn Borough | 224 | 26,496(0.85%)#13 | 1,614,103(0.01%)#949 |
| 14. | Englewood | 188 | 26,496(0.71%)#14 | 1,614,103(0.01%)#1,074 |
| 15. | Caldwell Borough | 183 | 26,496(0.69%)#15 | 1,614,103(0.01%)#1,110 |
| 16. | Leonia Borough | 181 | 26,496(0.68%)#16 | 1,614,103(0.01%)#1,125 |
| 17. | Cliffside Park Borough | 173 | 26,496(0.65%)#17 | 1,614,103(0.01%)#1,153 |
| 18. | Browns Mills | 173 | 26,496(0.65%)#18 | 1,614,103(0.01%)#1,158 |
| 19. | Berlin Borough | 171 | 26,496(0.65%)#19 | 1,614,103(0.01%)#1,168 |
| 20. | Echelon | 164 | 26,496(0.62%)#20 | 1,614,103(0.01%)#1,215 |
| 21. | Paramus Borough | 160 | 26,496(0.60%)#21 | 1,614,103(0.01%)#1,239 |
| 22. | Hoboken | 158 | 26,496(0.60%)#22 | 1,614,103(0.01%)#1,248 |
| 23. | New Brunswick | 151 | 26,496(0.57%)#23 | 1,614,103(0.01%)#1,293 |
| 24. | Closter Borough | 151 | 26,496(0.57%)#24 | 1,614,103(0.01%)#1,299 |
| 25. | Mckee | 150 | 26,496(0.57%)#25 | 1,614,103(0.01%)#1,309 |
| 26. | Toms River | 148 | 26,496(0.56%)#26 | 1,614,103(0.01%)#1,320 |
| 27. | Boonton | 146 | 26,496(0.55%)#27 | 1,614,103(0.01%)#1,334 |
| 28. | Monmouth Junction | 142 | 26,496(0.54%)#28 | 1,614,103(0.01%)#1,367 |
| 29. | Tenafly Borough | 135 | 26,496(0.51%)#29 | 1,614,103(0.01%)#1,422 |
| 30. | Rutherford Borough | 132 | 26,496(0.50%)#30 | 1,614,103(0.01%)#1,444 |
| 31. | Norwood Borough | 132 | 26,496(0.50%)#31 | 1,614,103(0.01%)#1,449 |
| 32. | Palisades Park Borough | 129 | 26,496(0.49%)#32 | 1,614,103(0.01%)#1,477 |
| 33. | Demarest Borough | 126 | 26,496(0.48%)#33 | 1,614,103(0.01%)#1,503 |
| 34. | Allendale Borough | 124 | 26,496(0.47%)#34 | 1,614,103(0.01%)#1,521 |
| 35. | Franklin Park | 122 | 26,496(0.46%)#35 | 1,614,103(0.01%)#1,531 |
| 36. | Old Bridge | 121 | 26,496(0.46%)#36 | 1,614,103(0.01%)#1,538 |
| 37. | Upper Montclair | 117 | 26,496(0.44%)#37 | 1,614,103(0.01%)#1,586 |
| 38. | Ventnor City | 117 | 26,496(0.44%)#38 | 1,614,103(0.01%)#1,588 |
| 39. | Springdale | 114 | 26,496(0.43%)#39 | 1,614,103(0.01%)#1,616 |
| 40. | River Edge Borough | 109 | 26,496(0.41%)#40 | 1,614,103(0.01%)#1,666 |
| 41. | Hackensack | 106 | 26,496(0.40%)#41 | 1,614,103(0.01%)#1,696 |
| 42. | Guttenberg | 103 | 26,496(0.39%)#42 | 1,614,103(0.01%)#1,730 |
| 43. | Williamstown | 101 | 26,496(0.38%)#43 | 1,614,103(0.01%)#1,744 |
| 44. | Vineland | 98 | 26,496(0.37%)#44 | 1,614,103(0.01%)#1,769 |
| 45. | Ocean Gate Borough | 94 | 26,496(0.35%)#45 | 1,614,103(0.01%)#1,824 |
| 46. | Metuchen Borough | 92 | 26,496(0.35%)#46 | 1,614,103(0.01%)#1,848 |
| 47. | Newark | 90 | 26,496(0.34%)#47 | 1,614,103(0.01%)#1,873 |
| 48. | Holiday City South | 87 | 26,496(0.33%)#48 | 1,614,103(0.01%)#1,930 |
| 49. | Burlington | 86 | 26,496(0.32%)#49 | 1,614,103(0.01%)#1,947 |
| 50. | Elizabeth | 85 | 26,496(0.32%)#50 | 1,614,103(0.01%)#1,952 |
| 51. | Clifton | 85 | 26,496(0.32%)#51 | 1,614,103(0.01%)#1,953 |
| 52. | Saddle River Borough | 84 | 26,496(0.32%)#52 | 1,614,103(0.01%)#1,976 |
| 53. | North Beach Haven | 84 | 26,496(0.32%)#53 | 1,614,103(0.01%)#1,977 |
| 54. | Maywood Borough | 79 | 26,496(0.30%)#54 | 1,614,103(0.00%)#2,056 |
| 55. | Rutgers University-Busch Campus | 79 | 26,496(0.30%)#55 | 1,614,103(0.00%)#2,058 |
| 56. | Country Lake Estates | 78 | 26,496(0.29%)#56 | 1,614,103(0.00%)#2,079 |
| 57. | Union City | 77 | 26,496(0.29%)#57 | 1,614,103(0.00%)#2,083 |
| 58. | Madison Borough | 76 | 26,496(0.29%)#58 | 1,614,103(0.00%)#2,110 |
| 59. | Lyons | 75 | 26,496(0.28%)#59 | 1,614,103(0.00%)#2,138 |
| 60. | Bloomingdale Borough | 74 | 26,496(0.28%)#60 | 1,614,103(0.00%)#2,153 |
| 61. | Collingswood Borough | 71 | 26,496(0.27%)#61 | 1,614,103(0.00%)#2,201 |
| 62. | Montvale Borough | 71 | 26,496(0.27%)#62 | 1,614,103(0.00%)#2,204 |
| 63. | Spotswood Borough | 71 | 26,496(0.27%)#63 | 1,614,103(0.00%)#2,206 |
| 64. | South Toms River Borough | 71 | 26,496(0.27%)#64 | 1,614,103(0.00%)#2,210 |
| 65. | Midland Park Borough | 70 | 26,496(0.26%)#65 | 1,614,103(0.00%)#2,220 |
| 66. | Lincroft | 69 | 26,496(0.26%)#66 | 1,614,103(0.00%)#2,238 |
| 67. | Matawan Borough | 68 | 26,496(0.26%)#67 | 1,614,103(0.00%)#2,251 |
| 68. | Morristown | 67 | 26,496(0.25%)#68 | 1,614,103(0.00%)#2,263 |
| 69. | White House Station | 67 | 26,496(0.25%)#69 | 1,614,103(0.00%)#2,273 |
| 70. | Paterson | 65 | 26,496(0.25%)#70 | 1,614,103(0.00%)#2,299 |
| 71. | Oradell Borough | 63 | 26,496(0.24%)#71 | 1,614,103(0.00%)#2,357 |
| 72. | Glen Ridge Borough | 62 | 26,496(0.23%)#72 | 1,614,103(0.00%)#2,381 |
| 73. | Englewood Cliffs Borough | 60 | 26,496(0.23%)#73 | 1,614,103(0.00%)#2,428 |
| 74. | Franklin Lakes Borough | 59 | 26,496(0.22%)#74 | 1,614,103(0.00%)#2,448 |
| 75. | Hawthorne Borough | 57 | 26,496(0.22%)#75 | 1,614,103(0.00%)#2,487 |
| 76. | Ridgefield Park | 57 | 26,496(0.22%)#76 | 1,614,103(0.00%)#2,494 |
| 77. | Blackwood | 57 | 26,496(0.22%)#77 | 1,614,103(0.00%)#2,500 |
| 78. | Old Tappan Borough | 56 | 26,496(0.21%)#78 | 1,614,103(0.00%)#2,526 |
| 79. | Ringwood Borough | 54 | 26,496(0.20%)#79 | 1,614,103(0.00%)#2,573 |
| 80. | Preakness | 52 | 26,496(0.20%)#80 | 1,614,103(0.00%)#2,621 |
| 81. | New Milford Borough | 52 | 26,496(0.20%)#81 | 1,614,103(0.00%)#2,623 |
| 82. | Springfield | 52 | 26,496(0.20%)#82 | 1,614,103(0.00%)#2,644 |
| 83. | Somerset | 50 | 26,496(0.19%)#83 | 1,614,103(0.00%)#2,680 |
| 84. | Newtonville | 50 | 26,496(0.19%)#84 | 1,614,103(0.00%)#2,704 |
| 85. | Parsippany | 49 | 26,496(0.18%)#85 | 1,614,103(0.00%)#2,714 |
| 86. | Ramblewood | 48 | 26,496(0.18%)#86 | 1,614,103(0.00%)#2,758 |
| 87. | Laurel Heights | 48 | 26,496(0.18%)#87 | 1,614,103(0.00%)#2,767 |
| 88. | Phillipsburg | 47 | 26,496(0.18%)#88 | 1,614,103(0.00%)#2,783 |
| 89. | Marlton | 47 | 26,496(0.18%)#89 | 1,614,103(0.00%)#2,790 |
| 90. | Hillsdale Borough | 47 | 26,496(0.18%)#90 | 1,614,103(0.00%)#2,791 |
| 91. | Cresskill Borough | 45 | 26,496(0.17%)#91 | 1,614,103(0.00%)#2,856 |
| 92. | Haworth Borough | 45 | 26,496(0.17%)#92 | 1,614,103(0.00%)#2,867 |
| 93. | Pennington Borough | 44 | 26,496(0.17%)#93 | 1,614,103(0.00%)#2,911 |
| 94. | Hammonton | 43 | 26,496(0.16%)#94 | 1,614,103(0.00%)#2,932 |
| 95. | Mountainside Borough | 43 | 26,496(0.16%)#95 | 1,614,103(0.00%)#2,943 |
| 96. | Bergenfield Borough | 42 | 26,496(0.16%)#96 | 1,614,103(0.00%)#2,957 |
| 97. | Heathcote | 42 | 26,496(0.16%)#97 | 1,614,103(0.00%)#2,981 |
| 98. | Point Pleasant Borough | 41 | 26,496(0.15%)#98 | 1,614,103(0.00%)#3,005 |
| 99. | Mullica Hill | 41 | 26,496(0.15%)#99 | 1,614,103(0.00%)#3,032 |
| 100. | Eatontown Borough | 40 | 26,496(0.15%)#100 | 1,614,103(0.00%)#3,065 |
Common Questions
What are the Top 10 Cities with the Largest Bhutanese Community in New Jersey?
Top 10 Cities with the Largest Bhutanese Community in New Jersey are:
#1
1,639
#2
453
#3
403
#4
290
#5
264
#6
188
#7
173
#8
164
#9
158
#10
151
What city has the Largest Bhutanese Community in New Jersey?
Jersey City has the Largest Bhutanese Community in New Jersey with 1,639.
What is the Total Bhutanese Population in the State of New Jersey?
Total Bhutanese Population in New Jersey is 26,496.
What is the Total Bhutanese Population in the United States?
Total Bhutanese Population in the United States is 1,614,103.