Rossmoor, NJ Map & Demographics
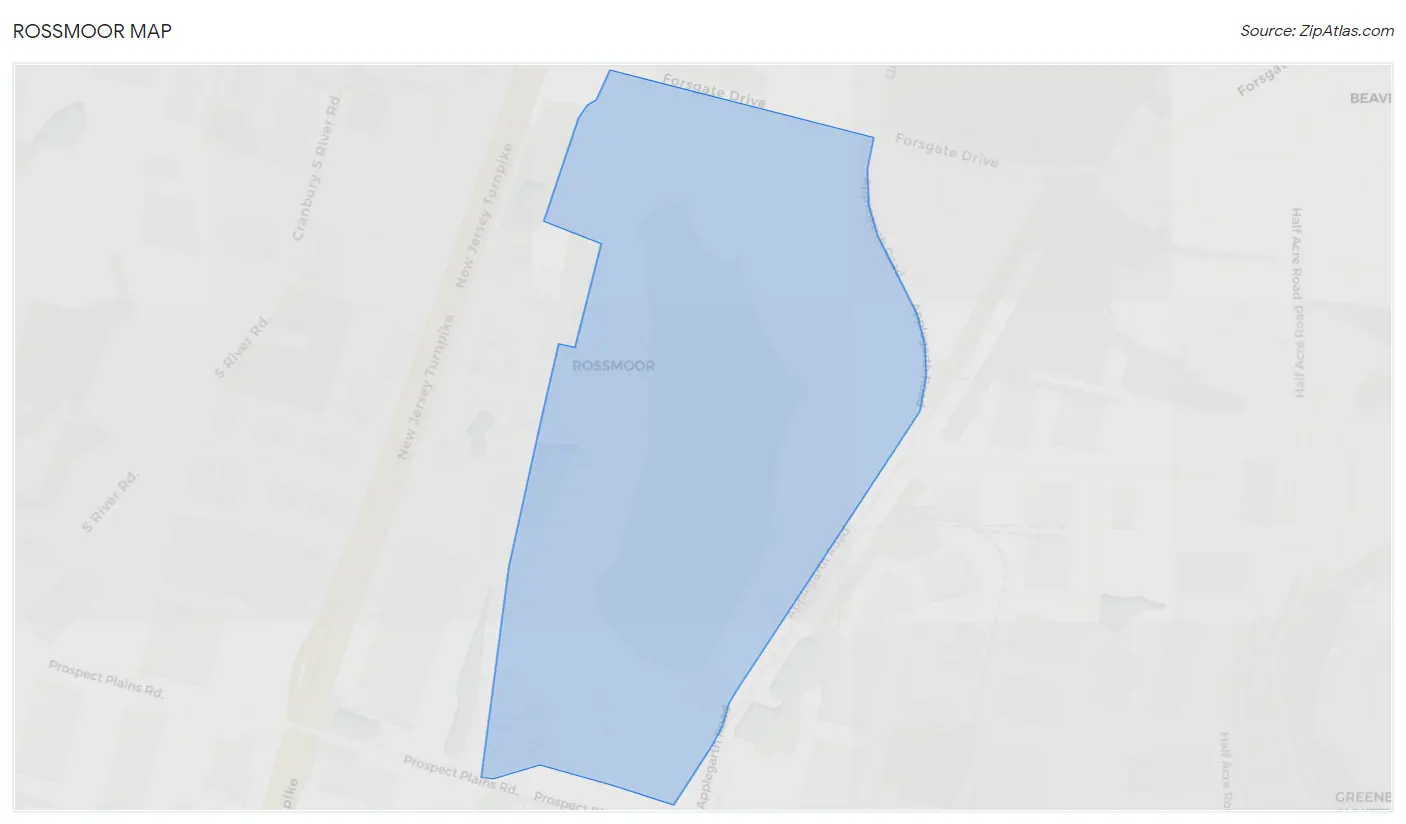
Rossmoor Map
Rossmoor Overview
$47,865
PER CAPITA INCOME
$75,330
AVG FAMILY INCOME
$46,917
AVG HOUSEHOLD INCOME
0.40
INEQUALITY / GINI INDEX
2,772
TOTAL POPULATION
897
MALE POPULATION
1,875
FEMALE POPULATION
47.84
MALES / 100 FEMALES
209.03
FEMALES / 100 MALES
74.5
MEDIAN AGE
2.0
AVG FAMILY SIZE
1.3
AVG HOUSEHOLD SIZE
629
LABOR FORCE [ PEOPLE ]
22.7%
PERCENT IN LABOR FORCE
9.9%
UNEMPLOYMENT RATE
Income in Rossmoor
Income Overview in Rossmoor
Per Capita Income in Rossmoor is $47,865, while median incomes of families and households are $75,330 and $46,917 respectively.
| Characteristic | Number | Measure |
| Per Capita Income | 2,772 | $47,865 |
| Median Family Income | 529 | $75,330 |
| Mean Family Income | 529 | $90,564 |
| Median Household Income | 2,137 | $46,917 |
| Mean Household Income | 2,137 | $62,188 |
| Income Deficit | 529 | $0 |
| Wage / Income Gap (%) | 2,772 | 0.00% |
| Wage / Income Gap ($) | 2,772 | 100.00¢ per $1 |
| Gini / Inequality Index | 2,772 | 0.40 |
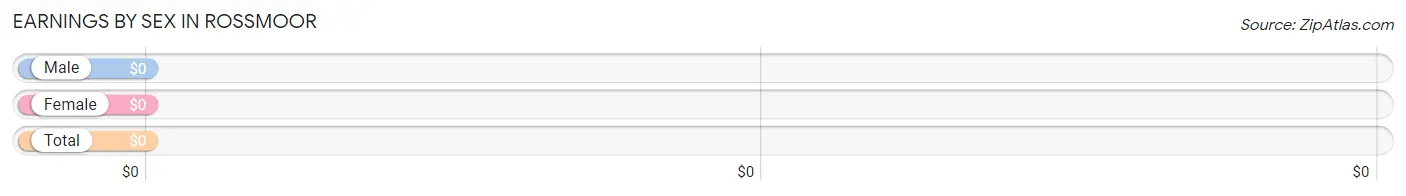
Earnings by Sex in Rossmoor
| Sex | Number | Average Earnings |
| Male | 282 (42.7%) | $0 |
| Female | 379 (57.3%) | $0 |
| Total | 661 (100.0%) | $0 |
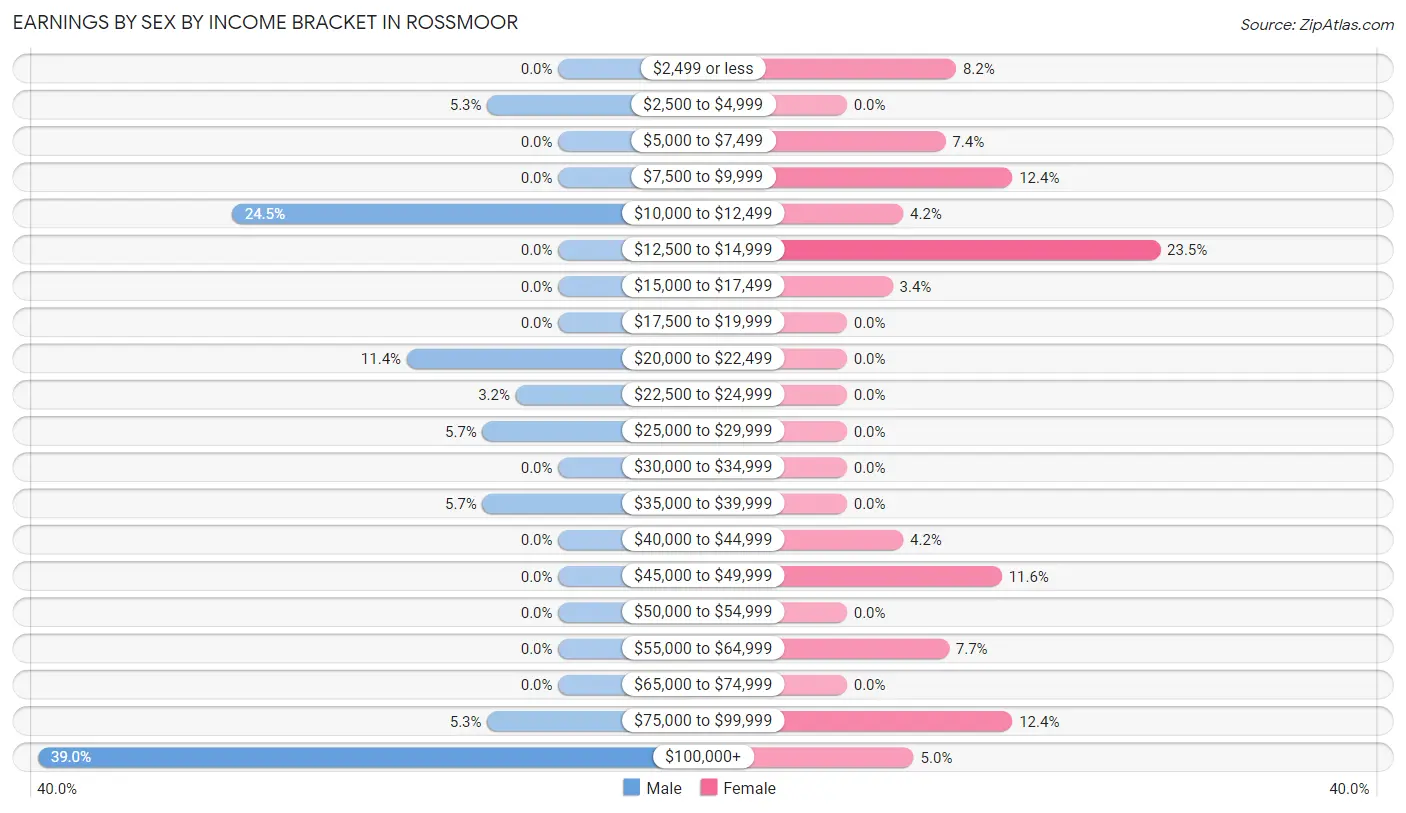
Earnings by Sex by Income Bracket in Rossmoor
The most common earnings brackets in Rossmoor are $100,000+ for men (110 | 39.0%) and $12,500 to $14,999 for women (89 | 23.5%).
| Income | Male | Female |
| $2,499 or less | 0 (0.0%) | 31 (8.2%) |
| $2,500 to $4,999 | 15 (5.3%) | 0 (0.0%) |
| $5,000 to $7,499 | 0 (0.0%) | 28 (7.4%) |
| $7,500 to $9,999 | 0 (0.0%) | 47 (12.4%) |
| $10,000 to $12,499 | 69 (24.5%) | 16 (4.2%) |
| $12,500 to $14,999 | 0 (0.0%) | 89 (23.5%) |
| $15,000 to $17,499 | 0 (0.0%) | 13 (3.4%) |
| $17,500 to $19,999 | 0 (0.0%) | 0 (0.0%) |
| $20,000 to $22,499 | 32 (11.4%) | 0 (0.0%) |
| $22,500 to $24,999 | 9 (3.2%) | 0 (0.0%) |
| $25,000 to $29,999 | 16 (5.7%) | 0 (0.0%) |
| $30,000 to $34,999 | 0 (0.0%) | 0 (0.0%) |
| $35,000 to $39,999 | 16 (5.7%) | 0 (0.0%) |
| $40,000 to $44,999 | 0 (0.0%) | 16 (4.2%) |
| $45,000 to $49,999 | 0 (0.0%) | 44 (11.6%) |
| $50,000 to $54,999 | 0 (0.0%) | 0 (0.0%) |
| $55,000 to $64,999 | 0 (0.0%) | 29 (7.6%) |
| $65,000 to $74,999 | 0 (0.0%) | 0 (0.0%) |
| $75,000 to $99,999 | 15 (5.3%) | 47 (12.4%) |
| $100,000+ | 110 (39.0%) | 19 (5.0%) |
| Total | 282 (100.0%) | 379 (100.0%) |
Earnings by Sex by Educational Attainment in Rossmoor
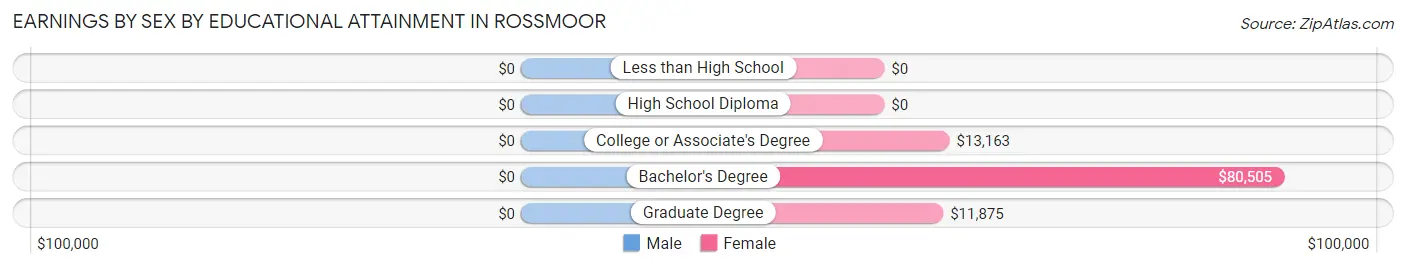
| Educational Attainment | Male Income | Female Income |
| Less than High School | - | - |
| High School Diploma | - | - |
| College or Associate's Degree | - | - |
| Bachelor's Degree | - | - |
| Graduate Degree | - | - |
| Total | - | - |
Family Income in Rossmoor
Family Income Brackets in Rossmoor
According to the Rossmoor family income data, there are 145 families falling into the $75,000 to $99,999 income range, which is the most common income bracket and makes up 27.4% of all families.
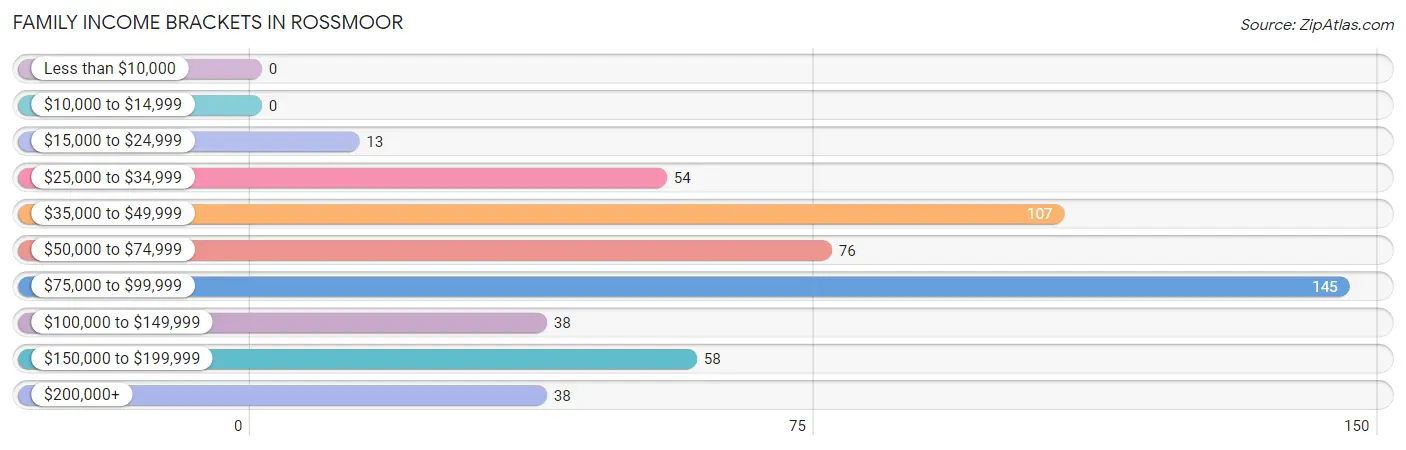
| Income Bracket | # Families | % Families |
| Less than $10,000 | 0 | 0.0% |
| $10,000 to $14,999 | 0 | 0.0% |
| $15,000 to $24,999 | 13 | 2.5% |
| $25,000 to $34,999 | 54 | 10.2% |
| $35,000 to $49,999 | 107 | 20.2% |
| $50,000 to $74,999 | 76 | 14.4% |
| $75,000 to $99,999 | 145 | 27.4% |
| $100,000 to $149,999 | 38 | 7.2% |
| $150,000 to $199,999 | 58 | 11.0% |
| $200,000+ | 38 | 7.2% |
Family Income by Famaliy Size in Rossmoor
2-person families (517 | 97.7%) account for the highest median family income in Rossmoor with $75,193 per family, while 2-person families (517 | 97.7%) have the highest median income of $37,596 per family member.
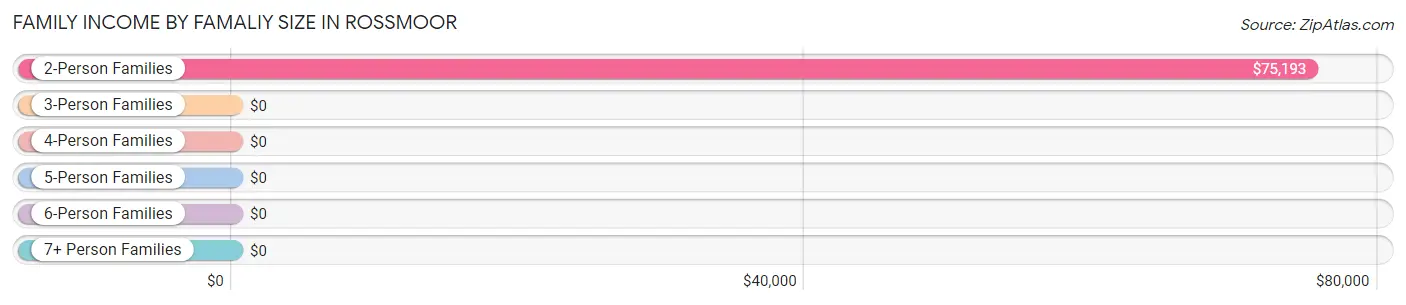
| Income Bracket | # Families | Median Income |
| 2-Person Families | 517 (97.7%) | $75,193 |
| 3-Person Families | 12 (2.3%) | $0 |
| 4-Person Families | 0 (0.0%) | $0 |
| 5-Person Families | 0 (0.0%) | $0 |
| 6-Person Families | 0 (0.0%) | $0 |
| 7+ Person Families | 0 (0.0%) | $0 |
| Total | 529 (100.0%) | $75,330 |
Family Income by Number of Earners in Rossmoor
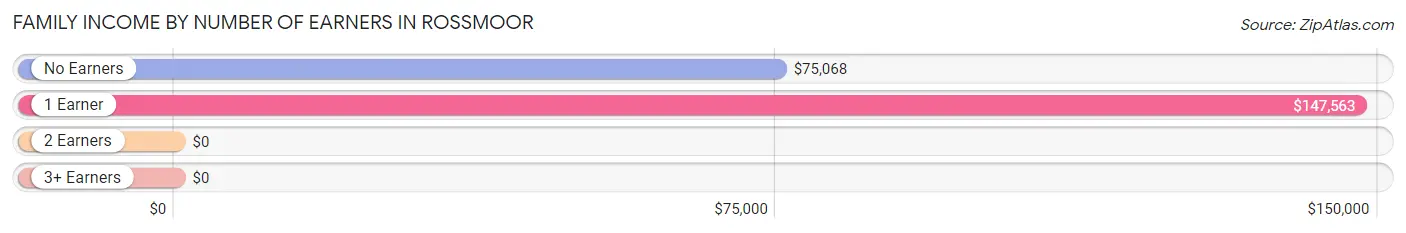
| Number of Earners | # Families | Median Income |
| No Earners | 364 (68.8%) | $75,068 |
| 1 Earner | 151 (28.5%) | $147,563 |
| 2 Earners | 14 (2.6%) | $0 |
| 3+ Earners | 0 (0.0%) | $0 |
| Total | 529 (100.0%) | $75,330 |
Household Income in Rossmoor
Household Income Brackets in Rossmoor
With 545 households falling in the category, the $35,000 to $49,999 income range is the most frequent in Rossmoor, accounting for 25.5% of all households. In contrast, only 62 households (2.9%) fall into the less than $10,000 income bracket, making it the least populous group.
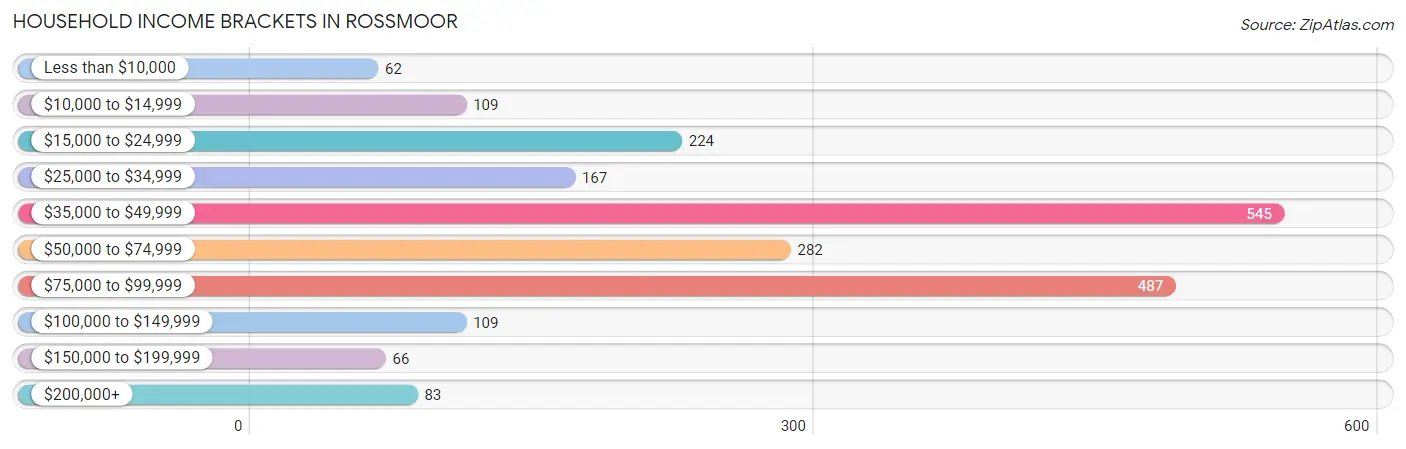
| Income Bracket | # Households | % Households |
| Less than $10,000 | 62 | 2.9% |
| $10,000 to $14,999 | 109 | 5.1% |
| $15,000 to $24,999 | 224 | 10.5% |
| $25,000 to $34,999 | 167 | 7.8% |
| $35,000 to $49,999 | 545 | 25.5% |
| $50,000 to $74,999 | 282 | 13.2% |
| $75,000 to $99,999 | 487 | 22.8% |
| $100,000 to $149,999 | 109 | 5.1% |
| $150,000 to $199,999 | 66 | 3.1% |
| $200,000+ | 83 | 3.9% |
Household Income by Householder Age in Rossmoor
The median household income in Rossmoor is $46,917, with the highest median household income of $80,991 found in the 45 to 64 years age bracket for the primary householder. A total of 276 households (12.9%) fall into this category.
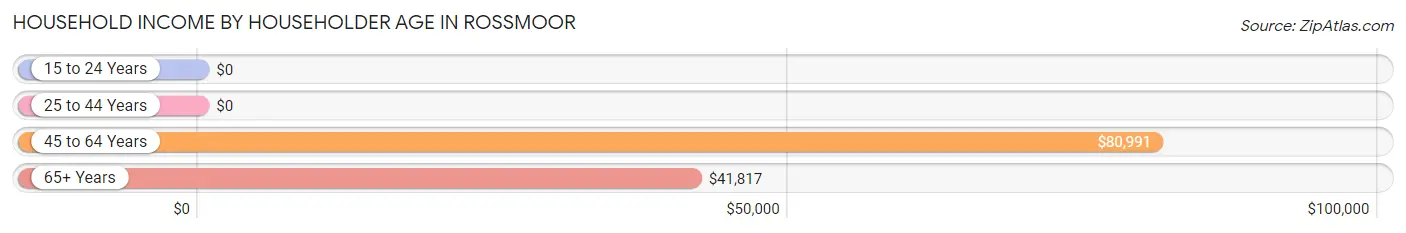
| Income Bracket | # Households | Median Income |
| 15 to 24 Years | 0 (0.0%) | $0 |
| 25 to 44 Years | 0 (0.0%) | $0 |
| 45 to 64 Years | 276 (12.9%) | $80,991 |
| 65+ Years | 1,861 (87.1%) | $41,817 |
| Total | 2,137 (100.0%) | $46,917 |
Poverty in Rossmoor
Income Below Poverty by Sex and Age in Rossmoor
With 5.0% poverty level for males and 9.3% for females among the residents of Rossmoor, 55 to 64 year old males and 75 year old and over females are the most vulnerable to poverty, with 17 males (14.5%) and 163 females (15.9%) in their respective age groups living below the poverty level.
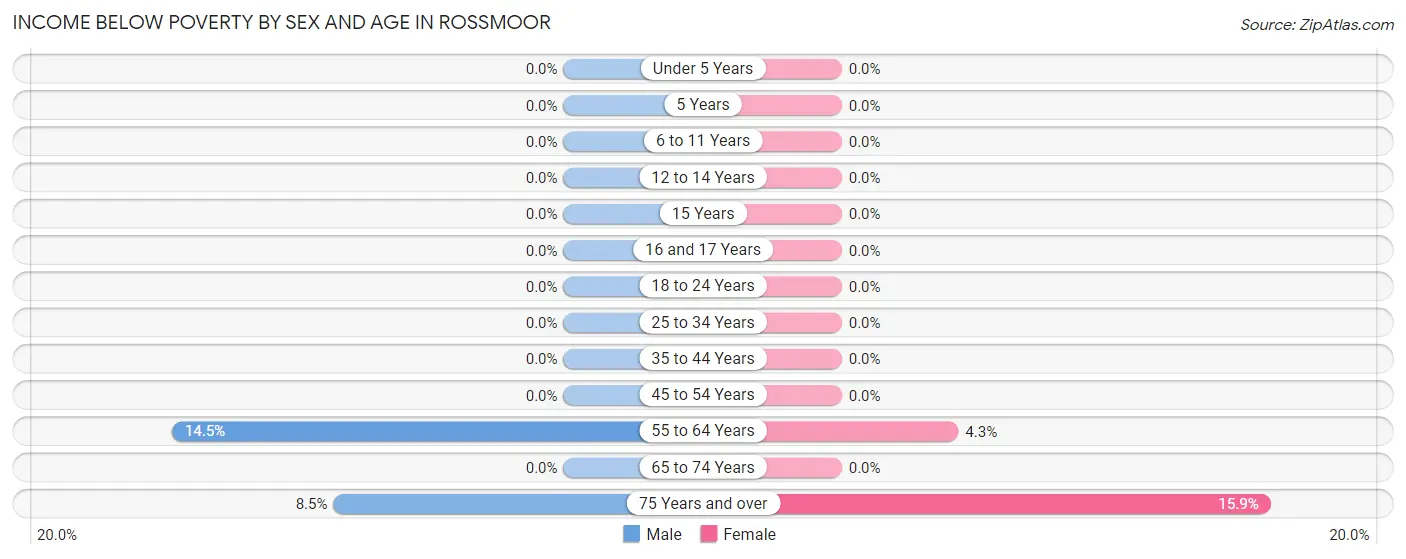
| Age Bracket | Male | Female |
| Under 5 Years | 0 (0.0%) | 0 (0.0%) |
| 5 Years | 0 (0.0%) | 0 (0.0%) |
| 6 to 11 Years | 0 (0.0%) | 0 (0.0%) |
| 12 to 14 Years | 0 (0.0%) | 0 (0.0%) |
| 15 Years | 0 (0.0%) | 0 (0.0%) |
| 16 and 17 Years | 0 (0.0%) | 0 (0.0%) |
| 18 to 24 Years | 0 (0.0%) | 0 (0.0%) |
| 25 to 34 Years | 0 (0.0%) | 0 (0.0%) |
| 35 to 44 Years | 0 (0.0%) | 0 (0.0%) |
| 45 to 54 Years | 0 (0.0%) | 0 (0.0%) |
| 55 to 64 Years | 17 (14.5%) | 12 (4.3%) |
| 65 to 74 Years | 0 (0.0%) | 0 (0.0%) |
| 75 Years and over | 28 (8.5%) | 163 (15.9%) |
| Total | 45 (5.0%) | 175 (9.3%) |
Income Above Poverty by Sex and Age in Rossmoor
According to the poverty statistics in Rossmoor, males aged 25 to 34 years and females aged 25 to 34 years are the age groups that are most secure financially, with 100.0% of males and 100.0% of females in these age groups living above the poverty line.
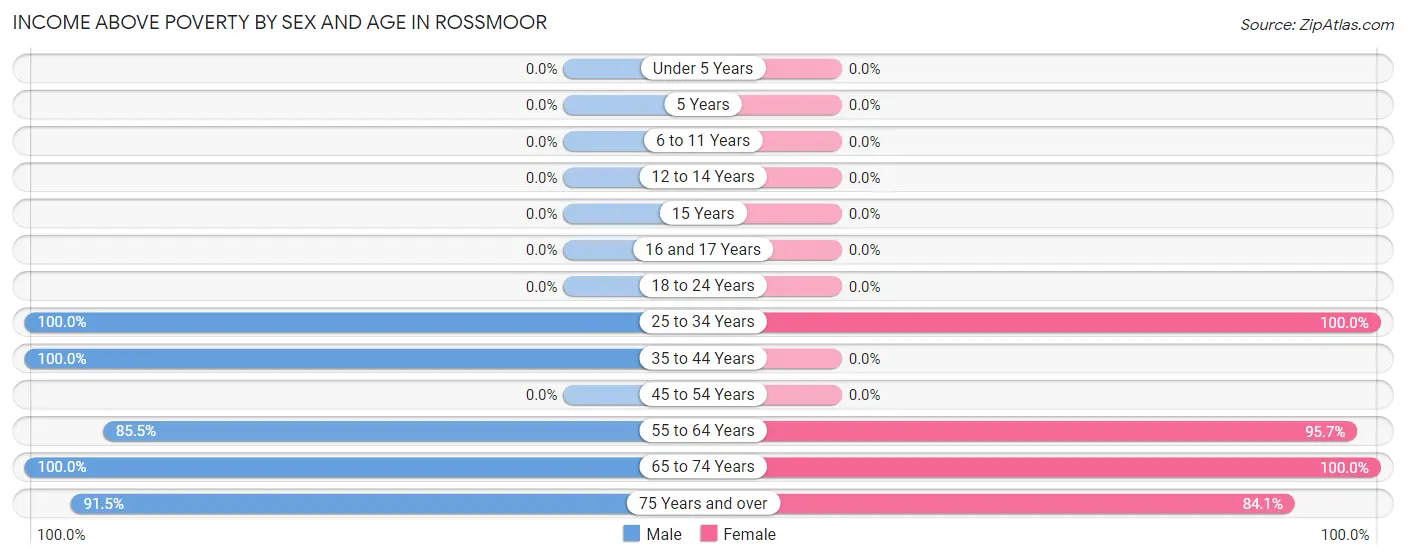
| Age Bracket | Male | Female |
| Under 5 Years | 0 (0.0%) | 0 (0.0%) |
| 5 Years | 0 (0.0%) | 0 (0.0%) |
| 6 to 11 Years | 0 (0.0%) | 0 (0.0%) |
| 12 to 14 Years | 0 (0.0%) | 0 (0.0%) |
| 15 Years | 0 (0.0%) | 0 (0.0%) |
| 16 and 17 Years | 0 (0.0%) | 0 (0.0%) |
| 18 to 24 Years | 0 (0.0%) | 0 (0.0%) |
| 25 to 34 Years | 17 (100.0%) | 15 (100.0%) |
| 35 to 44 Years | 21 (100.0%) | 0 (0.0%) |
| 45 to 54 Years | 0 (0.0%) | 0 (0.0%) |
| 55 to 64 Years | 100 (85.5%) | 265 (95.7%) |
| 65 to 74 Years | 414 (100.0%) | 559 (100.0%) |
| 75 Years and over | 300 (91.5%) | 861 (84.1%) |
| Total | 852 (95.0%) | 1,700 (90.7%) |
Income Below Poverty Among Married-Couple Families in Rossmoor
The poverty statistics for married-couple families in Rossmoor show that 2.7% or 13 of the total 475 families live below the poverty line. Families with no children have the highest poverty rate of 2.7%, comprising of 13 families. On the other hand, families with no children have the lowest poverty rate of 2.7%, which includes 13 families.
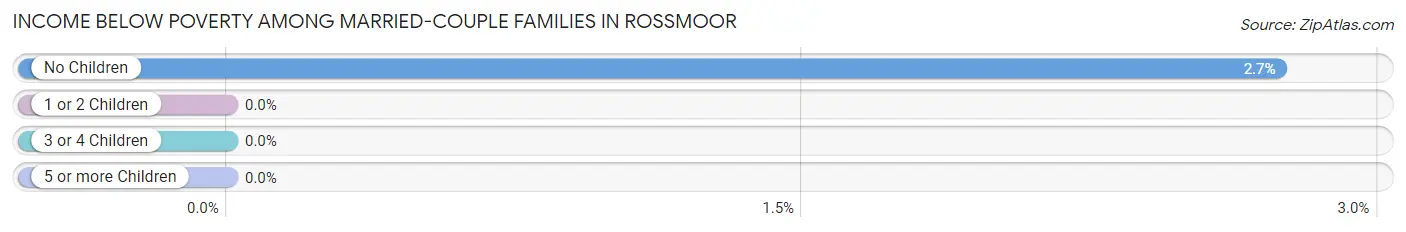
| Children | Above Poverty | Below Poverty |
| No Children | 462 (97.3%) | 13 (2.7%) |
| 1 or 2 Children | 0 (0.0%) | 0 (0.0%) |
| 3 or 4 Children | 0 (0.0%) | 0 (0.0%) |
| 5 or more Children | 0 (0.0%) | 0 (0.0%) |
| Total | 462 (97.3%) | 13 (2.7%) |
Income Below Poverty Among Single-Parent Households in Rossmoor
| Children | Single Father | Single Mother |
| No Children | 0 (0.0%) | 0 (0.0%) |
| 1 or 2 Children | 0 (0.0%) | 0 (0.0%) |
| 3 or 4 Children | 0 (0.0%) | 0 (0.0%) |
| 5 or more Children | 0 (0.0%) | 0 (0.0%) |
| Total | 0 (0.0%) | 0 (0.0%) |
Income Below Poverty Among Married-Couple vs Single-Parent Households in Rossmoor
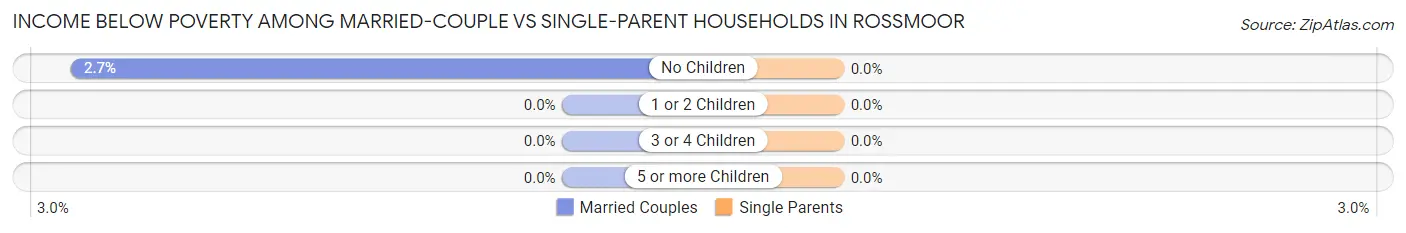
| Children | Married-Couple Families | Single-Parent Households |
| No Children | 13 (2.7%) | 0 (0.0%) |
| 1 or 2 Children | 0 (0.0%) | 0 (0.0%) |
| 3 or 4 Children | 0 (0.0%) | 0 (0.0%) |
| 5 or more Children | 0 (0.0%) | 0 (0.0%) |
| Total | 13 (2.7%) | 0 (0.0%) |
Race in Rossmoor
The most populous races in Rossmoor are White / Caucasian (2,433 | 87.8%), Asian (204 | 7.4%), and Black / African American (71 | 2.6%).
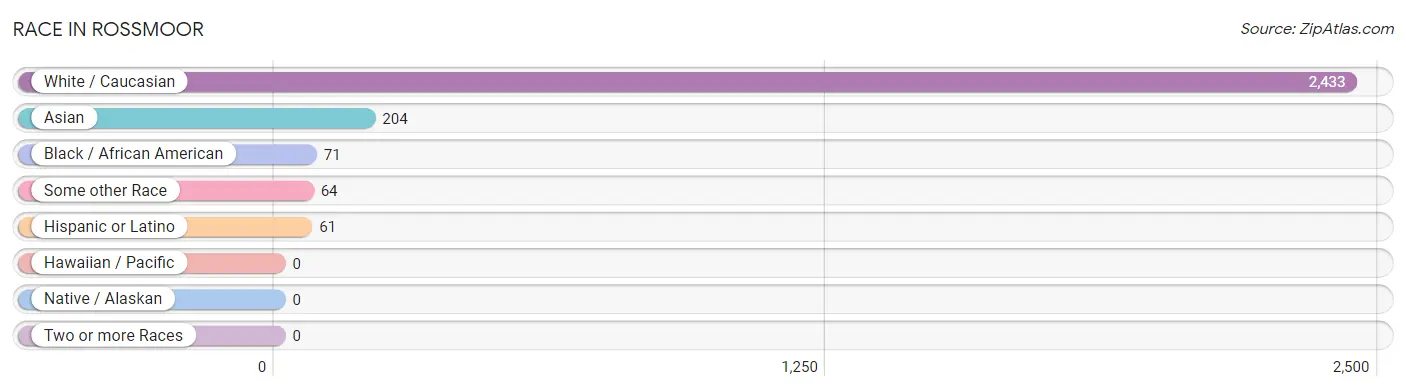
| Race | # Population | % Population |
| Asian | 204 | 7.4% |
| Black / African American | 71 | 2.6% |
| Hawaiian / Pacific | 0 | 0.0% |
| Hispanic or Latino | 61 | 2.2% |
| Native / Alaskan | 0 | 0.0% |
| White / Caucasian | 2,433 | 87.8% |
| Two or more Races | 0 | 0.0% |
| Some other Race | 64 | 2.3% |
| Total | 2,772 | 100.0% |
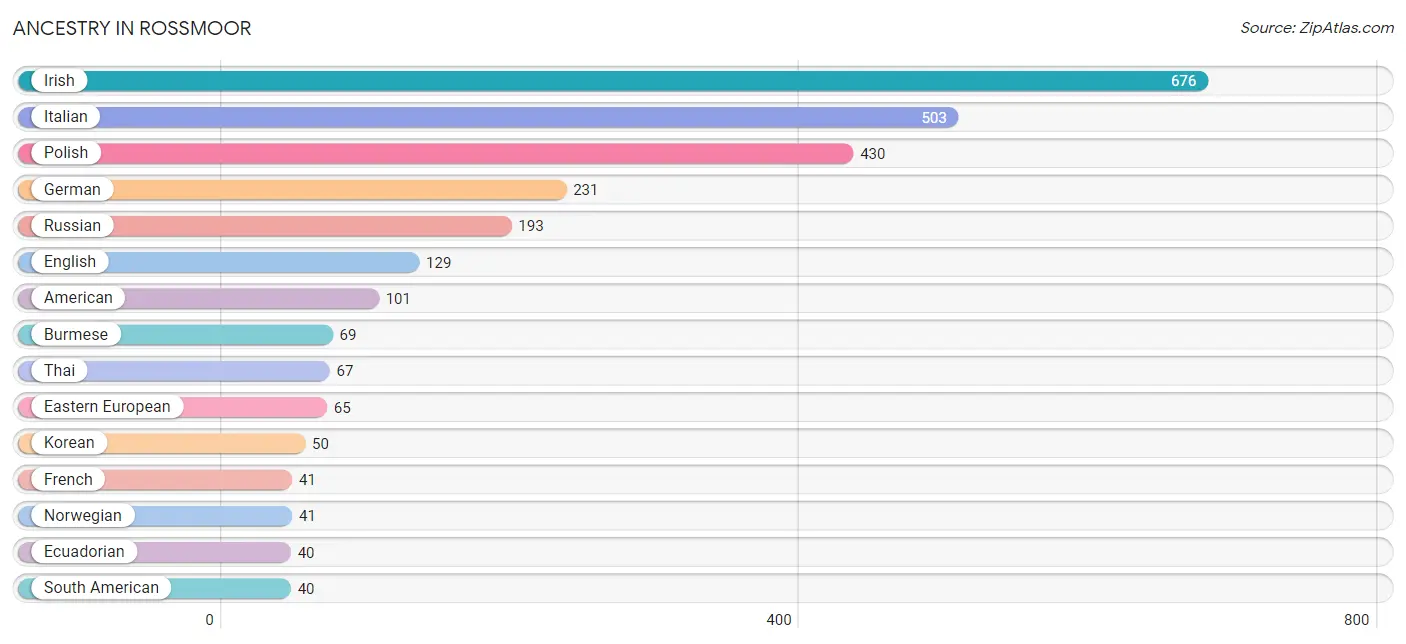
Ancestry in Rossmoor
The most populous ancestries reported in Rossmoor are Irish (676 | 24.4%), Italian (503 | 18.1%), Polish (430 | 15.5%), German (231 | 8.3%), and Russian (193 | 7.0%), together accounting for 73.3% of all Rossmoor residents.
| Ancestry | # Population | % Population |
| American | 101 | 3.6% |
| Arab | 16 | 0.6% |
| Austrian | 16 | 0.6% |
| Bhutanese | 1 | 0.0% |
| British | 16 | 0.6% |
| Burmese | 69 | 2.5% |
| Czechoslovakian | 31 | 1.1% |
| Danish | 17 | 0.6% |
| Dutch | 17 | 0.6% |
| Eastern European | 65 | 2.3% |
| Ecuadorian | 40 | 1.4% |
| English | 129 | 4.6% |
| European | 8 | 0.3% |
| Finnish | 15 | 0.5% |
| French | 41 | 1.5% |
| French Canadian | 11 | 0.4% |
| German | 231 | 8.3% |
| Greek | 18 | 0.6% |
| Hungarian | 31 | 1.1% |
| Indian (Asian) | 17 | 0.6% |
| Irish | 676 | 24.4% |
| Italian | 503 | 18.1% |
| Korean | 50 | 1.8% |
| Lebanese | 16 | 0.6% |
| Norwegian | 41 | 1.5% |
| Polish | 430 | 15.5% |
| Portuguese | 23 | 0.8% |
| Russian | 193 | 7.0% |
| Scotch-Irish | 27 | 1.0% |
| Scottish | 15 | 0.5% |
| Slovak | 31 | 1.1% |
| South American | 40 | 1.4% |
| Spaniard | 21 | 0.8% |
| Swedish | 11 | 0.4% |
| Thai | 67 | 2.4% |
| Trinidadian and Tobagonian | 17 | 0.6% |
| Welsh | 17 | 0.6% | View All 37 Rows |
Immigrants in Rossmoor
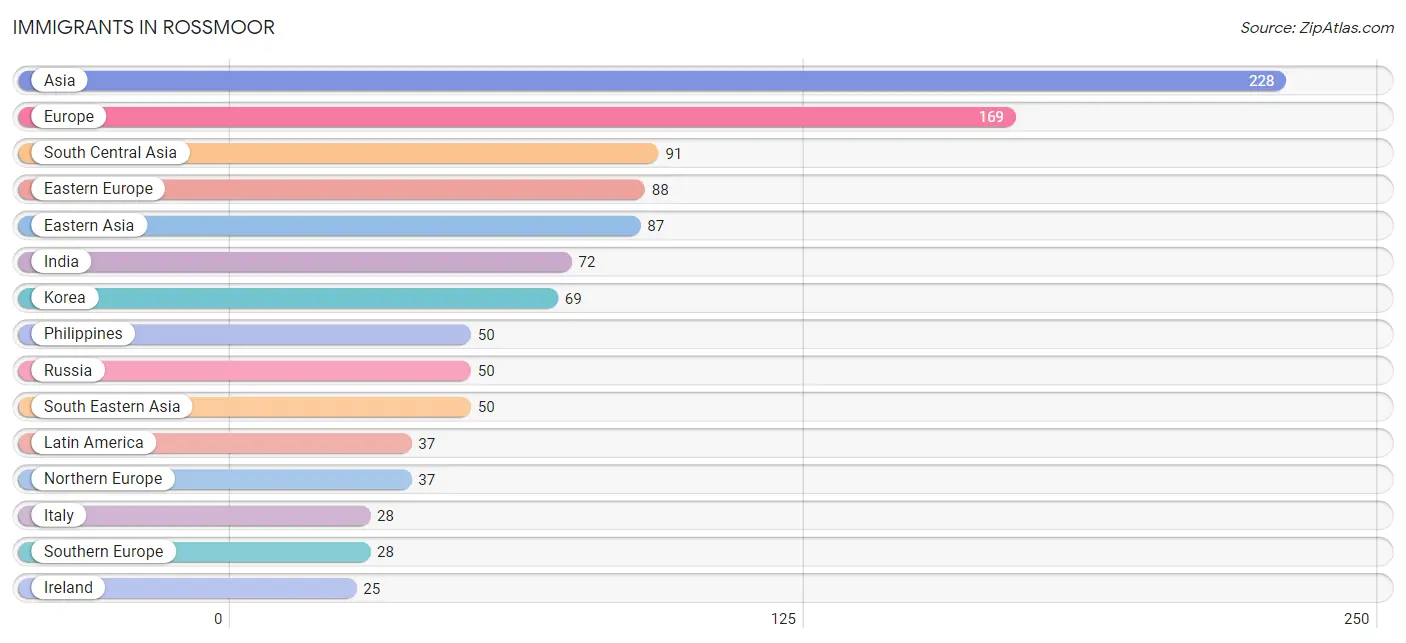
The most numerous immigrant groups reported in Rossmoor came from Asia (228 | 8.2%), Europe (169 | 6.1%), South Central Asia (91 | 3.3%), Eastern Europe (88 | 3.2%), and Eastern Asia (87 | 3.1%), together accounting for 23.9% of all Rossmoor residents.
| Immigration Origin | # Population | % Population |
| Asia | 228 | 8.2% |
| Austria | 16 | 0.6% |
| Canada | 15 | 0.5% |
| Caribbean | 17 | 0.6% |
| China | 17 | 0.6% |
| Eastern Asia | 87 | 3.1% |
| Eastern Europe | 88 | 3.2% |
| Ecuador | 20 | 0.7% |
| Europe | 169 | 6.1% |
| India | 72 | 2.6% |
| Ireland | 25 | 0.9% |
| Italy | 28 | 1.0% |
| Japan | 1 | 0.0% |
| Korea | 69 | 2.5% |
| Latin America | 37 | 1.3% |
| Northern Europe | 37 | 1.3% |
| Pakistan | 19 | 0.7% |
| Philippines | 50 | 1.8% |
| Poland | 17 | 0.6% |
| Russia | 50 | 1.8% |
| South America | 20 | 0.7% |
| South Central Asia | 91 | 3.3% |
| South Eastern Asia | 50 | 1.8% |
| Southern Europe | 28 | 1.0% |
| Trinidad and Tobago | 17 | 0.6% |
| Ukraine | 21 | 0.8% |
| Western Europe | 16 | 0.6% | View All 27 Rows |
Sex and Age in Rossmoor
Sex and Age in Rossmoor
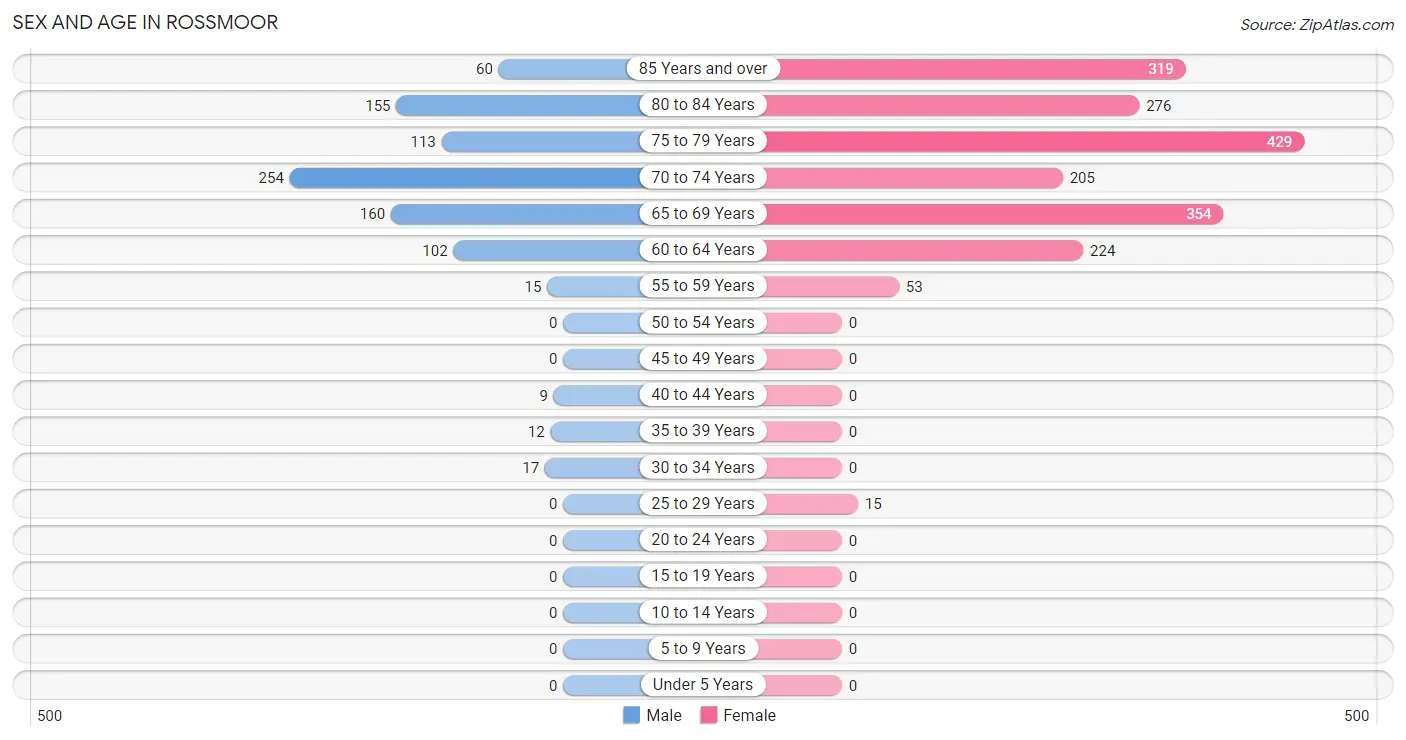
The most populous age groups in Rossmoor are 70 to 74 Years (254 | 28.3%) for men and 75 to 79 Years (429 | 22.9%) for women.
| Age Bracket | Male | Female |
| Under 5 Years | 0 (0.0%) | 0 (0.0%) |
| 5 to 9 Years | 0 (0.0%) | 0 (0.0%) |
| 10 to 14 Years | 0 (0.0%) | 0 (0.0%) |
| 15 to 19 Years | 0 (0.0%) | 0 (0.0%) |
| 20 to 24 Years | 0 (0.0%) | 0 (0.0%) |
| 25 to 29 Years | 0 (0.0%) | 15 (0.8%) |
| 30 to 34 Years | 17 (1.9%) | 0 (0.0%) |
| 35 to 39 Years | 12 (1.3%) | 0 (0.0%) |
| 40 to 44 Years | 9 (1.0%) | 0 (0.0%) |
| 45 to 49 Years | 0 (0.0%) | 0 (0.0%) |
| 50 to 54 Years | 0 (0.0%) | 0 (0.0%) |
| 55 to 59 Years | 15 (1.7%) | 53 (2.8%) |
| 60 to 64 Years | 102 (11.4%) | 224 (11.9%) |
| 65 to 69 Years | 160 (17.8%) | 354 (18.9%) |
| 70 to 74 Years | 254 (28.3%) | 205 (10.9%) |
| 75 to 79 Years | 113 (12.6%) | 429 (22.9%) |
| 80 to 84 Years | 155 (17.3%) | 276 (14.7%) |
| 85 Years and over | 60 (6.7%) | 319 (17.0%) |
| Total | 897 (100.0%) | 1,875 (100.0%) |
Families and Households in Rossmoor
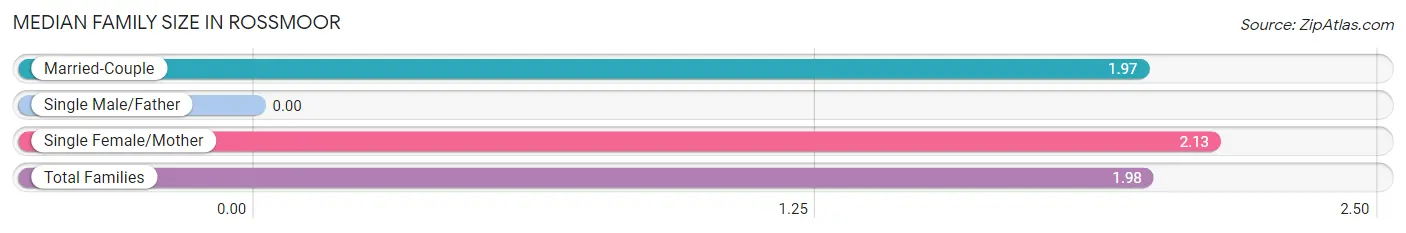
Median Family Size in Rossmoor
| Family Type | # Families | Family Size |
| Married-Couple | 475 (89.8%) | 1.97 |
| Single Male/Father | 0 (0.0%) | - |
| Single Female/Mother | 54 (10.2%) | 2.13 |
| Total Families | 529 (100.0%) | 1.98 |
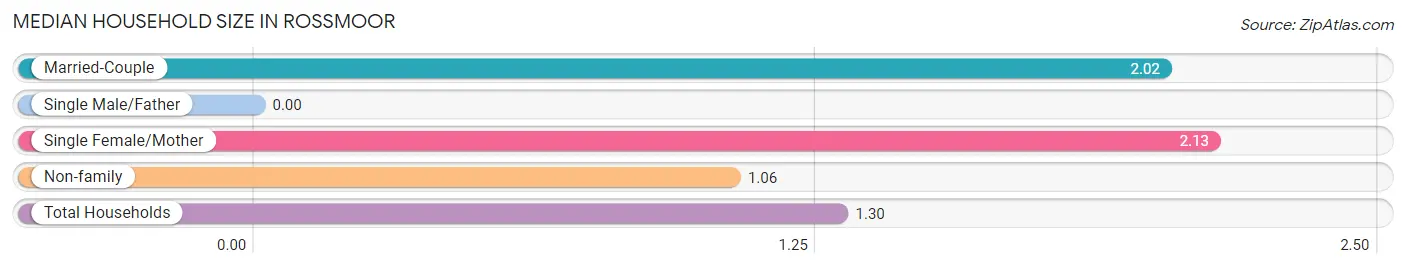
Median Household Size in Rossmoor
| Household Type | # Households | Household Size |
| Married-Couple | 475 (22.2%) | 2.02 |
| Single Male/Father | 0 (0.0%) | - |
| Single Female/Mother | 54 (2.5%) | 2.13 |
| Non-family | 1,608 (75.2%) | 1.06 |
| Total Households | 2,137 (100.0%) | 1.30 |
Household Size by Marriage Status in Rossmoor
Out of a total of 2,137 households in Rossmoor, 529 (24.7%) are family households, while 1,608 (75.2%) are nonfamily households. The most numerous type of family households are 2-person households, comprising 498, and the most common type of nonfamily households are 1-person households, comprising 1,521.
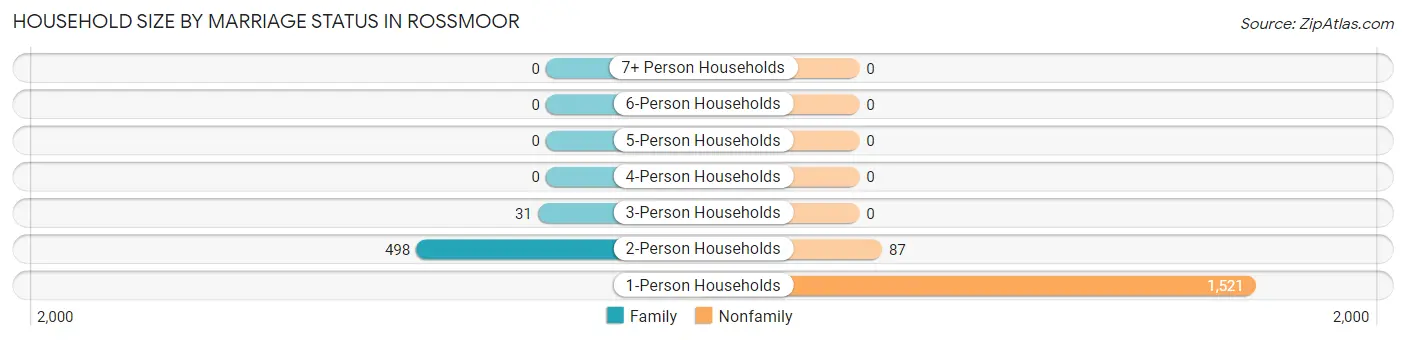
| Household Size | Family Households | Nonfamily Households |
| 1-Person Households | - | 1,521 (71.2%) |
| 2-Person Households | 498 (23.3%) | 87 (4.1%) |
| 3-Person Households | 31 (1.5%) | 0 (0.0%) |
| 4-Person Households | 0 (0.0%) | 0 (0.0%) |
| 5-Person Households | 0 (0.0%) | 0 (0.0%) |
| 6-Person Households | 0 (0.0%) | 0 (0.0%) |
| 7+ Person Households | 0 (0.0%) | 0 (0.0%) |
| Total | 529 (24.7%) | 1,608 (75.2%) |
Female Fertility in Rossmoor
Fertility by Age in Rossmoor
| Age Bracket | Women with Births | Births / 1,000 Women |
| 15 to 19 years | 0 (0.0%) | 0.0 |
| 20 to 34 years | 0 (0.0%) | 0.0 |
| 35 to 50 years | 0 (0.0%) | 0.0 |
| Total | 0 (0.0%) | 0.0 |
Fertility by Age by Marriage Status in Rossmoor
| Age Bracket | Married | Unmarried |
| 15 to 19 years | 0 (0.0%) | 0 (0.0%) |
| 20 to 34 years | 0 (0.0%) | 0 (0.0%) |
| 35 to 50 years | 0 (0.0%) | 0 (0.0%) |
| Total | 0 (0.0%) | 0 (0.0%) |
Fertility by Education in Rossmoor
| Educational Attainment | Women with Births | Births / 1,000 Women |
| Less than High School | 0 (0.0%) | 0.0 |
| High School Diploma | 0 (0.0%) | 0.0 |
| College or Associate's Degree | 0 (0.0%) | 0.0 |
| Bachelor's Degree | 0 (0.0%) | 0.0 |
| Graduate Degree | 0 (0.0%) | 0.0 |
| Total | 0 (0.0%) | 0.0 |
Fertility by Education by Marriage Status in Rossmoor
| Educational Attainment | Married | Unmarried |
| Less than High School | 0 (0.0%) | 0 (0.0%) |
| High School Diploma | 0 (0.0%) | 0 (0.0%) |
| College or Associate's Degree | 0 (0.0%) | 0 (0.0%) |
| Bachelor's Degree | 0 (0.0%) | 0 (0.0%) |
| Graduate Degree | 0 (0.0%) | 0 (0.0%) |
| Total | 0 (0.0%) | 0 (0.0%) |
Employment Characteristics in Rossmoor
Employment by Class of Employer in Rossmoor
Among the 541 employed individuals in Rossmoor, private company employees (413 | 76.3%), not-for-profit organizations (67 | 12.4%), and local government employees (45 | 8.3%) make up the most common classes of employment.
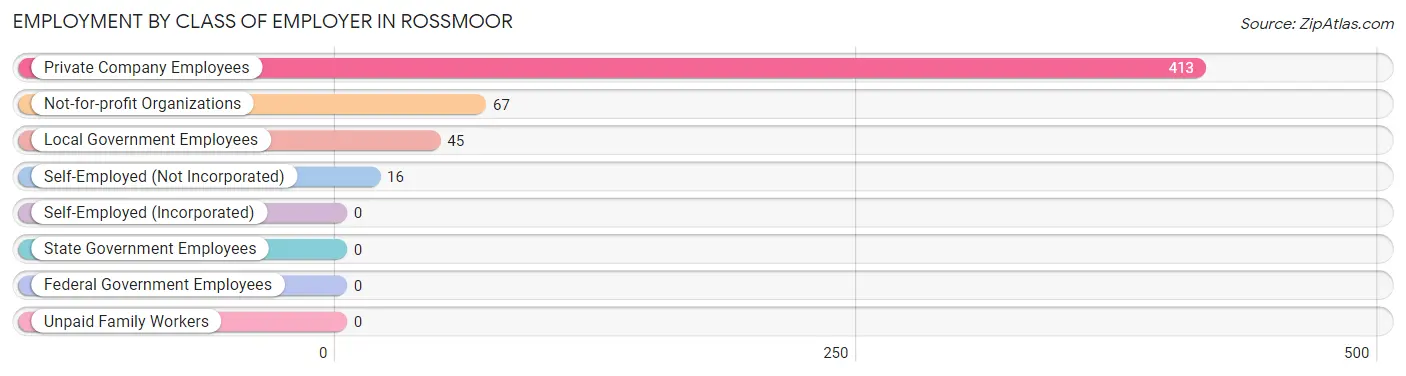
| Employer Class | # Employees | % Employees |
| Private Company Employees | 413 | 76.3% |
| Self-Employed (Incorporated) | 0 | 0.0% |
| Self-Employed (Not Incorporated) | 16 | 3.0% |
| Not-for-profit Organizations | 67 | 12.4% |
| Local Government Employees | 45 | 8.3% |
| State Government Employees | 0 | 0.0% |
| Federal Government Employees | 0 | 0.0% |
| Unpaid Family Workers | 0 | 0.0% |
| Total | 541 | 100.0% |
Employment Status by Age in Rossmoor
According to the labor force statistics for Rossmoor, out of the total population over 16 years of age (2,772), 22.7% or 629 individuals are in the labor force, with 9.9% or 62 of them unemployed. The age group with the highest labor force participation rate is 25 to 29 years, with 100.0% or 15 individuals in the labor force. Within the labor force, the 25 to 29 years age range has the highest percentage of unemployed individuals, with 100.0% or 15 of them being unemployed.
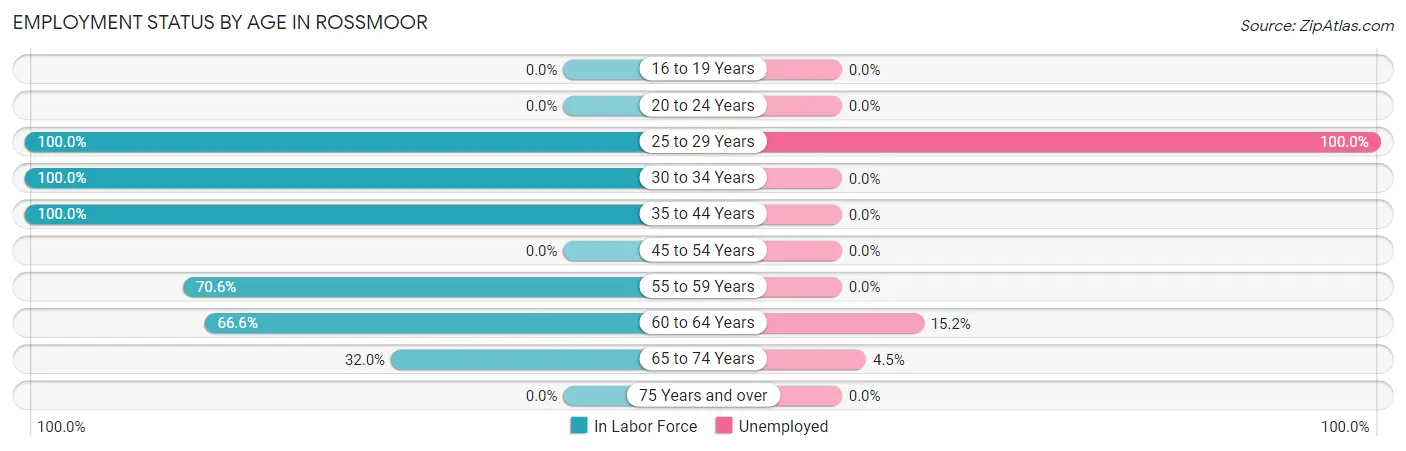
| Age Bracket | In Labor Force | Unemployed |
| 16 to 19 Years | 0 (0.0%) | 0 (0.0%) |
| 20 to 24 Years | 0 (0.0%) | 0 (0.0%) |
| 25 to 29 Years | 15 (100.0%) | 15 (100.0%) |
| 30 to 34 Years | 17 (100.0%) | 0 (0.0%) |
| 35 to 44 Years | 21 (100.0%) | 0 (0.0%) |
| 45 to 54 Years | 0 (0.0%) | 0 (0.0%) |
| 55 to 59 Years | 48 (70.6%) | 0 (0.0%) |
| 60 to 64 Years | 217 (66.6%) | 33 (15.2%) |
| 65 to 74 Years | 311 (32.0%) | 14 (4.5%) |
| 75 Years and over | 0 (0.0%) | 0 (0.0%) |
| Total | 629 (22.7%) | 62 (9.9%) |
Employment Status by Educational Attainment in Rossmoor
According to labor force statistics for Rossmoor, 71.1% of individuals (318) out of the total population between 25 and 64 years of age (447) are in the labor force, with 15.1% or 48 of them being unemployed. The group with the highest labor force participation rate are those with the educational attainment of bachelor's degree or higher, with 90.2% or 148 individuals in the labor force. Within the labor force, individuals with bachelor's degree or higher education have the highest percentage of unemployment, with 22.3% or 33 of them being unemployed.
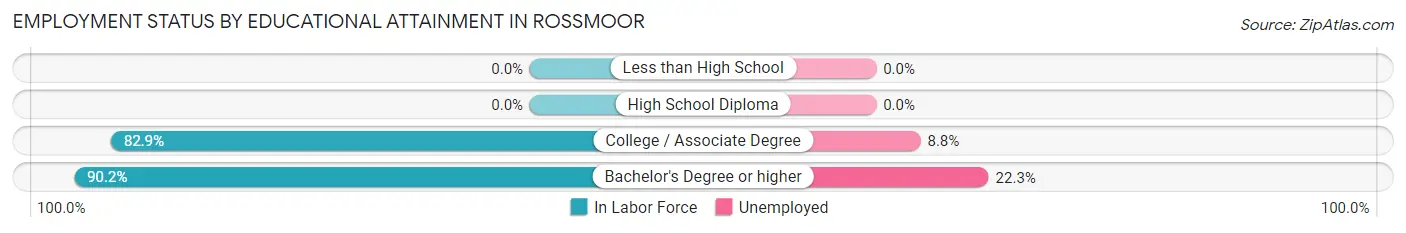
| Educational Attainment | In Labor Force | Unemployed |
| Less than High School | 0 (0.0%) | 0 (0.0%) |
| High School Diploma | 0 (0.0%) | 0 (0.0%) |
| College / Associate Degree | 170 (82.9%) | 18 (8.8%) |
| Bachelor's Degree or higher | 148 (90.2%) | 37 (22.3%) |
| Total | 318 (71.1%) | 67 (15.1%) |
Employment Occupations by Sex in Rossmoor
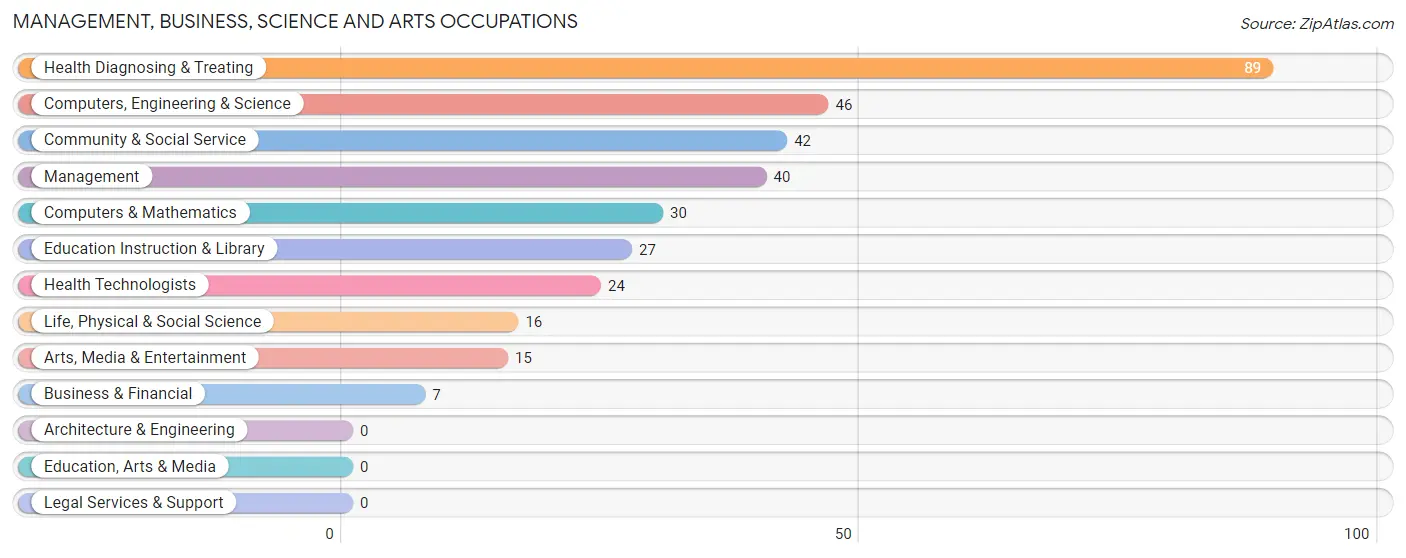
Management, Business, Science and Arts Occupations
The most common Management, Business, Science and Arts occupations in Rossmoor are Health Diagnosing & Treating (89 | 15.7%), Computers, Engineering & Science (46 | 8.1%), Community & Social Service (42 | 7.4%), Management (40 | 7.0%), and Computers & Mathematics (30 | 5.3%).
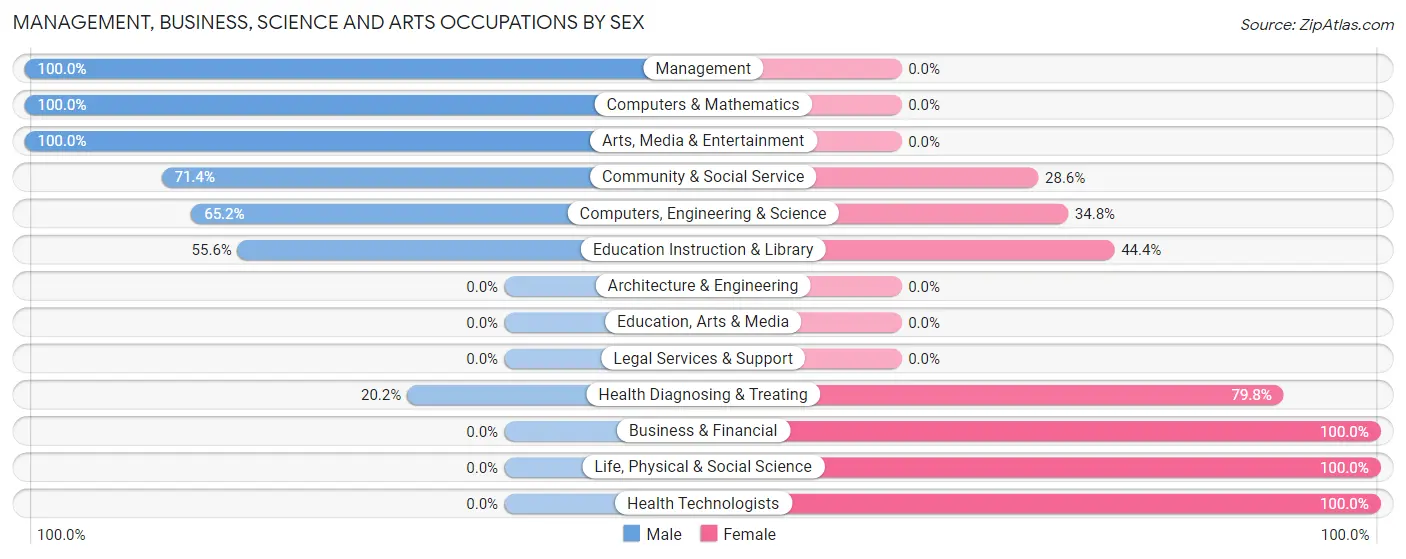
Management, Business, Science and Arts Occupations by Sex
Within the Management, Business, Science and Arts occupations in Rossmoor, the most male-oriented occupations are Management (100.0%), Computers & Mathematics (100.0%), and Arts, Media & Entertainment (100.0%), while the most female-oriented occupations are Business & Financial (100.0%), Life, Physical & Social Science (100.0%), and Health Technologists (100.0%).
| Occupation | Male | Female |
| Management | 40 (100.0%) | 0 (0.0%) |
| Business & Financial | 0 (0.0%) | 7 (100.0%) |
| Computers, Engineering & Science | 30 (65.2%) | 16 (34.8%) |
| Computers & Mathematics | 30 (100.0%) | 0 (0.0%) |
| Architecture & Engineering | 0 (0.0%) | 0 (0.0%) |
| Life, Physical & Social Science | 0 (0.0%) | 16 (100.0%) |
| Community & Social Service | 30 (71.4%) | 12 (28.6%) |
| Education, Arts & Media | 0 (0.0%) | 0 (0.0%) |
| Legal Services & Support | 0 (0.0%) | 0 (0.0%) |
| Education Instruction & Library | 15 (55.6%) | 12 (44.4%) |
| Arts, Media & Entertainment | 15 (100.0%) | 0 (0.0%) |
| Health Diagnosing & Treating | 18 (20.2%) | 71 (79.8%) |
| Health Technologists | 0 (0.0%) | 24 (100.0%) |
| Total (Category) | 118 (52.7%) | 106 (47.3%) |
| Total (Overall) | 266 (46.9%) | 301 (53.1%) |
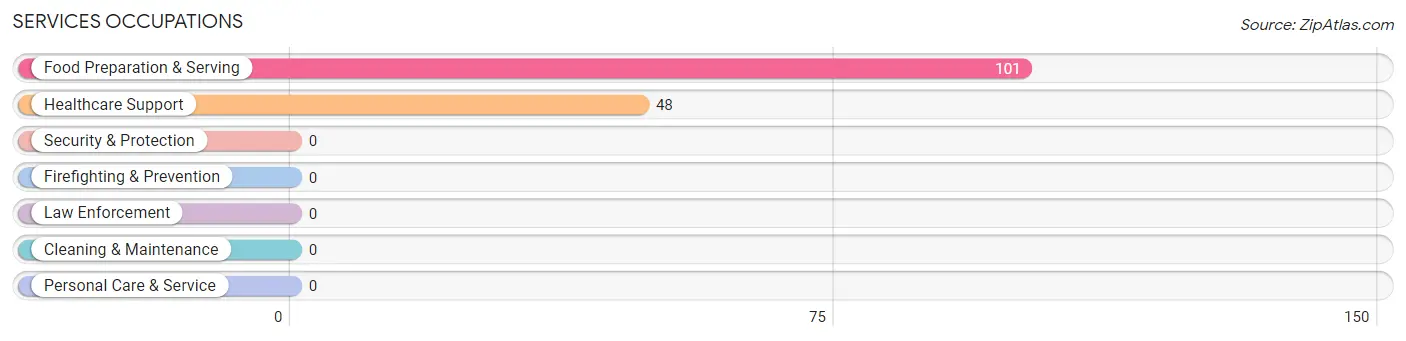
Services Occupations
The most common Services occupations in Rossmoor are Food Preparation & Serving (101 | 17.8%), and Healthcare Support (48 | 8.5%).
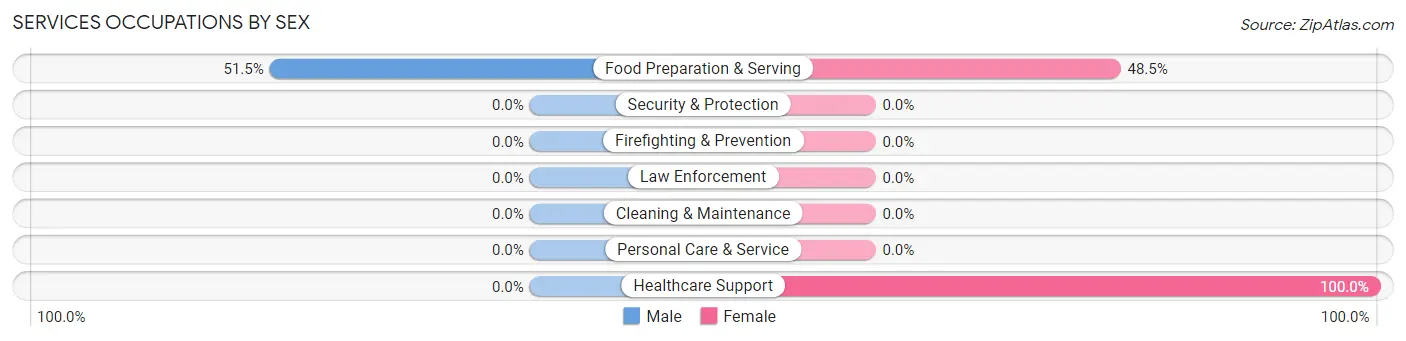
Services Occupations by Sex
| Occupation | Male | Female |
| Healthcare Support | 0 (0.0%) | 48 (100.0%) |
| Security & Protection | 0 (0.0%) | 0 (0.0%) |
| Firefighting & Prevention | 0 (0.0%) | 0 (0.0%) |
| Law Enforcement | 0 (0.0%) | 0 (0.0%) |
| Food Preparation & Serving | 52 (51.5%) | 49 (48.5%) |
| Cleaning & Maintenance | 0 (0.0%) | 0 (0.0%) |
| Personal Care & Service | 0 (0.0%) | 0 (0.0%) |
| Total (Category) | 52 (34.9%) | 97 (65.1%) |
| Total (Overall) | 266 (46.9%) | 301 (53.1%) |
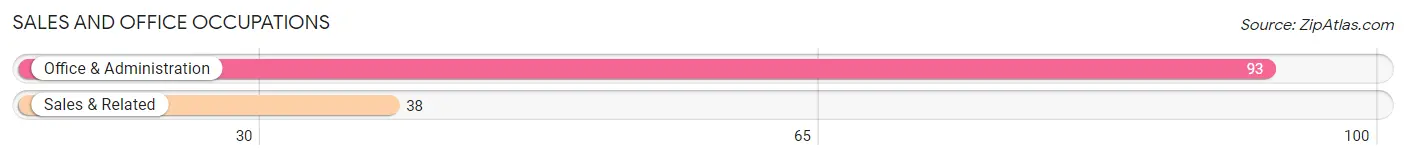
Sales and Office Occupations
The most common Sales and Office occupations in Rossmoor are Office & Administration (93 | 16.4%), and Sales & Related (38 | 6.7%).
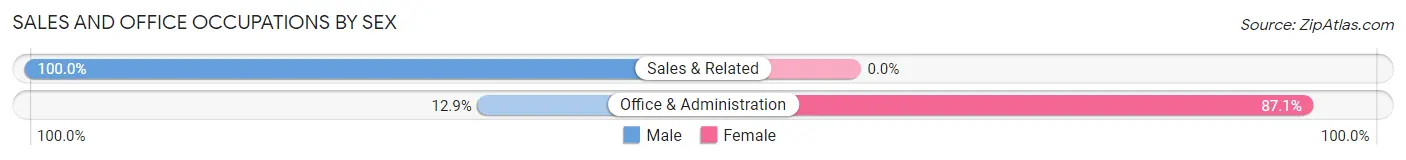
Sales and Office Occupations by Sex
| Occupation | Male | Female |
| Sales & Related | 38 (100.0%) | 0 (0.0%) |
| Office & Administration | 12 (12.9%) | 81 (87.1%) |
| Total (Category) | 50 (38.2%) | 81 (61.8%) |
| Total (Overall) | 266 (46.9%) | 301 (53.1%) |
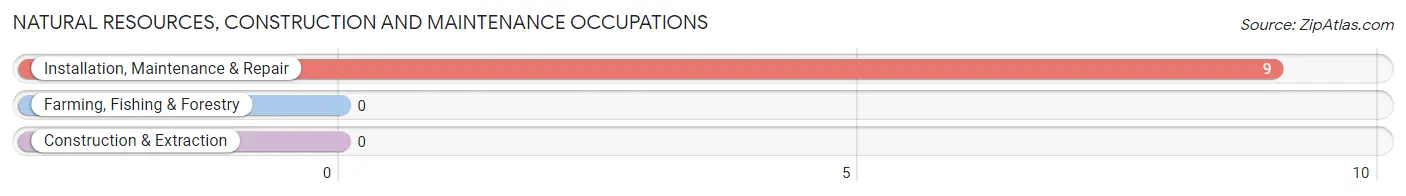
Natural Resources, Construction and Maintenance Occupations
The most common Natural Resources, Construction and Maintenance occupations in Rossmoor are , and Installation, Maintenance & Repair (9 | 1.6%).
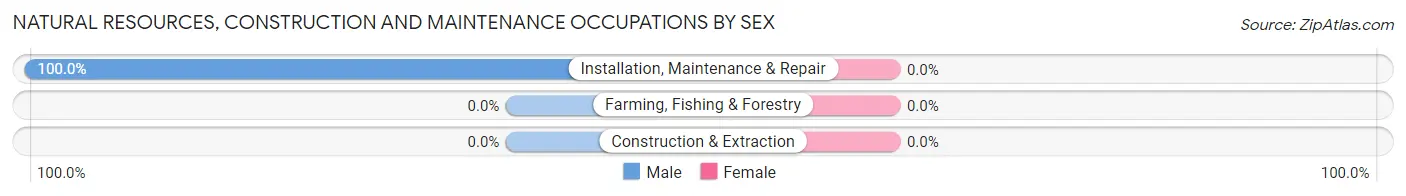
Natural Resources, Construction and Maintenance Occupations by Sex
| Occupation | Male | Female |
| Farming, Fishing & Forestry | 0 (0.0%) | 0 (0.0%) |
| Construction & Extraction | 0 (0.0%) | 0 (0.0%) |
| Installation, Maintenance & Repair | 9 (100.0%) | 0 (0.0%) |
| Total (Category) | 9 (100.0%) | 0 (0.0%) |
| Total (Overall) | 266 (46.9%) | 301 (53.1%) |
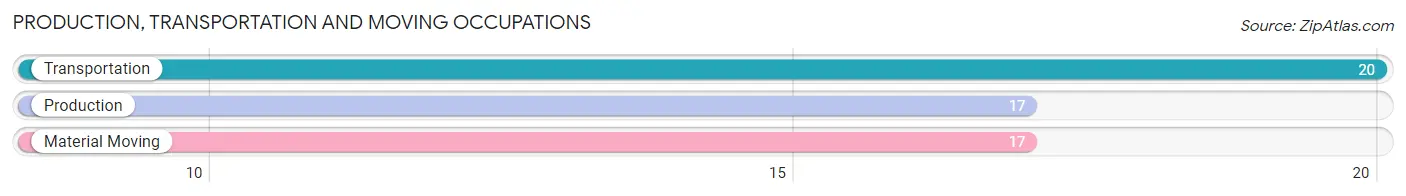
Production, Transportation and Moving Occupations
The most common Production, Transportation and Moving occupations in Rossmoor are Transportation (20 | 3.5%), Production (17 | 3.0%), and Material Moving (17 | 3.0%).
Production, Transportation and Moving Occupations by Sex
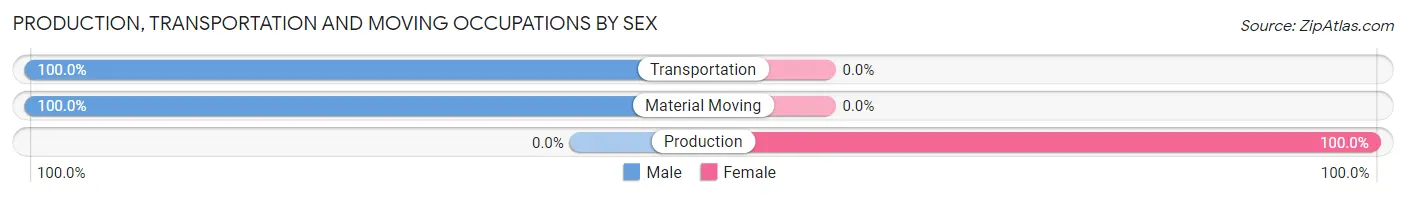
| Occupation | Male | Female |
| Production | 0 (0.0%) | 17 (100.0%) |
| Transportation | 20 (100.0%) | 0 (0.0%) |
| Material Moving | 17 (100.0%) | 0 (0.0%) |
| Total (Category) | 37 (68.5%) | 17 (31.5%) |
| Total (Overall) | 266 (46.9%) | 301 (53.1%) |
Employment Industries by Sex in Rossmoor
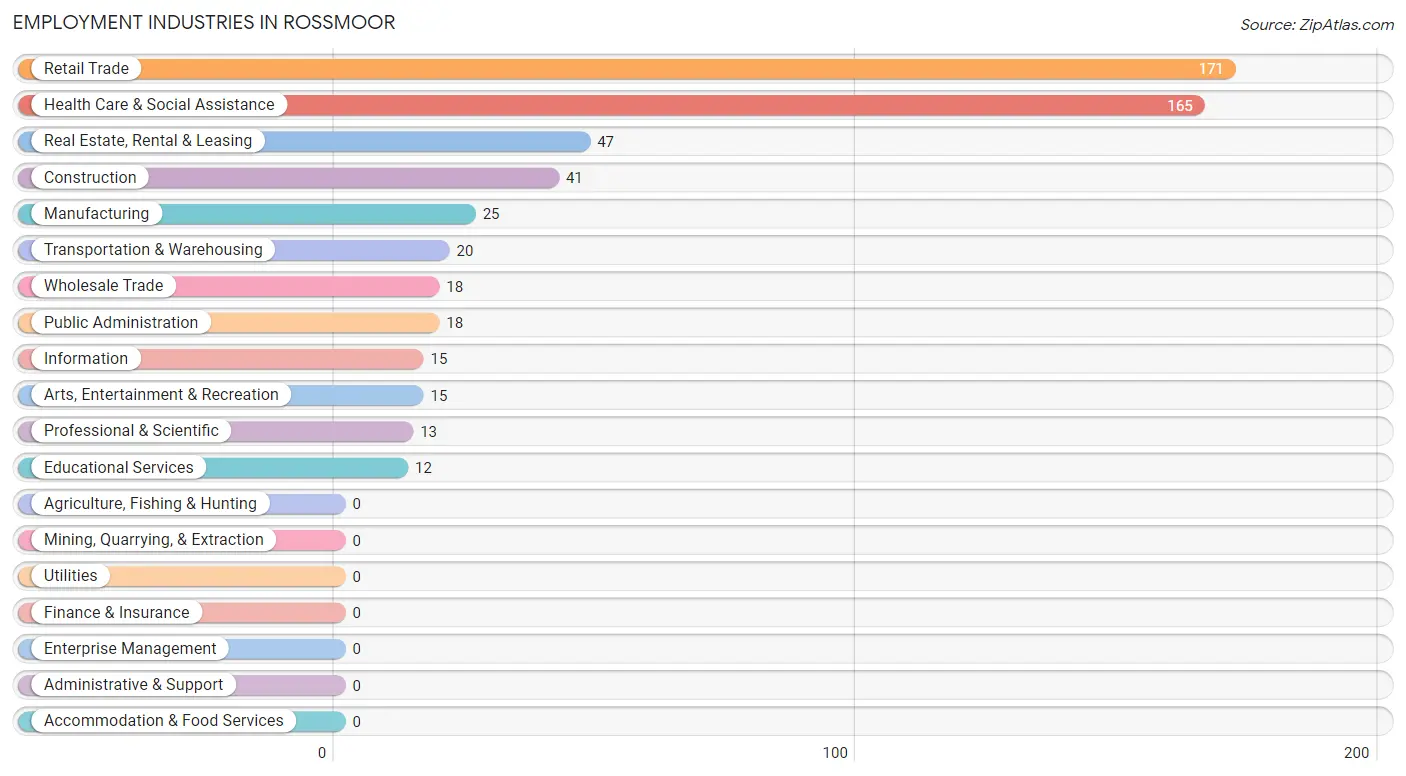
Employment Industries in Rossmoor
The major employment industries in Rossmoor include Retail Trade (171 | 30.2%), Health Care & Social Assistance (165 | 29.1%), Real Estate, Rental & Leasing (47 | 8.3%), Construction (41 | 7.2%), and Manufacturing (25 | 4.4%).
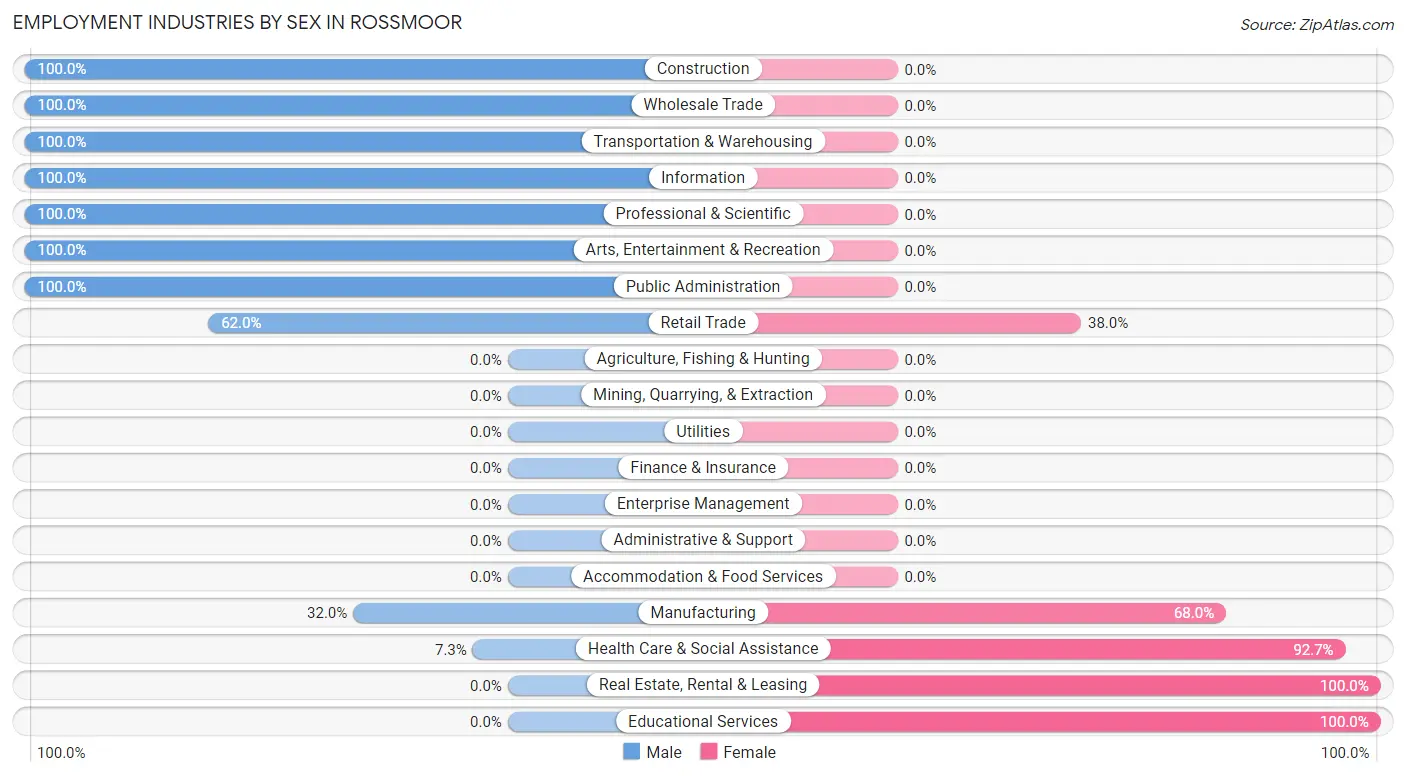
Employment Industries by Sex in Rossmoor
The Rossmoor industries that see more men than women are Construction (100.0%), Wholesale Trade (100.0%), and Transportation & Warehousing (100.0%), whereas the industries that tend to have a higher number of women are Real Estate, Rental & Leasing (100.0%), Educational Services (100.0%), and Health Care & Social Assistance (92.7%).
| Industry | Male | Female |
| Agriculture, Fishing & Hunting | 0 (0.0%) | 0 (0.0%) |
| Mining, Quarrying, & Extraction | 0 (0.0%) | 0 (0.0%) |
| Construction | 41 (100.0%) | 0 (0.0%) |
| Manufacturing | 8 (32.0%) | 17 (68.0%) |
| Wholesale Trade | 18 (100.0%) | 0 (0.0%) |
| Retail Trade | 106 (62.0%) | 65 (38.0%) |
| Transportation & Warehousing | 20 (100.0%) | 0 (0.0%) |
| Utilities | 0 (0.0%) | 0 (0.0%) |
| Information | 15 (100.0%) | 0 (0.0%) |
| Finance & Insurance | 0 (0.0%) | 0 (0.0%) |
| Real Estate, Rental & Leasing | 0 (0.0%) | 47 (100.0%) |
| Professional & Scientific | 13 (100.0%) | 0 (0.0%) |
| Enterprise Management | 0 (0.0%) | 0 (0.0%) |
| Administrative & Support | 0 (0.0%) | 0 (0.0%) |
| Educational Services | 0 (0.0%) | 12 (100.0%) |
| Health Care & Social Assistance | 12 (7.3%) | 153 (92.7%) |
| Arts, Entertainment & Recreation | 15 (100.0%) | 0 (0.0%) |
| Accommodation & Food Services | 0 (0.0%) | 0 (0.0%) |
| Public Administration | 18 (100.0%) | 0 (0.0%) |
| Total | 266 (46.9%) | 301 (53.1%) |
Education in Rossmoor
School Enrollment in Rossmoor
| School Level | # Students | % Students |
| Nursery / Preschool | 0 | 0.0% |
| Kindergarten | 0 | 0.0% |
| Elementary School | 0 | 0.0% |
| Middle School | 0 | 0.0% |
| High School | 0 | 0.0% |
| College / Undergraduate | 0 | 0.0% |
| Graduate / Professional | 0 | 0.0% |
| Total | 0 | 0.0% |
School Enrollment by Age by Funding Source in Rossmoor
| Age Bracket | Public School | Private School |
| 3 to 4 Year Olds | 0 (0.0%) | 0 (0.0%) |
| 5 to 9 Year Old | 0 (0.0%) | 0 (0.0%) |
| 10 to 14 Year Olds | 0 (0.0%) | 0 (0.0%) |
| 15 to 17 Year Olds | 0 (0.0%) | 0 (0.0%) |
| 18 to 19 Year Olds | 0 (0.0%) | 0 (0.0%) |
| 20 to 24 Year Olds | 0 (0.0%) | 0 (0.0%) |
| 25 to 34 Year Olds | 0 (0.0%) | 0 (0.0%) |
| 35 Years and over | 0 (0.0%) | 0 (0.0%) |
| Total | 0 (0.0%) | 0 (0.0%) |
Educational Attainment by Field of Study in Rossmoor
Education (288 | 28.5%), business (163 | 16.1%), bio, nature & agricultural (131 | 13.0%), engineering (73 | 7.2%), and psychology (64 | 6.3%) are the most common fields of study among 1,011 individuals in Rossmoor who have obtained a bachelor's degree or higher.
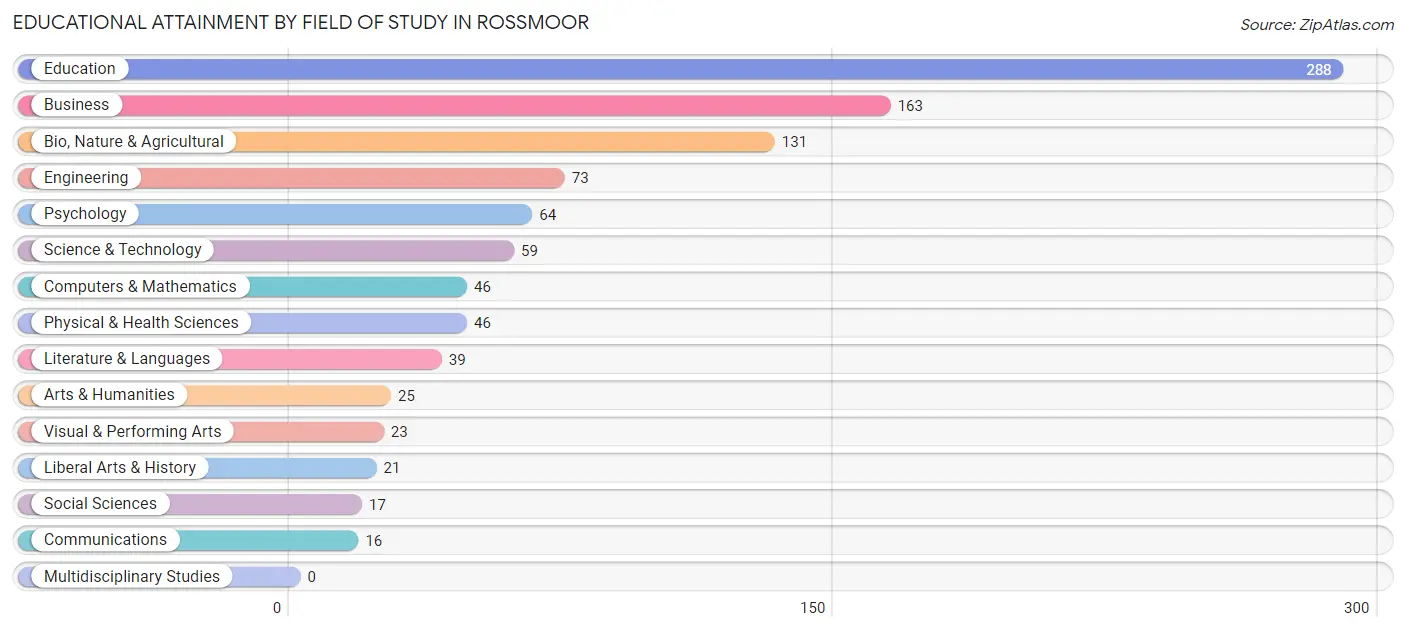
| Field of Study | # Graduates | % Graduates |
| Computers & Mathematics | 46 | 4.5% |
| Bio, Nature & Agricultural | 131 | 13.0% |
| Physical & Health Sciences | 46 | 4.5% |
| Psychology | 64 | 6.3% |
| Social Sciences | 17 | 1.7% |
| Engineering | 73 | 7.2% |
| Multidisciplinary Studies | 0 | 0.0% |
| Science & Technology | 59 | 5.8% |
| Business | 163 | 16.1% |
| Education | 288 | 28.5% |
| Literature & Languages | 39 | 3.9% |
| Liberal Arts & History | 21 | 2.1% |
| Visual & Performing Arts | 23 | 2.3% |
| Communications | 16 | 1.6% |
| Arts & Humanities | 25 | 2.5% |
| Total | 1,011 | 100.0% |
Transportation & Commute in Rossmoor
Vehicle Availability by Sex in Rossmoor
The most prevalent vehicle ownership categories in Rossmoor are males with 1 vehicle (107, accounting for 42.6%) and females with 1 vehicle (161, making up 36.9%).
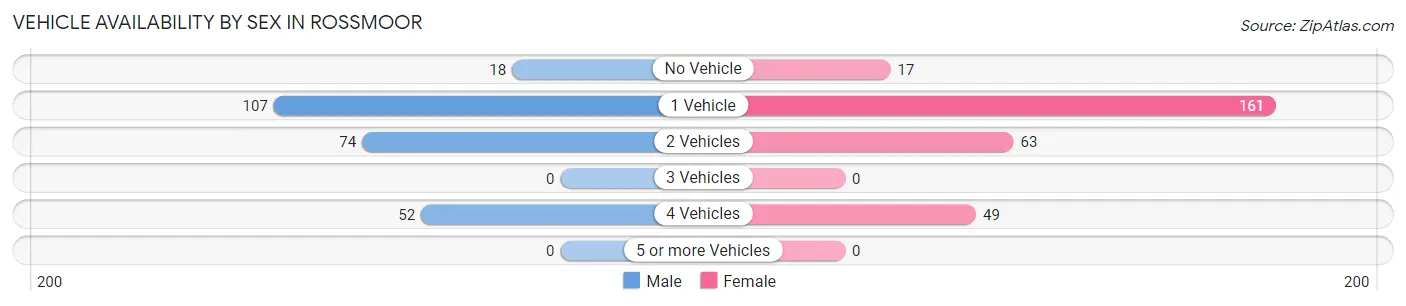
| Vehicles Available | Male | Female |
| No Vehicle | 18 (7.2%) | 17 (5.9%) |
| 1 Vehicle | 107 (42.6%) | 161 (55.5%) |
| 2 Vehicles | 74 (29.5%) | 63 (21.7%) |
| 3 Vehicles | 0 (0.0%) | 0 (0.0%) |
| 4 Vehicles | 52 (20.7%) | 49 (16.9%) |
| 5 or more Vehicles | 0 (0.0%) | 0 (0.0%) |
| Total | 251 (100.0%) | 290 (100.0%) |
Commute Time in Rossmoor
The most frequently occuring commute durations in Rossmoor are 20 to 24 minutes (91 commuters, 17.5%), 15 to 19 minutes (82 commuters, 15.8%), and less than 5 minutes (64 commuters, 12.3%).
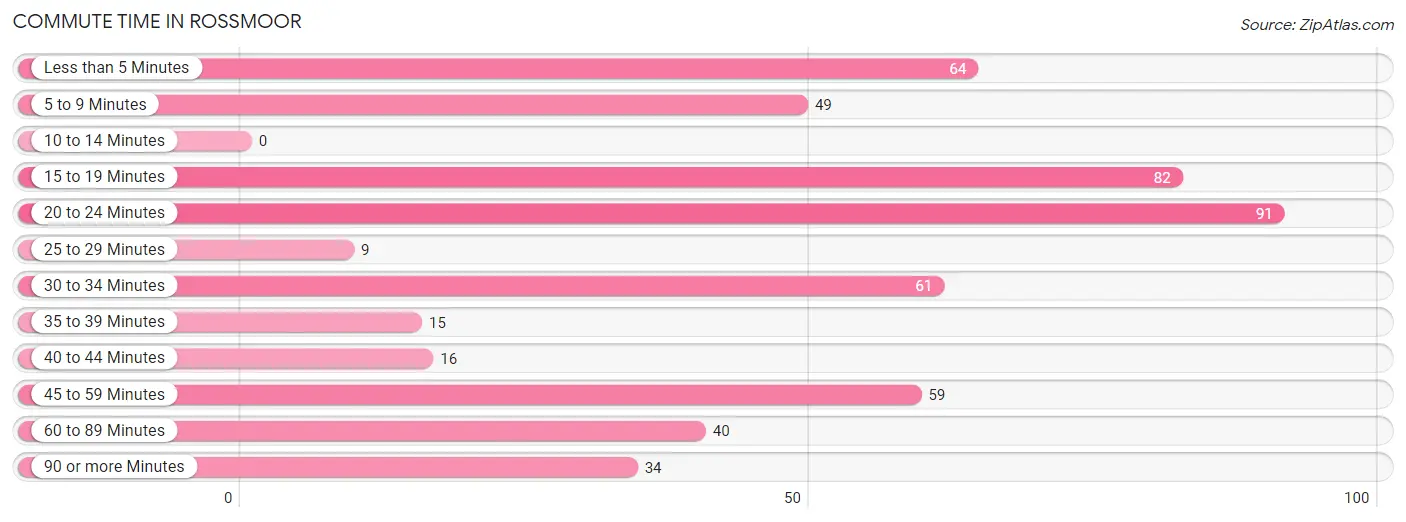
| Commute Time | # Commuters | % Commuters |
| Less than 5 Minutes | 64 | 12.3% |
| 5 to 9 Minutes | 49 | 9.4% |
| 10 to 14 Minutes | 0 | 0.0% |
| 15 to 19 Minutes | 82 | 15.8% |
| 20 to 24 Minutes | 91 | 17.5% |
| 25 to 29 Minutes | 9 | 1.7% |
| 30 to 34 Minutes | 61 | 11.7% |
| 35 to 39 Minutes | 15 | 2.9% |
| 40 to 44 Minutes | 16 | 3.1% |
| 45 to 59 Minutes | 59 | 11.4% |
| 60 to 89 Minutes | 40 | 7.7% |
| 90 or more Minutes | 34 | 6.5% |
Commute Time by Sex in Rossmoor
The most common commute times in Rossmoor are 15 to 19 minutes (52 commuters, 22.6%) for males and less than 5 minutes (64 commuters, 22.1%) for females.
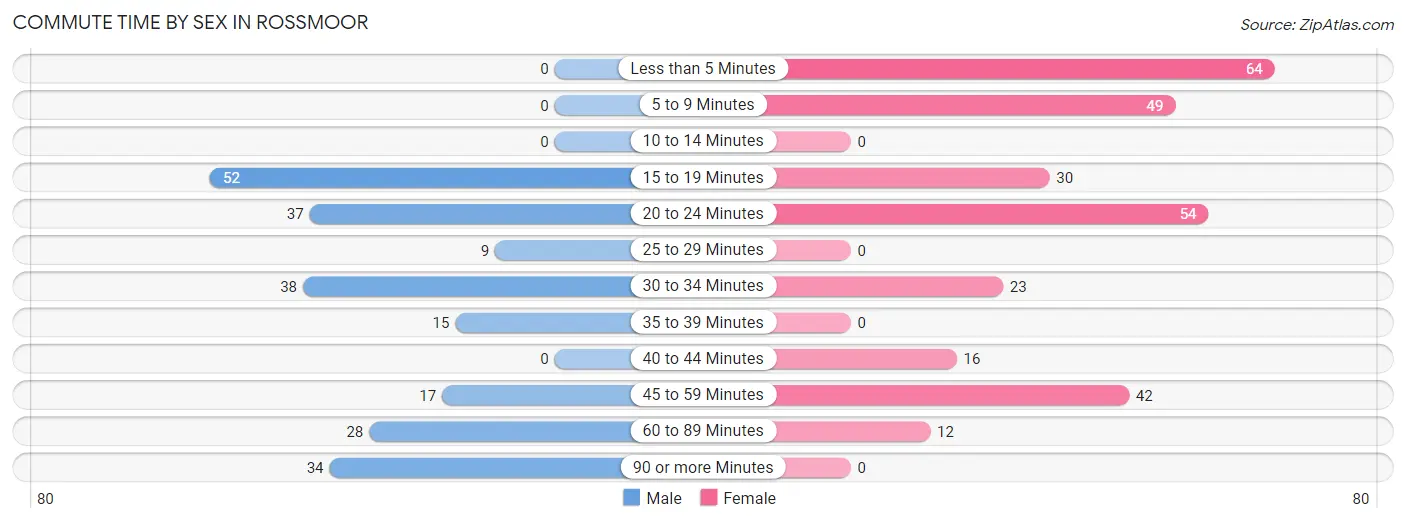
| Commute Time | Male | Female |
| Less than 5 Minutes | 0 (0.0%) | 64 (22.1%) |
| 5 to 9 Minutes | 0 (0.0%) | 49 (16.9%) |
| 10 to 14 Minutes | 0 (0.0%) | 0 (0.0%) |
| 15 to 19 Minutes | 52 (22.6%) | 30 (10.3%) |
| 20 to 24 Minutes | 37 (16.1%) | 54 (18.6%) |
| 25 to 29 Minutes | 9 (3.9%) | 0 (0.0%) |
| 30 to 34 Minutes | 38 (16.5%) | 23 (7.9%) |
| 35 to 39 Minutes | 15 (6.5%) | 0 (0.0%) |
| 40 to 44 Minutes | 0 (0.0%) | 16 (5.5%) |
| 45 to 59 Minutes | 17 (7.4%) | 42 (14.5%) |
| 60 to 89 Minutes | 28 (12.2%) | 12 (4.1%) |
| 90 or more Minutes | 34 (14.8%) | 0 (0.0%) |
Time of Departure to Work by Sex in Rossmoor
The most frequent times of departure to work in Rossmoor are 12:00 PM to 3:59 PM (68, 29.6%) for males and 9:00 AM to 9:59 AM (89, 30.7%) for females.
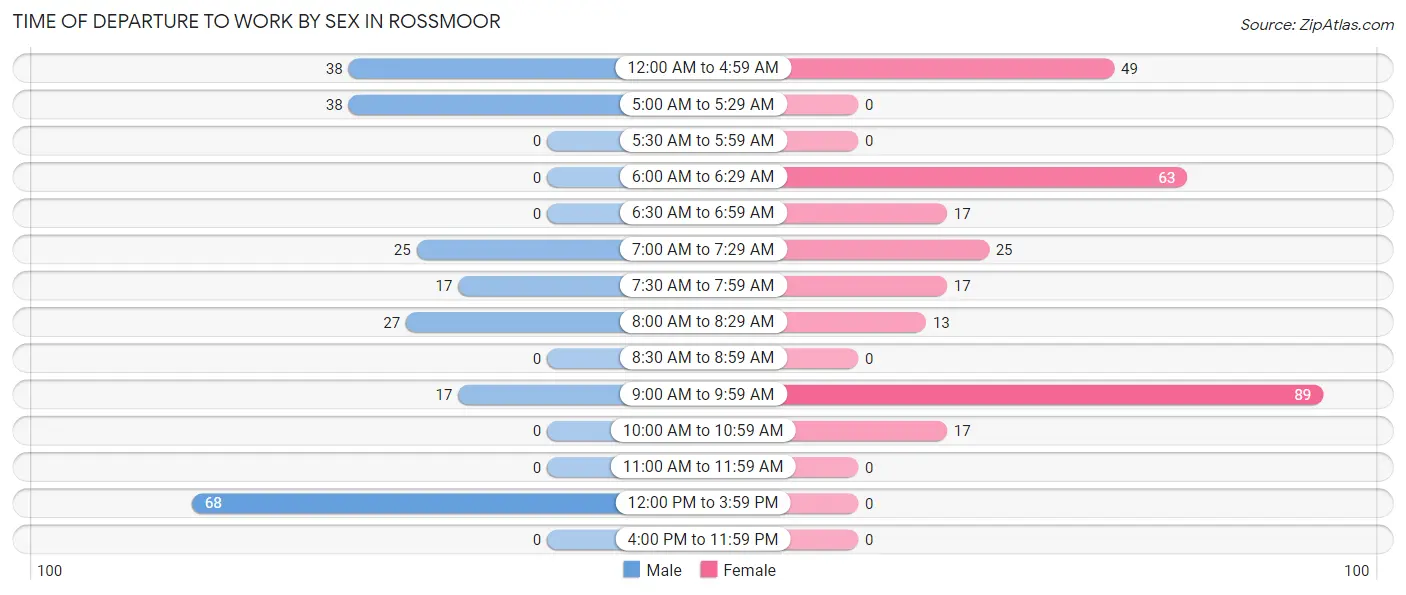
| Time of Departure | Male | Female |
| 12:00 AM to 4:59 AM | 38 (16.5%) | 49 (16.9%) |
| 5:00 AM to 5:29 AM | 38 (16.5%) | 0 (0.0%) |
| 5:30 AM to 5:59 AM | 0 (0.0%) | 0 (0.0%) |
| 6:00 AM to 6:29 AM | 0 (0.0%) | 63 (21.7%) |
| 6:30 AM to 6:59 AM | 0 (0.0%) | 17 (5.9%) |
| 7:00 AM to 7:29 AM | 25 (10.9%) | 25 (8.6%) |
| 7:30 AM to 7:59 AM | 17 (7.4%) | 17 (5.9%) |
| 8:00 AM to 8:29 AM | 27 (11.7%) | 13 (4.5%) |
| 8:30 AM to 8:59 AM | 0 (0.0%) | 0 (0.0%) |
| 9:00 AM to 9:59 AM | 17 (7.4%) | 89 (30.7%) |
| 10:00 AM to 10:59 AM | 0 (0.0%) | 17 (5.9%) |
| 11:00 AM to 11:59 AM | 0 (0.0%) | 0 (0.0%) |
| 12:00 PM to 3:59 PM | 68 (29.6%) | 0 (0.0%) |
| 4:00 PM to 11:59 PM | 0 (0.0%) | 0 (0.0%) |
| Total | 230 (100.0%) | 290 (100.0%) |
Housing Occupancy in Rossmoor
Occupancy by Ownership in Rossmoor
Of the total 2,137 dwellings in Rossmoor, owner-occupied units account for 1,886 (88.2%), while renter-occupied units make up 251 (11.7%).
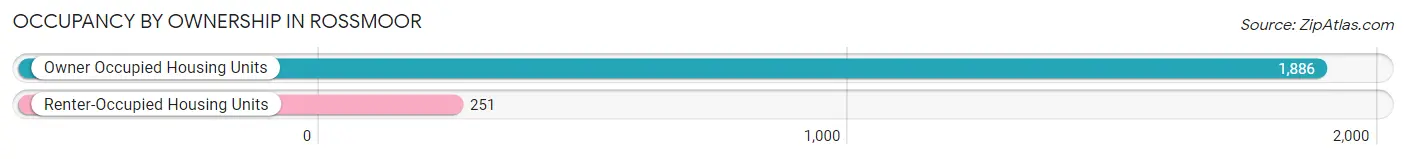
| Occupancy | # Housing Units | % Housing Units |
| Owner Occupied Housing Units | 1,886 | 88.2% |
| Renter-Occupied Housing Units | 251 | 11.7% |
| Total Occupied Housing Units | 2,137 | 100.0% |
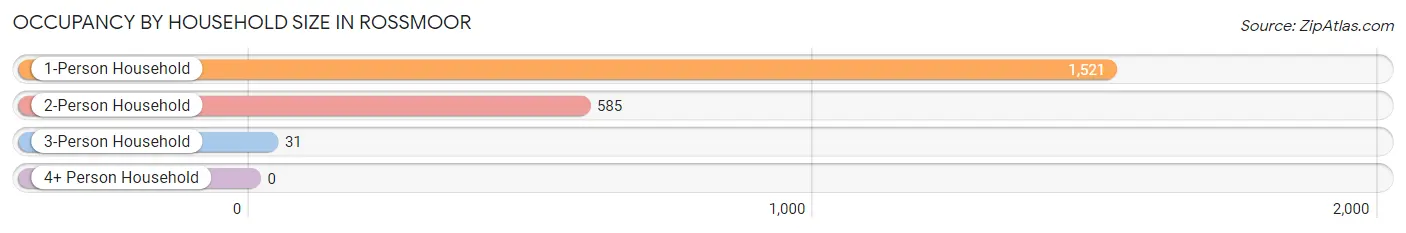
Occupancy by Household Size in Rossmoor
| Household Size | # Housing Units | % Housing Units |
| 1-Person Household | 1,521 | 71.2% |
| 2-Person Household | 585 | 27.4% |
| 3-Person Household | 31 | 1.5% |
| 4+ Person Household | 0 | 0.0% |
| Total Housing Units | 2,137 | 100.0% |
Occupancy by Ownership by Household Size in Rossmoor
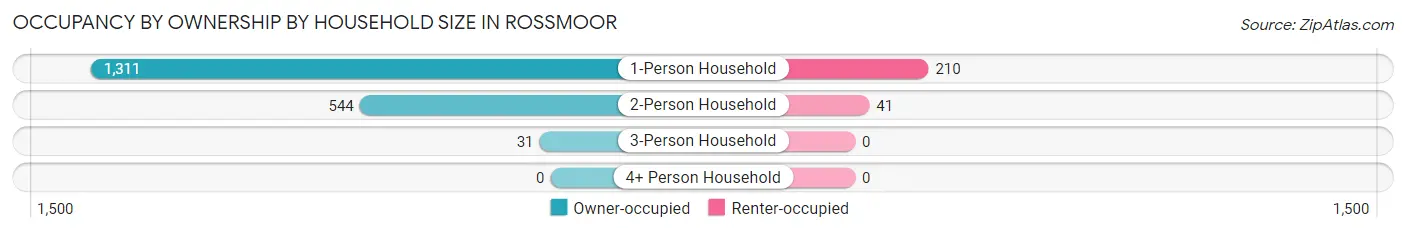
| Household Size | Owner-occupied | Renter-occupied |
| 1-Person Household | 1,311 (86.2%) | 210 (13.8%) |
| 2-Person Household | 544 (93.0%) | 41 (7.0%) |
| 3-Person Household | 31 (100.0%) | 0 (0.0%) |
| 4+ Person Household | 0 (0.0%) | 0 (0.0%) |
| Total Housing Units | 1,886 (88.2%) | 251 (11.7%) |
Occupancy by Educational Attainment in Rossmoor
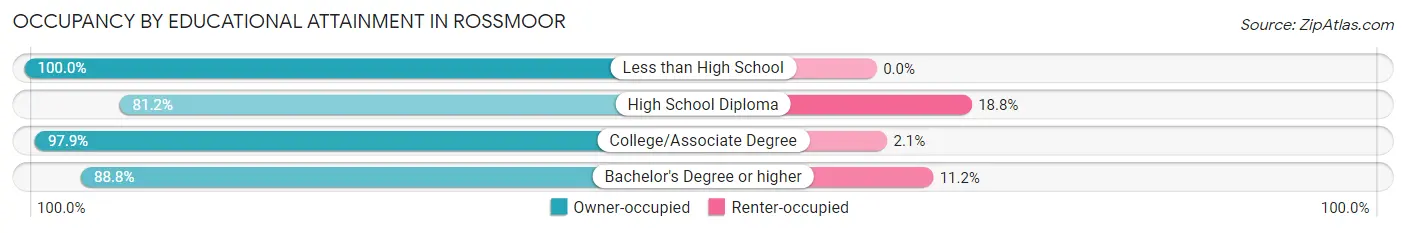
| Household Size | Owner-occupied | Renter-occupied |
| Less than High School | 52 (100.0%) | 0 (0.0%) |
| High School Diploma | 702 (81.2%) | 163 (18.8%) |
| College/Associate Degree | 522 (97.9%) | 11 (2.1%) |
| Bachelor's Degree or higher | 610 (88.8%) | 77 (11.2%) |
Occupancy by Age of Householder in Rossmoor
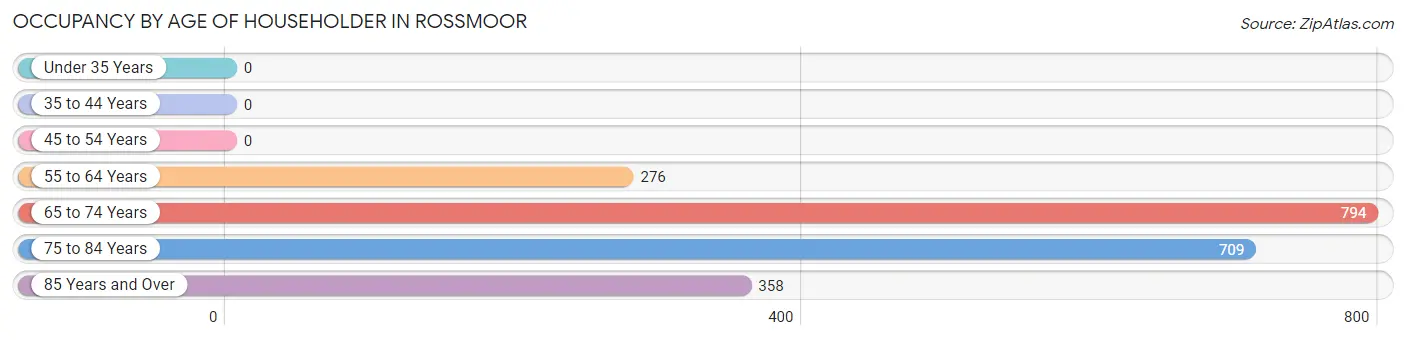
| Age Bracket | # Households | % Households |
| Under 35 Years | 0 | 0.0% |
| 35 to 44 Years | 0 | 0.0% |
| 45 to 54 Years | 0 | 0.0% |
| 55 to 64 Years | 276 | 12.9% |
| 65 to 74 Years | 794 | 37.1% |
| 75 to 84 Years | 709 | 33.2% |
| 85 Years and Over | 358 | 16.8% |
| Total | 2,137 | 100.0% |
Housing Finances in Rossmoor
Median Income by Occupancy in Rossmoor
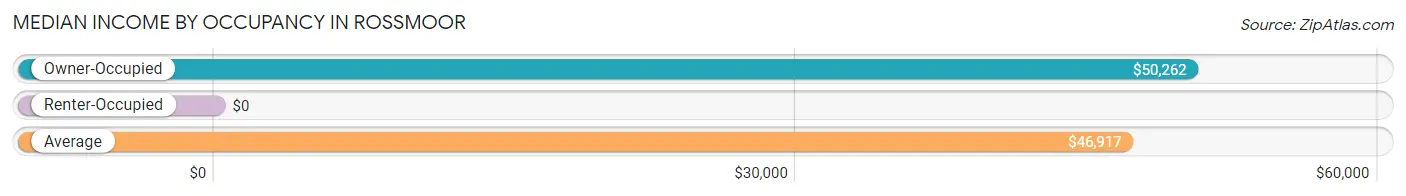
| Occupancy Type | # Households | Median Income |
| Owner-Occupied | 1,886 (88.2%) | $50,262 |
| Renter-Occupied | 251 (11.7%) | $0 |
| Average | 2,137 (100.0%) | $46,917 |
Occupancy by Householder Income Bracket in Rossmoor
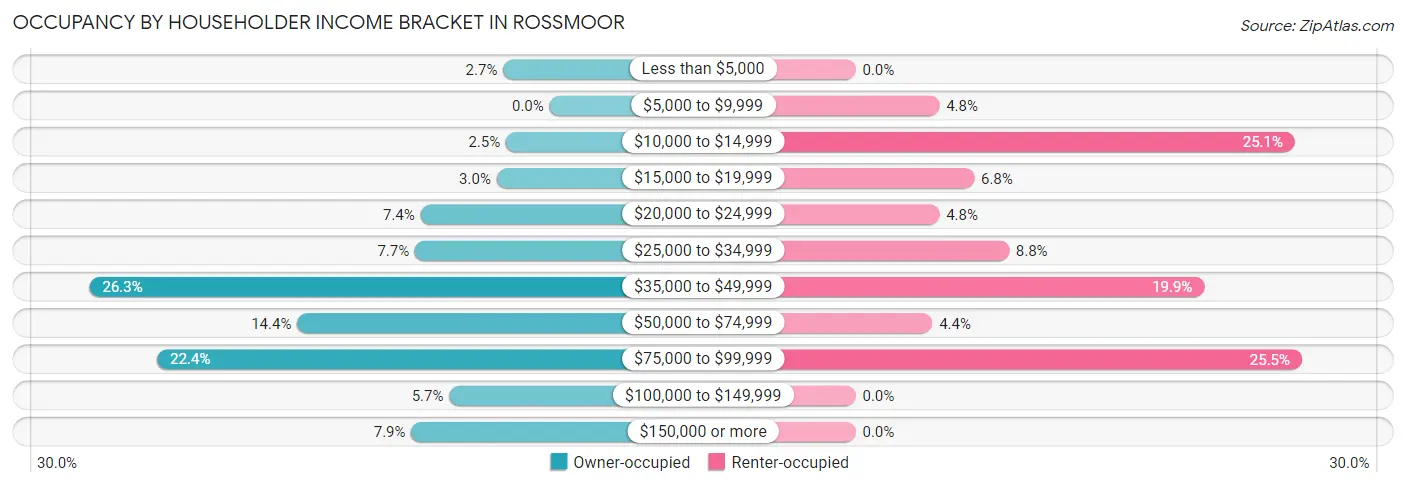
| Income Bracket | Owner-occupied | Renter-occupied |
| Less than $5,000 | 50 (2.6%) | 0 (0.0%) |
| $5,000 to $9,999 | 0 (0.0%) | 12 (4.8%) |
| $10,000 to $14,999 | 47 (2.5%) | 63 (25.1%) |
| $15,000 to $19,999 | 57 (3.0%) | 17 (6.8%) |
| $20,000 to $24,999 | 139 (7.4%) | 12 (4.8%) |
| $25,000 to $34,999 | 145 (7.7%) | 22 (8.8%) |
| $35,000 to $49,999 | 496 (26.3%) | 50 (19.9%) |
| $50,000 to $74,999 | 272 (14.4%) | 11 (4.4%) |
| $75,000 to $99,999 | 423 (22.4%) | 64 (25.5%) |
| $100,000 to $149,999 | 108 (5.7%) | 0 (0.0%) |
| $150,000 or more | 149 (7.9%) | 0 (0.0%) |
| Total | 1,886 (100.0%) | 251 (100.0%) |
Monthly Housing Cost Tiers in Rossmoor
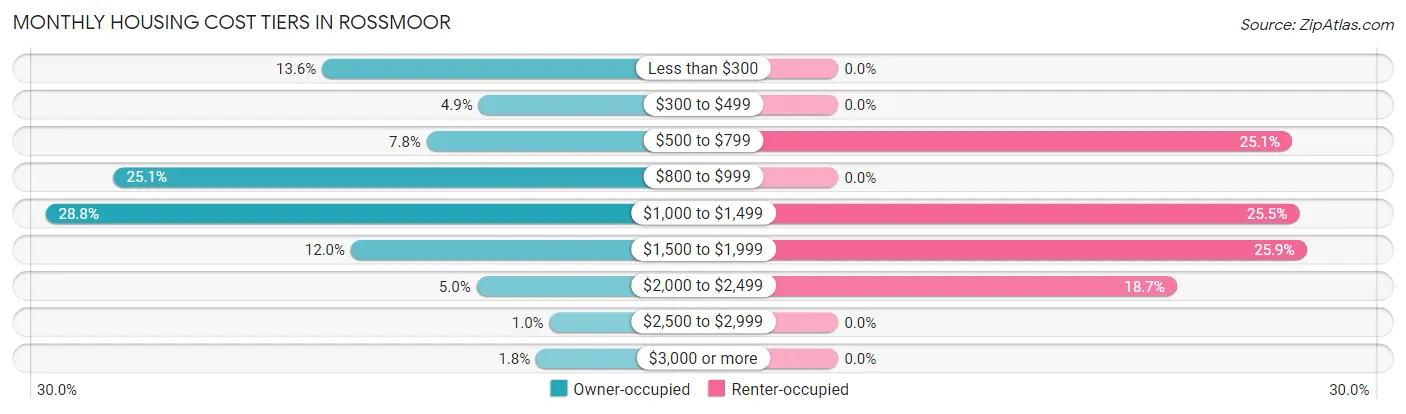
| Monthly Cost | Owner-occupied | Renter-occupied |
| Less than $300 | 256 (13.6%) | 0 (0.0%) |
| $300 to $499 | 93 (4.9%) | 0 (0.0%) |
| $500 to $799 | 147 (7.8%) | 63 (25.1%) |
| $800 to $999 | 473 (25.1%) | 0 (0.0%) |
| $1,000 to $1,499 | 544 (28.8%) | 64 (25.5%) |
| $1,500 to $1,999 | 226 (12.0%) | 65 (25.9%) |
| $2,000 to $2,499 | 95 (5.0%) | 47 (18.7%) |
| $2,500 to $2,999 | 19 (1.0%) | 0 (0.0%) |
| $3,000 or more | 33 (1.8%) | 0 (0.0%) |
| Total | 1,886 (100.0%) | 251 (100.0%) |
Physical Housing Characteristics in Rossmoor
Housing Structures in Rossmoor
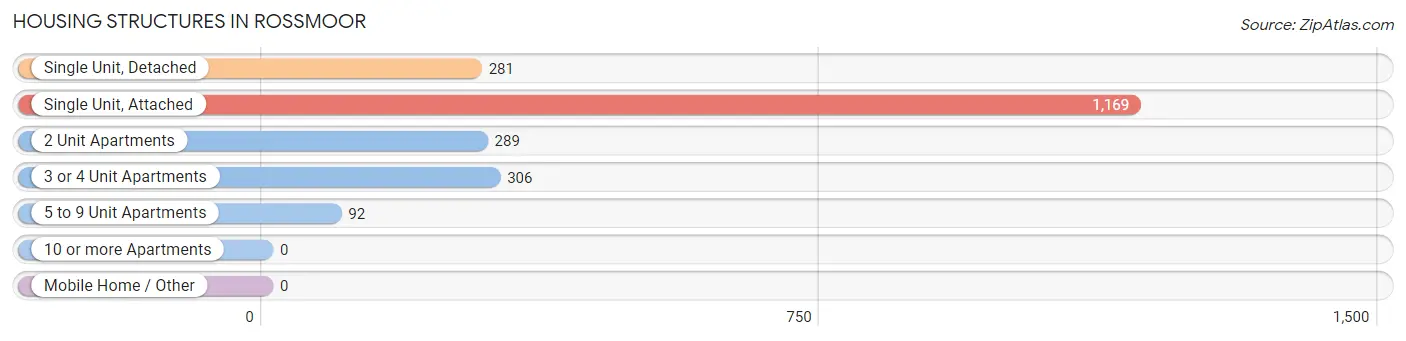
| Structure Type | # Housing Units | % Housing Units |
| Single Unit, Detached | 281 | 13.2% |
| Single Unit, Attached | 1,169 | 54.7% |
| 2 Unit Apartments | 289 | 13.5% |
| 3 or 4 Unit Apartments | 306 | 14.3% |
| 5 to 9 Unit Apartments | 92 | 4.3% |
| 10 or more Apartments | 0 | 0.0% |
| Mobile Home / Other | 0 | 0.0% |
| Total | 2,137 | 100.0% |
Housing Structures by Occupancy in Rossmoor
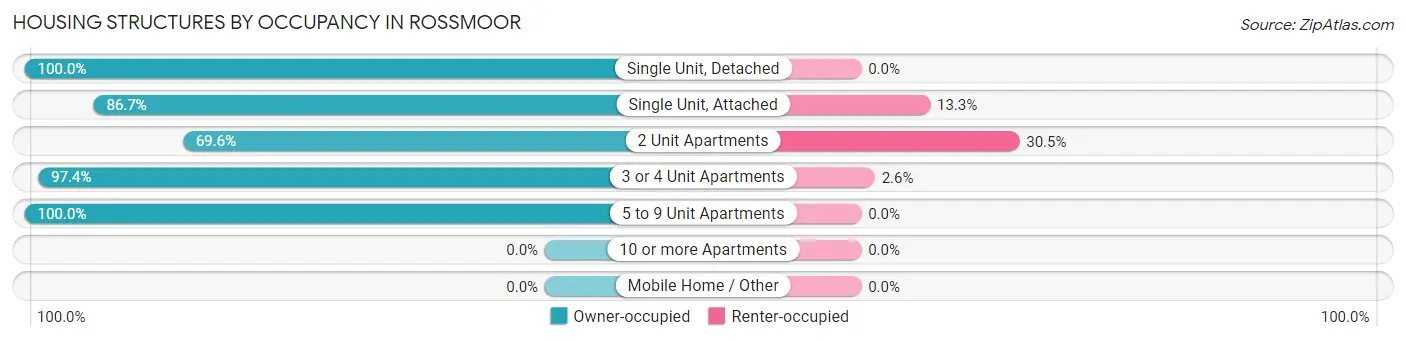
| Structure Type | Owner-occupied | Renter-occupied |
| Single Unit, Detached | 281 (100.0%) | 0 (0.0%) |
| Single Unit, Attached | 1,014 (86.7%) | 155 (13.3%) |
| 2 Unit Apartments | 201 (69.6%) | 88 (30.4%) |
| 3 or 4 Unit Apartments | 298 (97.4%) | 8 (2.6%) |
| 5 to 9 Unit Apartments | 92 (100.0%) | 0 (0.0%) |
| 10 or more Apartments | 0 (0.0%) | 0 (0.0%) |
| Mobile Home / Other | 0 (0.0%) | 0 (0.0%) |
| Total | 1,886 (88.2%) | 251 (11.7%) |
Housing Structures by Number of Rooms in Rossmoor
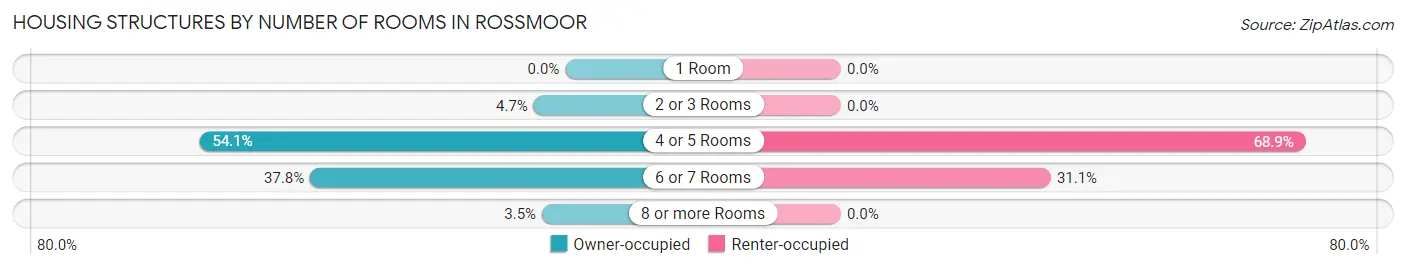
| Number of Rooms | Owner-occupied | Renter-occupied |
| 1 Room | 0 (0.0%) | 0 (0.0%) |
| 2 or 3 Rooms | 88 (4.7%) | 0 (0.0%) |
| 4 or 5 Rooms | 1,021 (54.1%) | 173 (68.9%) |
| 6 or 7 Rooms | 712 (37.8%) | 78 (31.1%) |
| 8 or more Rooms | 65 (3.5%) | 0 (0.0%) |
| Total | 1,886 (100.0%) | 251 (100.0%) |
Housing Structure by Heating Type in Rossmoor
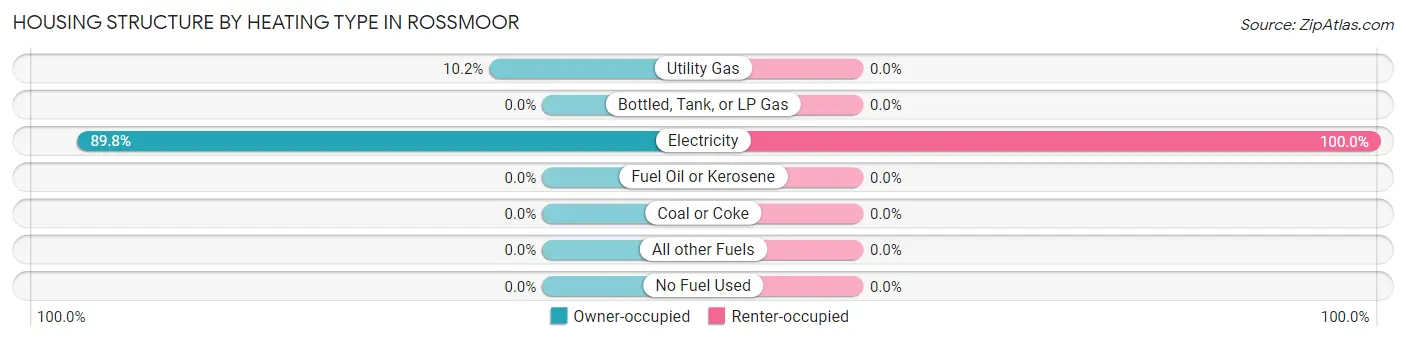
| Heating Type | Owner-occupied | Renter-occupied |
| Utility Gas | 193 (10.2%) | 0 (0.0%) |
| Bottled, Tank, or LP Gas | 0 (0.0%) | 0 (0.0%) |
| Electricity | 1,693 (89.8%) | 251 (100.0%) |
| Fuel Oil or Kerosene | 0 (0.0%) | 0 (0.0%) |
| Coal or Coke | 0 (0.0%) | 0 (0.0%) |
| All other Fuels | 0 (0.0%) | 0 (0.0%) |
| No Fuel Used | 0 (0.0%) | 0 (0.0%) |
| Total | 1,886 (100.0%) | 251 (100.0%) |
Household Vehicle Usage in Rossmoor
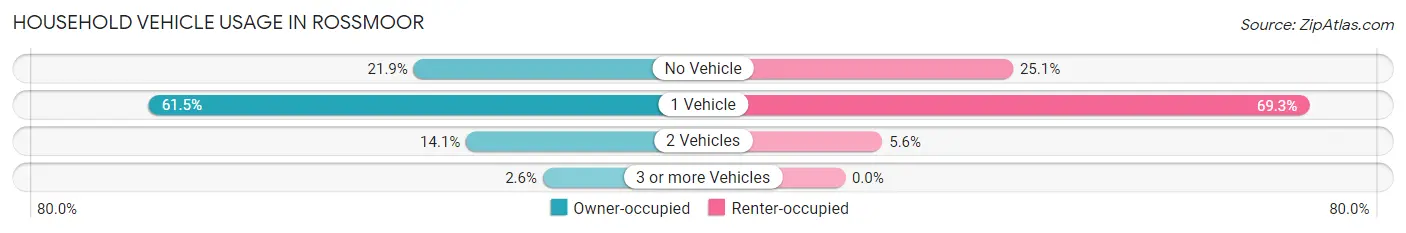
| Vehicles per Household | Owner-occupied | Renter-occupied |
| No Vehicle | 413 (21.9%) | 63 (25.1%) |
| 1 Vehicle | 1,159 (61.5%) | 174 (69.3%) |
| 2 Vehicles | 265 (14.1%) | 14 (5.6%) |
| 3 or more Vehicles | 49 (2.6%) | 0 (0.0%) |
| Total | 1,886 (100.0%) | 251 (100.0%) |
Real Estate & Mortgages in Rossmoor
Real Estate and Mortgage Overview in Rossmoor
| Characteristic | Without Mortgage | With Mortgage |
| Housing Units | 1,367 | 519 |
| Median Property Value | $136,800 | $171,100 |
| Median Household Income | $41,174 | $74 |
| Monthly Housing Costs | $890 | $33 |
| Real Estate Taxes | $1,986 | $0 |
Property Value by Mortgage Status in Rossmoor
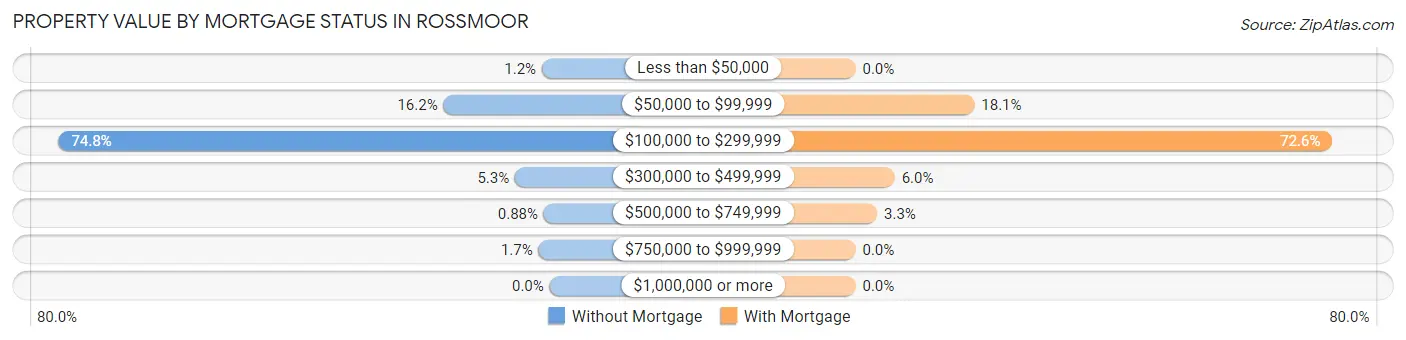
| Property Value | Without Mortgage | With Mortgage |
| Less than $50,000 | 16 (1.2%) | 0 (0.0%) |
| $50,000 to $99,999 | 221 (16.2%) | 94 (18.1%) |
| $100,000 to $299,999 | 1,023 (74.8%) | 377 (72.6%) |
| $300,000 to $499,999 | 72 (5.3%) | 31 (6.0%) |
| $500,000 to $749,999 | 12 (0.9%) | 17 (3.3%) |
| $750,000 to $999,999 | 23 (1.7%) | 0 (0.0%) |
| $1,000,000 or more | 0 (0.0%) | 0 (0.0%) |
| Total | 1,367 (100.0%) | 519 (100.0%) |
Household Income by Mortgage Status in Rossmoor
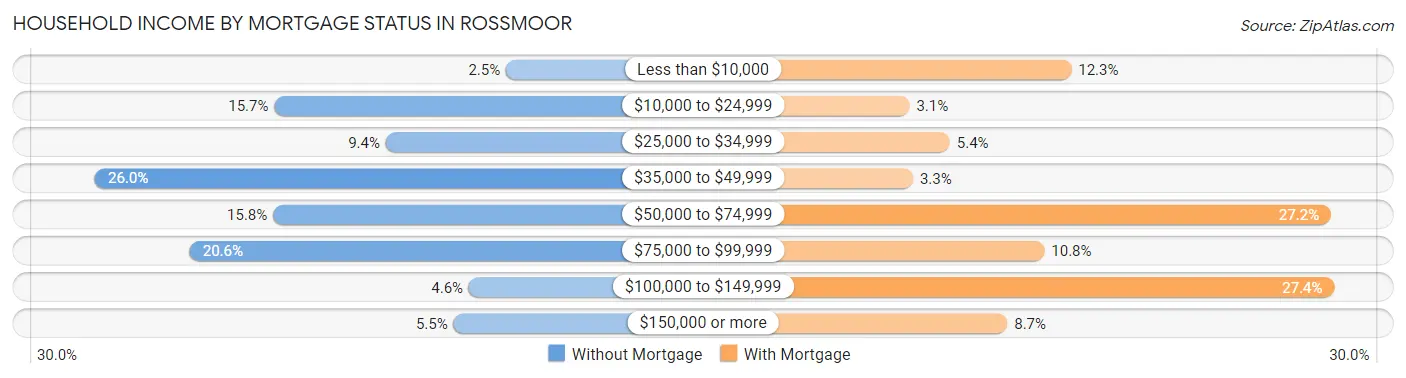
| Household Income | Without Mortgage | With Mortgage |
| Less than $10,000 | 34 (2.5%) | 64 (12.3%) |
| $10,000 to $24,999 | 215 (15.7%) | 16 (3.1%) |
| $25,000 to $34,999 | 128 (9.4%) | 28 (5.4%) |
| $35,000 to $49,999 | 355 (26.0%) | 17 (3.3%) |
| $50,000 to $74,999 | 216 (15.8%) | 141 (27.2%) |
| $75,000 to $99,999 | 281 (20.6%) | 56 (10.8%) |
| $100,000 to $149,999 | 63 (4.6%) | 142 (27.4%) |
| $150,000 or more | 75 (5.5%) | 45 (8.7%) |
| Total | 1,367 (100.0%) | 519 (100.0%) |
Property Value to Household Income Ratio in Rossmoor
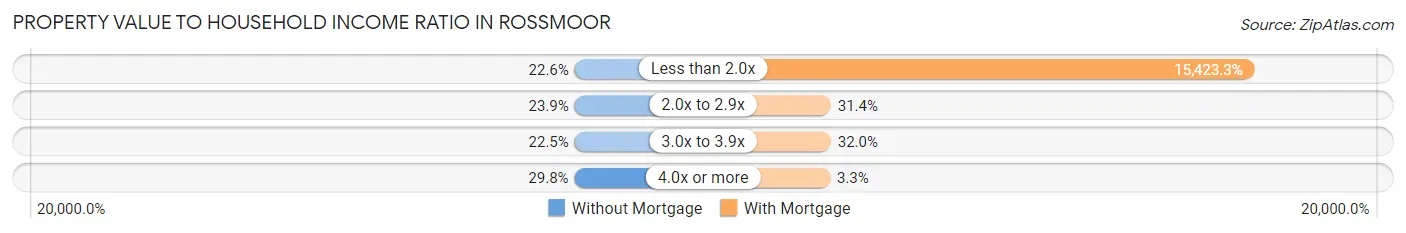
| Value-to-Income Ratio | Without Mortgage | With Mortgage |
| Less than 2.0x | 309 (22.6%) | 80,047 (15,423.3%) |
| 2.0x to 2.9x | 327 (23.9%) | 163 (31.4%) |
| 3.0x to 3.9x | 307 (22.5%) | 166 (32.0%) |
| 4.0x or more | 407 (29.8%) | 17 (3.3%) |
| Total | 1,367 (100.0%) | 519 (100.0%) |
Real Estate Taxes by Mortgage Status in Rossmoor
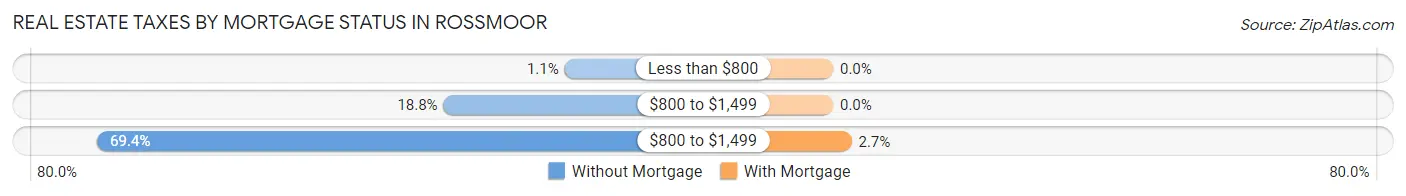
| Property Taxes | Without Mortgage | With Mortgage |
| Less than $800 | 15 (1.1%) | 0 (0.0%) |
| $800 to $1,499 | 257 (18.8%) | 0 (0.0%) |
| $800 to $1,499 | 949 (69.4%) | 14 (2.7%) |
| Total | 1,367 (100.0%) | 519 (100.0%) |
Health & Disability in Rossmoor
Health Insurance Coverage by Age in Rossmoor
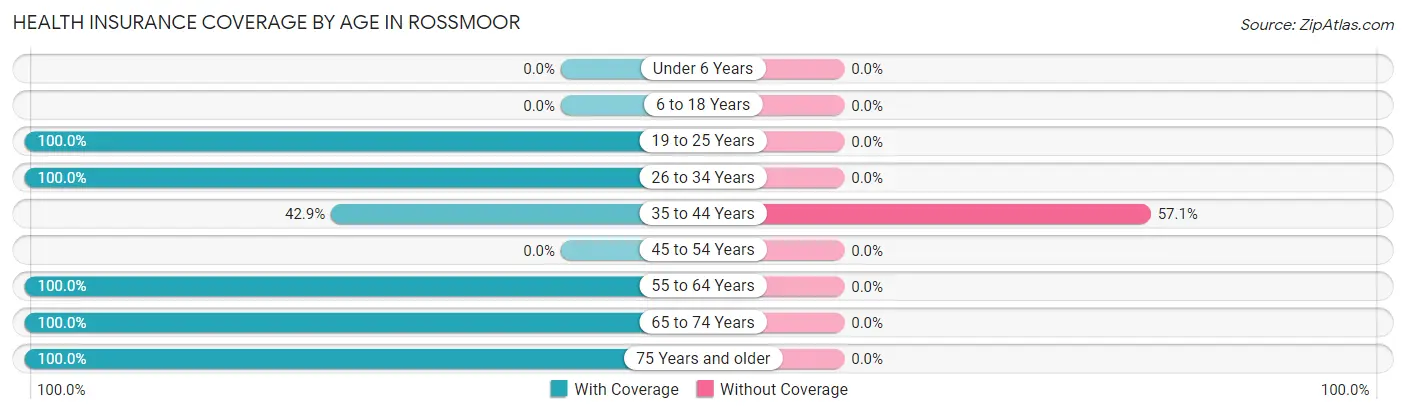
| Age Bracket | With Coverage | Without Coverage |
| Under 6 Years | 0 (0.0%) | 0 (0.0%) |
| 6 to 18 Years | 0 (0.0%) | 0 (0.0%) |
| 19 to 25 Years | 15 (100.0%) | 0 (0.0%) |
| 26 to 34 Years | 17 (100.0%) | 0 (0.0%) |
| 35 to 44 Years | 9 (42.9%) | 12 (57.1%) |
| 45 to 54 Years | 0 (0.0%) | 0 (0.0%) |
| 55 to 64 Years | 394 (100.0%) | 0 (0.0%) |
| 65 to 74 Years | 973 (100.0%) | 0 (0.0%) |
| 75 Years and older | 1,352 (100.0%) | 0 (0.0%) |
| Total | 2,760 (99.6%) | 12 (0.4%) |
Health Insurance Coverage by Citizenship Status in Rossmoor
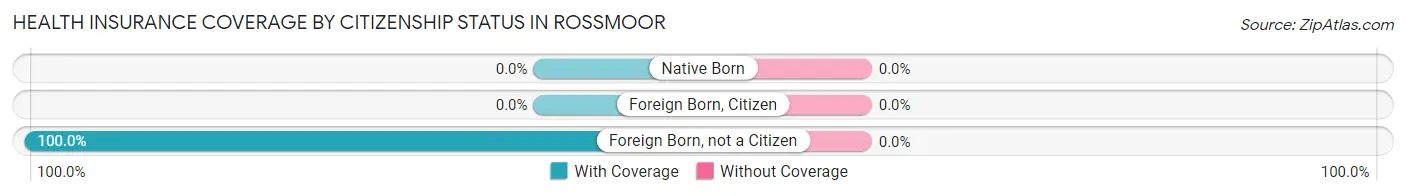
| Citizenship Status | With Coverage | Without Coverage |
| Native Born | 0 (0.0%) | 0 (0.0%) |
| Foreign Born, Citizen | 0 (0.0%) | 0 (0.0%) |
| Foreign Born, not a Citizen | 15 (100.0%) | 0 (0.0%) |
Health Insurance Coverage by Household Income in Rossmoor
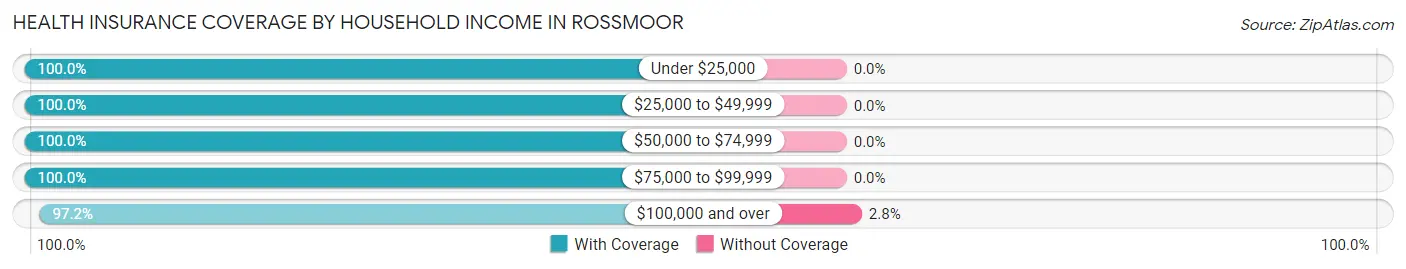
| Household Income | With Coverage | Without Coverage |
| Under $25,000 | 407 (100.0%) | 0 (0.0%) |
| $25,000 to $49,999 | 877 (100.0%) | 0 (0.0%) |
| $50,000 to $74,999 | 341 (100.0%) | 0 (0.0%) |
| $75,000 to $99,999 | 723 (100.0%) | 0 (0.0%) |
| $100,000 and over | 412 (97.2%) | 12 (2.8%) |
Public vs Private Health Insurance Coverage by Age in Rossmoor
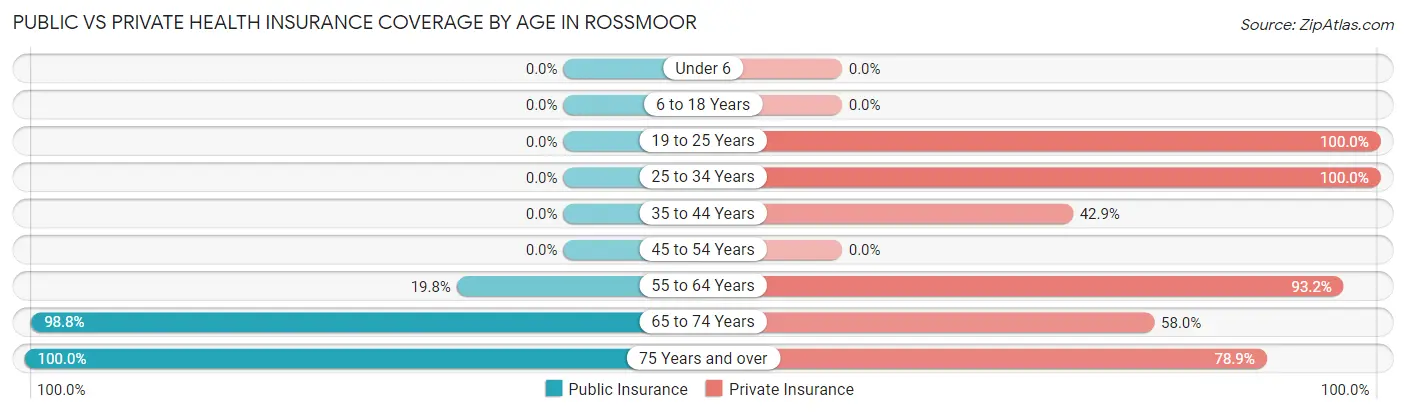
| Age Bracket | Public Insurance | Private Insurance |
| Under 6 | 0 (0.0%) | 0 (0.0%) |
| 6 to 18 Years | 0 (0.0%) | 0 (0.0%) |
| 19 to 25 Years | 0 (0.0%) | 15 (100.0%) |
| 25 to 34 Years | 0 (0.0%) | 17 (100.0%) |
| 35 to 44 Years | 0 (0.0%) | 9 (42.9%) |
| 45 to 54 Years | 0 (0.0%) | 0 (0.0%) |
| 55 to 64 Years | 78 (19.8%) | 367 (93.1%) |
| 65 to 74 Years | 961 (98.8%) | 564 (58.0%) |
| 75 Years and over | 1,352 (100.0%) | 1,066 (78.8%) |
| Total | 2,391 (86.3%) | 2,038 (73.5%) |
Disability Status by Sex by Age in Rossmoor
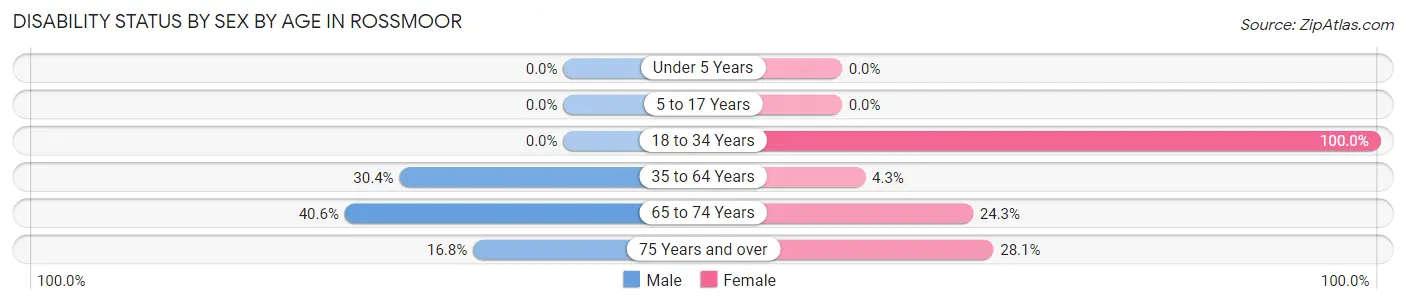
| Age Bracket | Male | Female |
| Under 5 Years | 0 (0.0%) | 0 (0.0%) |
| 5 to 17 Years | 0 (0.0%) | 0 (0.0%) |
| 18 to 34 Years | 0 (0.0%) | 15 (100.0%) |
| 35 to 64 Years | 42 (30.4%) | 12 (4.3%) |
| 65 to 74 Years | 168 (40.6%) | 136 (24.3%) |
| 75 Years and over | 55 (16.8%) | 288 (28.1%) |
Disability Class by Sex by Age in Rossmoor
Disability Class: Hearing Difficulty
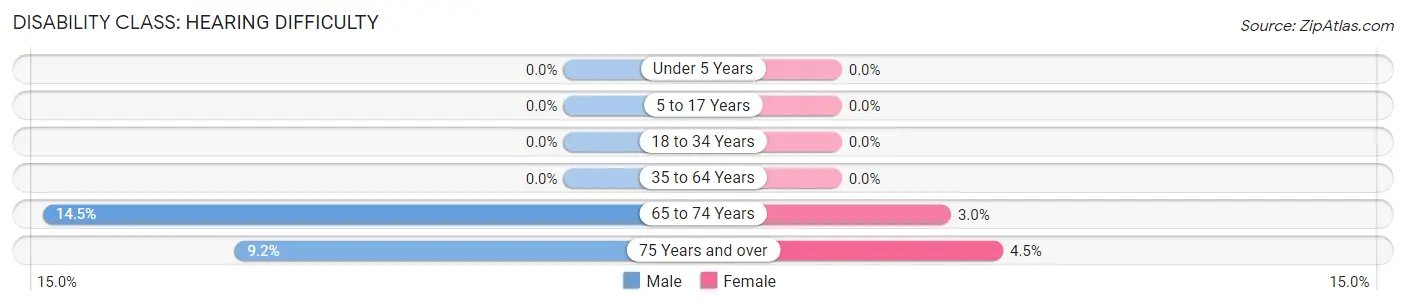
| Age Bracket | Male | Female |
| Under 5 Years | 0 (0.0%) | 0 (0.0%) |
| 5 to 17 Years | 0 (0.0%) | 0 (0.0%) |
| 18 to 34 Years | 0 (0.0%) | 0 (0.0%) |
| 35 to 64 Years | 0 (0.0%) | 0 (0.0%) |
| 65 to 74 Years | 60 (14.5%) | 17 (3.0%) |
| 75 Years and over | 30 (9.1%) | 46 (4.5%) |
Disability Class: Vision Difficulty
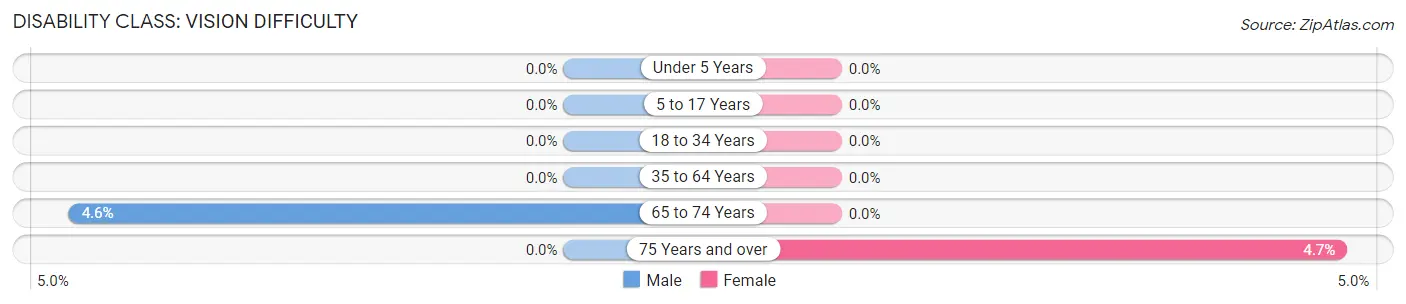
| Age Bracket | Male | Female |
| Under 5 Years | 0 (0.0%) | 0 (0.0%) |
| 5 to 17 Years | 0 (0.0%) | 0 (0.0%) |
| 18 to 34 Years | 0 (0.0%) | 0 (0.0%) |
| 35 to 64 Years | 0 (0.0%) | 0 (0.0%) |
| 65 to 74 Years | 19 (4.6%) | 0 (0.0%) |
| 75 Years and over | 0 (0.0%) | 48 (4.7%) |
Disability Class: Cognitive Difficulty
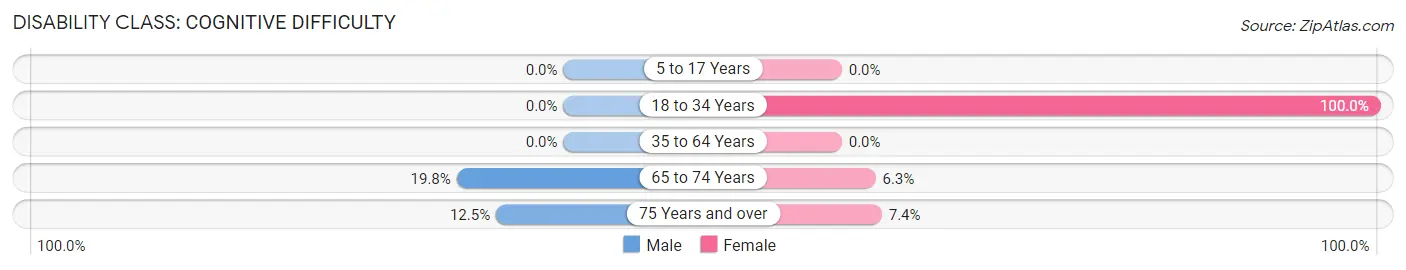
| Age Bracket | Male | Female |
| 5 to 17 Years | 0 (0.0%) | 0 (0.0%) |
| 18 to 34 Years | 0 (0.0%) | 15 (100.0%) |
| 35 to 64 Years | 0 (0.0%) | 0 (0.0%) |
| 65 to 74 Years | 82 (19.8%) | 35 (6.3%) |
| 75 Years and over | 41 (12.5%) | 76 (7.4%) |
Disability Class: Ambulatory Difficulty
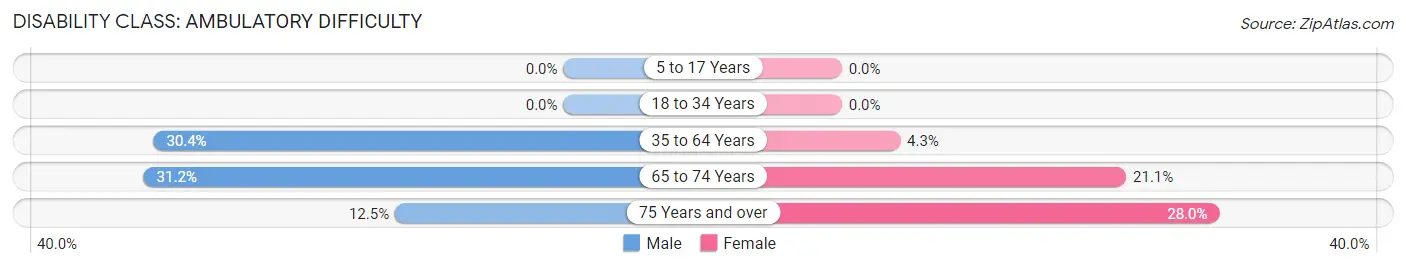
| Age Bracket | Male | Female |
| 5 to 17 Years | 0 (0.0%) | 0 (0.0%) |
| 18 to 34 Years | 0 (0.0%) | 0 (0.0%) |
| 35 to 64 Years | 42 (30.4%) | 12 (4.3%) |
| 65 to 74 Years | 129 (31.2%) | 118 (21.1%) |
| 75 Years and over | 41 (12.5%) | 287 (28.0%) |
Disability Class: Self-Care Difficulty
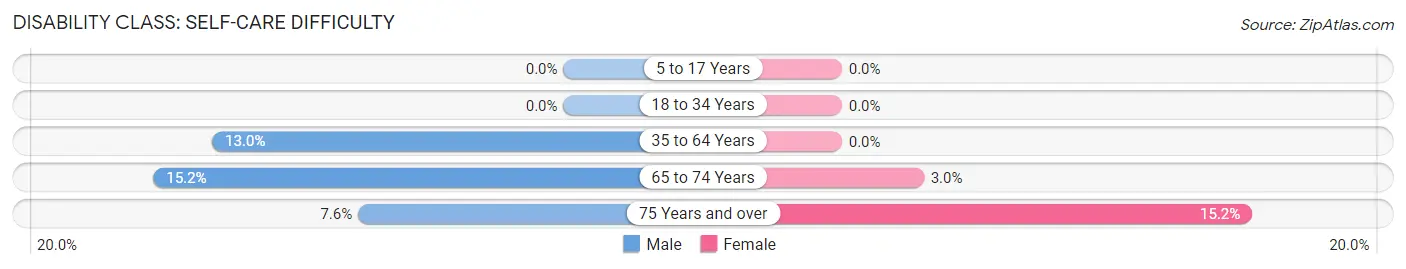
| Age Bracket | Male | Female |
| 5 to 17 Years | 0 (0.0%) | 0 (0.0%) |
| 18 to 34 Years | 0 (0.0%) | 0 (0.0%) |
| 35 to 64 Years | 18 (13.0%) | 0 (0.0%) |
| 65 to 74 Years | 63 (15.2%) | 17 (3.0%) |
| 75 Years and over | 25 (7.6%) | 156 (15.2%) |
Technology Access in Rossmoor
Computing Device Access in Rossmoor
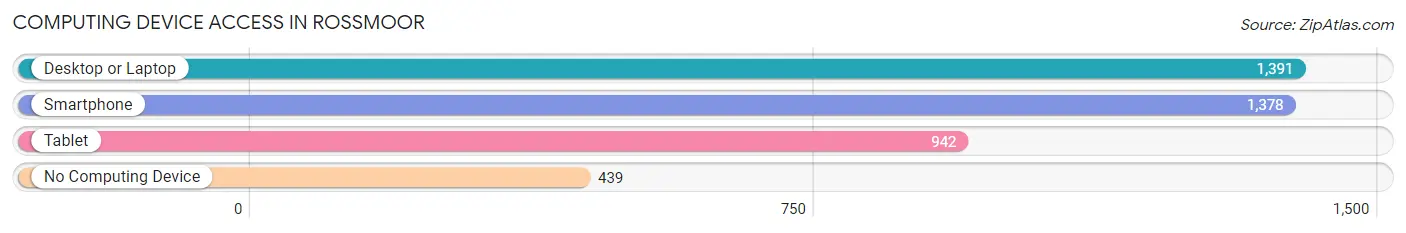
| Device Type | # Households | % Households |
| Desktop or Laptop | 1,391 | 65.1% |
| Smartphone | 1,378 | 64.5% |
| Tablet | 942 | 44.1% |
| No Computing Device | 439 | 20.5% |
| Total | 2,137 | 100.0% |
Internet Access in Rossmoor
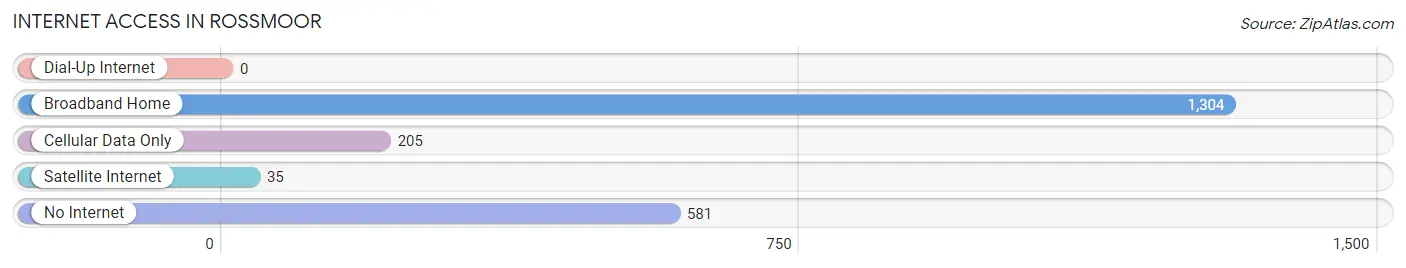
| Internet Type | # Households | % Households |
| Dial-Up Internet | 0 | 0.0% |
| Broadband Home | 1,304 | 61.0% |
| Cellular Data Only | 205 | 9.6% |
| Satellite Internet | 35 | 1.6% |
| No Internet | 581 | 27.2% |
| Total | 2,137 | 100.0% |
Rossmoor Summary
Rossmoor, NJ is a small unincorporated community located in Ocean County, New Jersey. It is situated in the northern part of the county, just south of the border with Monmouth County. The community is bordered by the towns of Toms River, Manchester, and Berkeley Township. Rossmoor is a census-designated place (CDP) and had a population of 4,845 as of the 2010 census.
History
The area that is now Rossmoor was originally inhabited by the Lenape Native Americans. The first European settlers arrived in the area in the late 17th century. The area was originally known as “Crossmoor” and was part of the Township of Dover, which was established in 1767. In 1845, the Township of Dover was divided into two parts, with the northern part becoming the Township of Toms River.
In the early 20th century, the area was developed as a summer resort community. The area was renamed “Rossmoor” in honor of the Ross family, who owned much of the land in the area. The Ross family also built a large hotel in the area, which was later destroyed by a fire in the 1950s.
Geography
Rossmoor is located at 39°56'25"N 74°14'45"W (39.940278, -74.245833). It is situated in the northern part of Ocean County, just south of the border with Monmouth County. The community is bordered by the towns of Toms River, Manchester, and Berkeley Township. According to the United States Census Bureau, the CDP has a total area of 1.3 square miles (3.4 km2), all of which is land.
Economy
The economy of Rossmoor is largely based on tourism and retail. The area is home to several small businesses, including restaurants, shops, and other services. The community is also home to a number of small manufacturing companies.
Demographics
As of the 2010 census, there were 4,845 people, 1,945 households, and 1,521 families residing in the CDP. The population density was 3,717.3 people per square mile (1,433.2/km2). There were 2,072 housing units at an average density of 1,593.2 per square mile (615.2/km2). The racial makeup of the CDP was 94.2% White, 1.3% African American, 0.2% Native American, 1.7% Asian, 0.1% Pacific Islander, 1.2% from other races, and 1.4% from two or more races. Hispanic or Latino of any race were 4.2% of the population.
There were 1,945 households, out of which 28.2% had children under the age of 18 living with them, 63.2% were married couples living together, 8.2% had a female householder with no husband present, and 25.2% were non-families. 21.2% of all households were made up of individuals, and 11.2% had someone living alone who was 65 years of age or older. The average household size was 2.50 and the average family size was 2.90.
In the CDP, the population was spread out, with 21.2% under the age of 18, 5.2% from 18 to 24, 24.2% from 25 to 44, 28.2% from 45 to 64, and 21.2% who were 65 years of age or older. The median age was 44 years. For every 100 females, there were 94.2 males. For every 100 females age 18 and over, there were 91.2 males.
The median income for a household in the CDP was $68,958, and the median income for a family was $76,944. Males had a median income of $51,964 versus $41,250 for females. The per capita income for the CDP was $32,945. About 2.2% of families and 3.2% of the population were below the poverty line, including 4.2% of those under age 18 and 2.2% of those age 65 or over.
Common Questions
What is Per Capita Income in Rossmoor?
Per Capita income in Rossmoor is $47,865.
What is the Median Family Income in Rossmoor?
Median Family Income in Rossmoor is $75,330.
What is the Median Household income in Rossmoor?
Median Household Income in Rossmoor is $46,917.
What is Inequality or Gini Index in Rossmoor?
Inequality or Gini Index in Rossmoor is 0.40.
What is the Total Population of Rossmoor?
Total Population of Rossmoor is 2,772.
What is the Total Male Population of Rossmoor?
Total Male Population of Rossmoor is 897.
What is the Total Female Population of Rossmoor?
Total Female Population of Rossmoor is 1,875.
What is the Ratio of Males per 100 Females in Rossmoor?
There are 47.84 Males per 100 Females in Rossmoor.
What is the Ratio of Females per 100 Males in Rossmoor?
There are 209.03 Females per 100 Males in Rossmoor.
What is the Median Population Age in Rossmoor?
Median Population Age in Rossmoor is 74.5 Years.
What is the Average Family Size in Rossmoor
Average Family Size in Rossmoor is 2.0 People.
What is the Average Household Size in Rossmoor
Average Household Size in Rossmoor is 1.3 People.
How Large is the Labor Force in Rossmoor?
There are 629 People in the Labor Forcein in Rossmoor.
What is the Percentage of People in the Labor Force in Rossmoor?
22.7% of People are in the Labor Force in Rossmoor.
What is the Unemployment Rate in Rossmoor?
Unemployment Rate in Rossmoor is 9.9%.