Cities with the Highest Percentage of Immigrants from Bulgaria in New Jersey
RELATED REPORTS & OPTIONS
Bulgaria
New Jersey
Compare Cities
Map of Cities with the Highest Percentage of Immigrants from Bulgaria in New Jersey
0.00%
3.00%
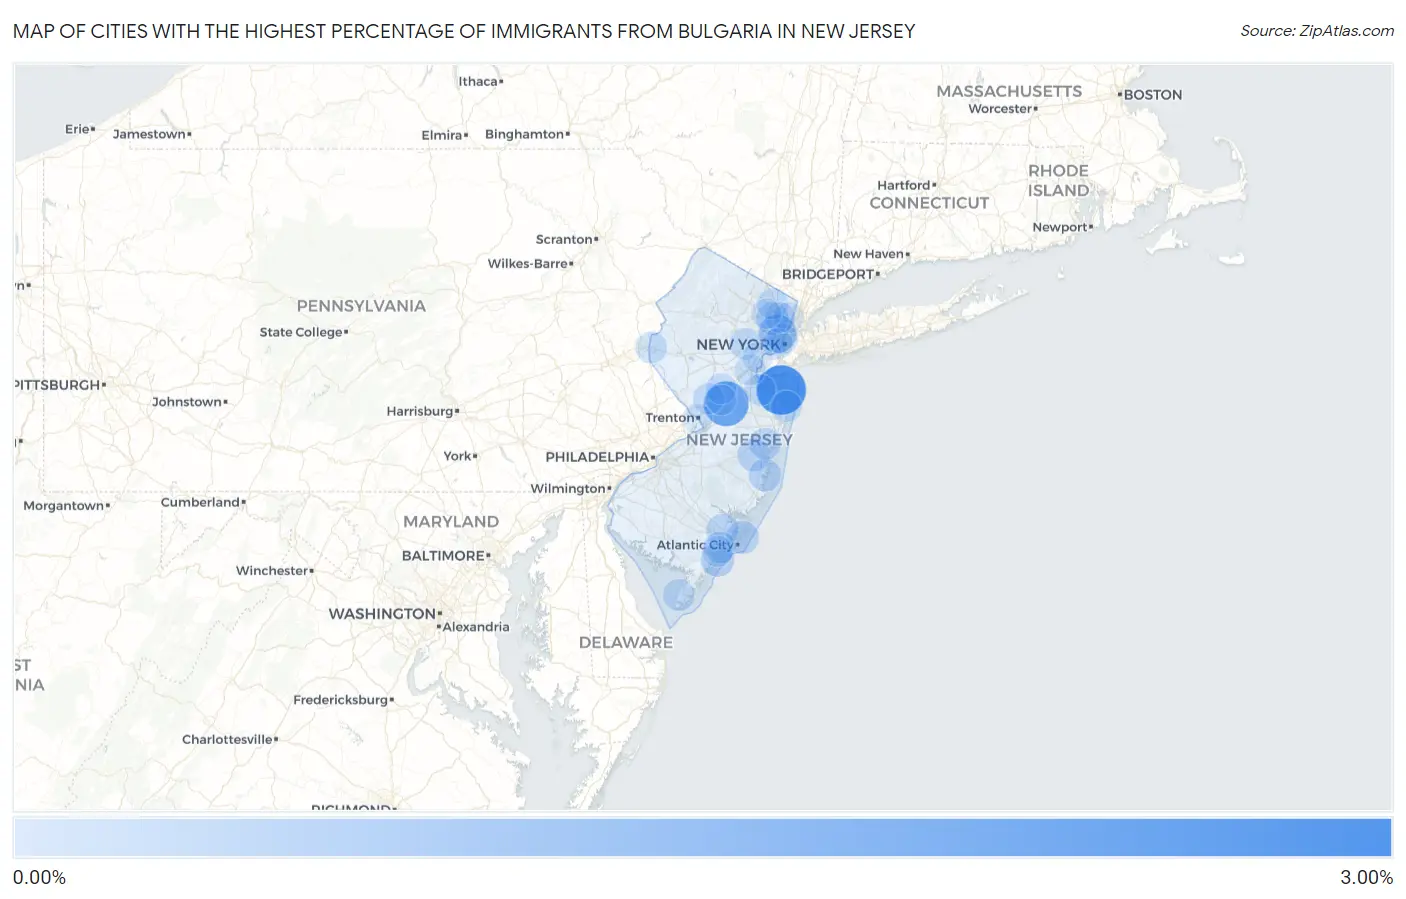
Cities with the Highest Percentage of Immigrants from Bulgaria in New Jersey
| City | Bulgaria | vs State | vs National | |
| 1. | Navesink | 2.84% | 0.035%(+2.80)#1 | 0.022%(+2.81)#8 |
| 2. | Cranbury | 2.14% | 0.035%(+2.10)#2 | 0.022%(+2.12)#18 |
| 3. | Matawan Borough | 1.58% | 0.035%(+1.55)#3 | 0.022%(+1.56)#26 |
| 4. | Secaucus | 1.12% | 0.035%(+1.09)#4 | 0.022%(+1.10)#50 |
| 5. | Stanhope Borough | 0.91% | 0.035%(+0.871)#5 | 0.022%(+0.883)#61 |
| 6. | Red Bank Borough | 0.65% | 0.035%(+0.610)#6 | 0.022%(+0.623)#97 |
| 7. | Pompton Lakes Borough | 0.47% | 0.035%(+0.435)#7 | 0.022%(+0.448)#136 |
| 8. | Milltown Borough | 0.47% | 0.035%(+0.435)#8 | 0.022%(+0.448)#137 |
| 9. | Ocean City | 0.46% | 0.035%(+0.427)#9 | 0.022%(+0.439)#140 |
| 10. | Brigantine | 0.40% | 0.035%(+0.363)#10 | 0.022%(+0.376)#167 |
| 11. | Millington | 0.37% | 0.035%(+0.339)#11 | 0.022%(+0.352)#174 |
| 12. | Holiday City Berkeley | 0.36% | 0.035%(+0.321)#12 | 0.022%(+0.334)#181 |
| 13. | Garfield | 0.35% | 0.035%(+0.316)#13 | 0.022%(+0.329)#186 |
| 14. | Forked River | 0.34% | 0.035%(+0.305)#14 | 0.022%(+0.317)#192 |
| 15. | Pomona | 0.32% | 0.035%(+0.280)#15 | 0.022%(+0.293)#208 |
| 16. | Bogota Borough | 0.28% | 0.035%(+0.245)#16 | 0.022%(+0.257)#237 |
| 17. | Old Tappan Borough | 0.26% | 0.035%(+0.221)#17 | 0.022%(+0.233)#260 |
| 18. | Linwood | 0.24% | 0.035%(+0.209)#18 | 0.022%(+0.222)#268 |
| 19. | Dumont Borough | 0.24% | 0.035%(+0.209)#19 | 0.022%(+0.222)#270 |
| 20. | Villas | 0.24% | 0.035%(+0.207)#20 | 0.022%(+0.219)#275 |
| 21. | Roselle Park Borough | 0.23% | 0.035%(+0.194)#21 | 0.022%(+0.207)#287 |
| 22. | Leisure Village | 0.22% | 0.035%(+0.186)#22 | 0.022%(+0.199)#295 |
| 23. | Phillipsburg | 0.20% | 0.035%(+0.169)#23 | 0.022%(+0.181)#311 |
| 24. | Strathmore | 0.20% | 0.035%(+0.168)#24 | 0.022%(+0.180)#314 |
| 25. | East Rutherford Borough | 0.18% | 0.035%(+0.145)#25 | 0.022%(+0.157)#357 |
| 26. | Ridgewood | 0.17% | 0.035%(+0.138)#26 | 0.022%(+0.150)#374 |
| 27. | Summit | 0.17% | 0.035%(+0.133)#27 | 0.022%(+0.146)#378 |
| 28. | South River Borough | 0.17% | 0.035%(+0.133)#28 | 0.022%(+0.145)#381 |
| 29. | Long Branch | 0.17% | 0.035%(+0.131)#29 | 0.022%(+0.144)#383 |
| 30. | Lake Hopatcong | 0.16% | 0.035%(+0.127)#30 | 0.022%(+0.140)#389 |
| 31. | Atlantic Highlands Borough | 0.16% | 0.035%(+0.124)#31 | 0.022%(+0.136)#393 |
| 32. | Fair Lawn Borough | 0.15% | 0.035%(+0.119)#32 | 0.022%(+0.132)#404 |
| 33. | New Providence Borough | 0.15% | 0.035%(+0.119)#33 | 0.022%(+0.132)#405 |
| 34. | Princeton | 0.14% | 0.035%(+0.109)#34 | 0.022%(+0.122)#421 |
| 35. | Tenafly Borough | 0.13% | 0.035%(+0.096)#35 | 0.022%(+0.108)#451 |
| 36. | Fort Lee Borough | 0.12% | 0.035%(+0.080)#36 | 0.022%(+0.093)#485 |
| 37. | Ramsey Borough | 0.11% | 0.035%(+0.073)#37 | 0.022%(+0.086)#502 |
| 38. | Somers Point | 0.10% | 0.035%(+0.070)#38 | 0.022%(+0.082)#516 |
| 39. | Kendall Park | 0.10% | 0.035%(+0.068)#39 | 0.022%(+0.081)#520 |
| 40. | Hoboken | 0.095% | 0.035%(+0.060)#40 | 0.022%(+0.073)#546 |
| 41. | Fords | 0.095% | 0.035%(+0.060)#41 | 0.022%(+0.072)#548 |
| 42. | South Plainfield Borough | 0.091% | 0.035%(+0.056)#42 | 0.022%(+0.068)#557 |
| 43. | Belmar Borough | 0.085% | 0.035%(+0.050)#43 | 0.022%(+0.063)#575 |
| 44. | Jersey City | 0.075% | 0.035%(+0.040)#44 | 0.022%(+0.052)#615 |
| 45. | Metuchen Borough | 0.074% | 0.035%(+0.038)#45 | 0.022%(+0.051)#621 |
| 46. | Wanaque Borough | 0.071% | 0.035%(+0.036)#46 | 0.022%(+0.049)#635 |
| 47. | River Edge Borough | 0.067% | 0.035%(+0.031)#47 | 0.022%(+0.044)#657 |
| 48. | Englewood | 0.065% | 0.035%(+0.030)#48 | 0.022%(+0.043)#665 |
| 49. | Princeton Meadows | 0.058% | 0.035%(+0.023)#49 | 0.022%(+0.035)#703 |
| 50. | Hackensack | 0.048% | 0.035%(+0.013)#50 | 0.022%(+0.026)#761 |
| 51. | Elmwood Park Borough | 0.047% | 0.035%(+0.012)#51 | 0.022%(+0.025)#769 |
| 52. | Paramus Borough | 0.038% | 0.035%(+0.002)#52 | 0.022%(+0.015)#826 |
| 53. | Parsippany | 0.032% | 0.035%(-0.003)#53 | 0.022%(+0.010)#873 |
| 54. | Linden | 0.023% | 0.035%(-0.012)#54 | 0.022%(+0.001)#942 |
| 55. | Trenton | 0.0100% | 0.035%(-0.025)#55 | 0.022%(-0.012)#1,075 |
| 56. | Paterson | 0.00063% | 0.035%(-0.034)#56 | 0.022%(-0.022)#1,167 |
Common Questions
What are the Top 10 Cities with the Highest Percentage of Immigrants from Bulgaria in New Jersey?
Top 10 Cities with the Highest Percentage of Immigrants from Bulgaria in New Jersey are:
#1
2.84%
#2
2.14%
#3
1.12%
#4
0.46%
#5
0.40%
#6
0.36%
#7
0.35%
#8
0.34%
#9
0.32%
#10
0.24%
What city has the Highest Percentage of Immigrants from Bulgaria in New Jersey?
Navesink has the Highest Percentage of Immigrants from Bulgaria in New Jersey with 2.84%.
What is the Percentage of Immigrants from Bulgaria in the State of New Jersey?
Percentage of Immigrants from Bulgaria in New Jersey is 0.035%.
What is the Percentage of Immigrants from Bulgaria in the United States?
Percentage of Immigrants from Bulgaria in the United States is 0.022%.