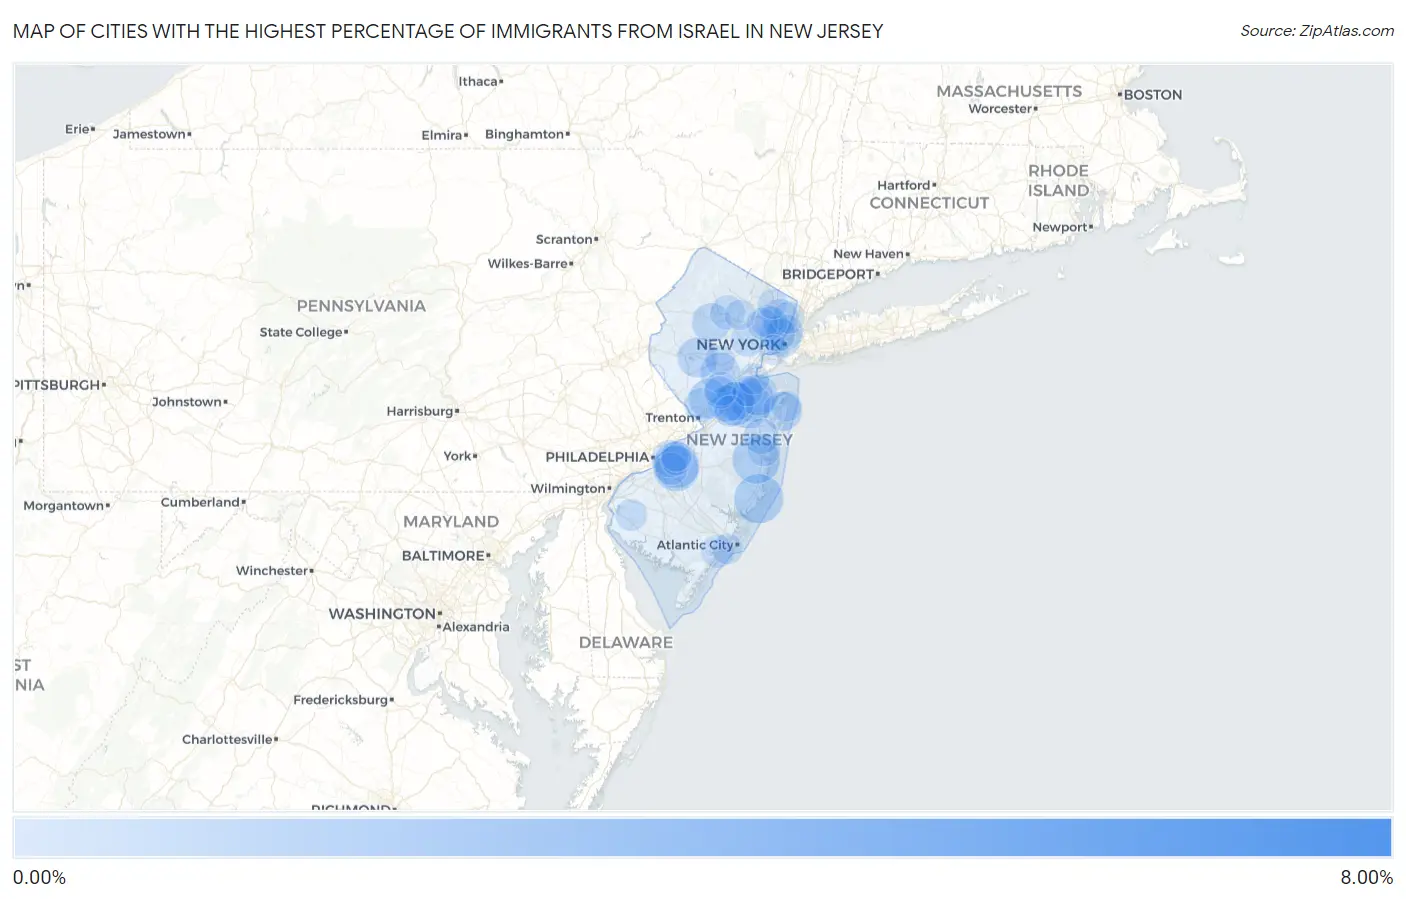
Cities with the Highest Percentage of Immigrants from Israel in New Jersey
RELATED REPORTS & OPTIONS
Israel
New Jersey
Compare Cities
Map of Cities with the Highest Percentage of Immigrants from Israel in New Jersey
0.00%
8.00%
Cities with the Highest Percentage of Immigrants from Israel in New Jersey
| City | Israel | vs State | vs National | |
| 1. | Demarest Borough | 6.96% | 0.12%(+6.84)#-1 | 0.042%(+6.92)#0 |
| 2. | Cresskill Borough | 6.49% | 0.12%(+6.37)#0 | 0.042%(+6.45)#1 |
| 3. | Tenafly Borough | 3.23% | 0.12%(+3.11)#1 | 0.042%(+3.19)#2 |
| 4. | Deal Borough | 2.33% | 0.12%(+2.21)#2 | 0.042%(+2.28)#3 |
| 5. | Rockleigh Borough | 2.12% | 0.12%(+2.00)#3 | 0.042%(+2.07)#4 |
| 6. | Englewood Cliffs Borough | 1.98% | 0.12%(+1.86)#4 | 0.042%(+1.94)#5 |
| 7. | Renaissance At Monroe | 1.88% | 0.12%(+1.76)#5 | 0.042%(+1.84)#6 |
| 8. | Pleasantdale | 1.83% | 0.12%(+1.71)#6 | 0.042%(+1.79)#7 |
| 9. | Fair Lawn Borough | 1.81% | 0.12%(+1.70)#8 | 0.042%(+1.77)#200 |
| 10. | Closter Borough | 1.61% | 0.12%(+1.49)#9 | 0.042%(+1.57)#201 |
| 11. | Clearbrook | 1.61% | 0.12%(+1.49)#10 | 0.042%(+1.57)#202 |
| 12. | Alpine Borough | 1.31% | 0.12%(+1.19)#11 | 0.042%(+1.27)#203 |
| 13. | Beach Haven West | 1.28% | 0.12%(+1.16)#12 | 0.042%(+1.24)#204 |
| 14. | Holiday Heights | 1.17% | 0.12%(+1.05)#13 | 0.042%(+1.13)#205 |
| 15. | Yorketown | 1.08% | 0.12%(+0.964)#14 | 0.042%(+1.04)#206 |
| 16. | Greentree | 1.08% | 0.12%(+0.962)#15 | 0.042%(+1.04)#207 |
| 17. | Springdale | 1.03% | 0.12%(+0.911)#16 | 0.042%(+0.988)#208 |
| 18. | Robertsville | 0.96% | 0.12%(+0.838)#17 | 0.042%(+0.915)#209 |
| 19. | Concordia | 0.92% | 0.12%(+0.804)#18 | 0.042%(+0.881)#210 |
| 20. | Harvey Cedars Borough | 0.84% | 0.12%(+0.716)#19 | 0.042%(+0.793)#211 |
| 21. | Norwood Borough | 0.81% | 0.12%(+0.694)#20 | 0.042%(+0.771)#212 |
| 22. | Morganville | 0.76% | 0.12%(+0.638)#21 | 0.042%(+0.715)#213 |
| 23. | White House Station | 0.71% | 0.12%(+0.594)#22 | 0.042%(+0.671)#214 |
| 24. | Hopewell Borough | 0.71% | 0.12%(+0.594)#23 | 0.042%(+0.670)#215 |
| 25. | Weston | 0.70% | 0.12%(+0.581)#24 | 0.042%(+0.658)#216 |
| 26. | Princeton | 0.70% | 0.12%(+0.578)#25 | 0.042%(+0.654)#217 |
| 27. | Oakhurst | 0.64% | 0.12%(+0.520)#26 | 0.042%(+0.597)#218 |
| 28. | Paramus Borough | 0.64% | 0.12%(+0.517)#27 | 0.042%(+0.594)#219 |
| 29. | Stanhope Borough | 0.62% | 0.12%(+0.504)#28 | 0.042%(+0.581)#220 |
| 30. | Succasunna | 0.62% | 0.12%(+0.502)#29 | 0.042%(+0.578)#221 |
| 31. | Whittingham | 0.62% | 0.12%(+0.500)#30 | 0.042%(+0.577)#222 |
| 32. | Leonia Borough | 0.54% | 0.12%(+0.421)#31 | 0.042%(+0.497)#223 |
| 33. | Hoboken | 0.54% | 0.12%(+0.419)#32 | 0.042%(+0.496)#224 |
| 34. | Hackensack | 0.51% | 0.12%(+0.395)#33 | 0.042%(+0.472)#225 |
| 35. | Cherry Hill Mall | 0.51% | 0.12%(+0.394)#34 | 0.042%(+0.471)#226 |
| 36. | Cranbury | 0.49% | 0.12%(+0.375)#35 | 0.042%(+0.452)#227 |
| 37. | Keyport Borough | 0.49% | 0.12%(+0.368)#36 | 0.042%(+0.445)#228 |
| 38. | Guttenberg | 0.48% | 0.12%(+0.357)#37 | 0.042%(+0.434)#229 |
| 39. | Fort Lee Borough | 0.44% | 0.12%(+0.321)#38 | 0.042%(+0.398)#230 |
| 40. | Robbinsville Center | 0.43% | 0.12%(+0.314)#39 | 0.042%(+0.391)#231 |
| 41. | Freehold Borough | 0.43% | 0.12%(+0.313)#40 | 0.042%(+0.390)#232 |
| 42. | Secaucus | 0.42% | 0.12%(+0.301)#41 | 0.042%(+0.377)#233 |
| 43. | Oradell Borough | 0.41% | 0.12%(+0.296)#42 | 0.042%(+0.372)#234 |
| 44. | Lakewood | 0.41% | 0.12%(+0.290)#43 | 0.042%(+0.366)#235 |
| 45. | Edgewater Borough | 0.40% | 0.12%(+0.284)#44 | 0.042%(+0.361)#236 |
| 46. | Hewitt | 0.39% | 0.12%(+0.275)#45 | 0.042%(+0.352)#237 |
| 47. | Park Ridge Borough | 0.38% | 0.12%(+0.266)#46 | 0.042%(+0.343)#238 |
| 48. | Rocky Hill Borough | 0.38% | 0.12%(+0.259)#47 | 0.042%(+0.336)#239 |
| 49. | Milltown Borough | 0.37% | 0.12%(+0.252)#48 | 0.042%(+0.329)#240 |
| 50. | White Meadow Lake | 0.37% | 0.12%(+0.250)#49 | 0.042%(+0.327)#241 |
| 51. | Lawrenceville | 0.35% | 0.12%(+0.227)#50 | 0.042%(+0.304)#242 |
| 52. | Kendall Park | 0.33% | 0.12%(+0.211)#51 | 0.042%(+0.287)#243 |
| 53. | Garwood Borough | 0.31% | 0.12%(+0.190)#52 | 0.042%(+0.266)#244 |
| 54. | Short Hills | 0.30% | 0.12%(+0.179)#53 | 0.042%(+0.256)#245 |
| 55. | Woodcliff Lake Borough | 0.30% | 0.12%(+0.177)#54 | 0.042%(+0.253)#246 |
| 56. | Franklin Lakes Borough | 0.29% | 0.12%(+0.172)#55 | 0.042%(+0.249)#247 |
| 57. | Fair Haven Borough | 0.29% | 0.12%(+0.171)#56 | 0.042%(+0.247)#248 |
| 58. | Beach Haven Borough | 0.28% | 0.12%(+0.164)#57 | 0.042%(+0.241)#249 |
| 59. | Kinnelon Borough | 0.28% | 0.12%(+0.162)#58 | 0.042%(+0.238)#250 |
| 60. | Somers Point | 0.28% | 0.12%(+0.158)#59 | 0.042%(+0.235)#251 |
| 61. | Bergenfield Borough | 0.28% | 0.12%(+0.158)#60 | 0.042%(+0.234)#252 |
| 62. | Rutherford Borough | 0.27% | 0.12%(+0.153)#61 | 0.042%(+0.230)#253 |
| 63. | Clifton | 0.26% | 0.12%(+0.142)#62 | 0.042%(+0.218)#254 |
| 64. | Toms River | 0.26% | 0.12%(+0.139)#63 | 0.042%(+0.215)#306 |
| 65. | Eatontown Borough | 0.25% | 0.12%(+0.133)#64 | 0.042%(+0.209)#307 |
| 66. | Lodi Borough | 0.25% | 0.12%(+0.128)#65 | 0.042%(+0.204)#308 |
| 67. | Ringwood Borough | 0.24% | 0.12%(+0.121)#66 | 0.042%(+0.197)#309 |
| 68. | Heathcote | 0.24% | 0.12%(+0.118)#67 | 0.042%(+0.194)#310 |
| 69. | Highland Park Borough | 0.23% | 0.12%(+0.115)#68 | 0.042%(+0.191)#311 |
| 70. | Oakland Borough | 0.23% | 0.12%(+0.109)#69 | 0.042%(+0.186)#312 |
| 71. | Englewood | 0.23% | 0.12%(+0.108)#70 | 0.042%(+0.185)#313 |
| 72. | Passaic | 0.22% | 0.12%(+0.105)#71 | 0.042%(+0.182)#314 |
| 73. | Old Tappan Borough | 0.22% | 0.12%(+0.103)#72 | 0.042%(+0.180)#315 |
| 74. | Glen Rock Borough | 0.22% | 0.12%(+0.096)#73 | 0.042%(+0.173)#316 |
| 75. | Ashland | 0.21% | 0.12%(+0.094)#74 | 0.042%(+0.171)#317 |
| 76. | Alloway | 0.21% | 0.12%(+0.091)#75 | 0.042%(+0.168)#318 |
| 77. | Gibbsboro Borough | 0.18% | 0.12%(+0.057)#76 | 0.042%(+0.134)#319 |
| 78. | Twin Rivers | 0.17% | 0.12%(+0.053)#77 | 0.042%(+0.130)#320 |
| 79. | Waldwick Borough | 0.17% | 0.12%(+0.050)#78 | 0.042%(+0.127)#321 |
| 80. | Upper Montclair | 0.17% | 0.12%(+0.050)#79 | 0.042%(+0.127)#322 |
| 81. | North Caldwell Borough | 0.17% | 0.12%(+0.047)#80 | 0.042%(+0.124)#323 |
| 82. | South Amboy | 0.16% | 0.12%(+0.042)#81 | 0.042%(+0.119)#324 |
| 83. | Haddonfield Borough | 0.16% | 0.12%(+0.042)#82 | 0.042%(+0.119)#325 |
| 84. | North Haledon Borough | 0.16% | 0.12%(+0.040)#83 | 0.042%(+0.117)#326 |
| 85. | Bogota Borough | 0.15% | 0.12%(+0.027)#84 | 0.042%(+0.103)#327 |
| 86. | Long Branch | 0.14% | 0.12%(+0.025)#85 | 0.042%(+0.102)#328 |
| 87. | Wallington Borough | 0.14% | 0.12%(+0.025)#86 | 0.042%(+0.102)#329 |
| 88. | Margate City | 0.13% | 0.12%(+0.013)#87 | 0.042%(+0.089)#330 |
| 89. | Watsessing | 0.13% | 0.12%(+0.011)#88 | 0.042%(+0.088)#331 |
| 90. | Ramblewood | 0.13% | 0.12%(+0.008)#89 | 0.042%(+0.085)#332 |
| 91. | Moorestown Lenola | 0.13% | 0.12%(+0.007)#90 | 0.042%(+0.083)#333 |
| 92. | Haworth Borough | 0.12% | 0.12%(+0.001)#91 | 0.042%(+0.078)#334 |
| 93. | Boonton | 0.11% | 0.12%(-0.005)#92 | 0.042%(+0.072)#335 |
| 94. | Caldwell Borough | 0.11% | 0.12%(-0.006)#93 | 0.042%(+0.070)#336 |
| 95. | New Milford Borough | 0.11% | 0.12%(-0.012)#94 | 0.042%(+0.065)#337 |
| 96. | Bayonne | 0.10% | 0.12%(-0.014)#95 | 0.042%(+0.063)#338 |
| 97. | Ridgewood | 0.10% | 0.12%(-0.015)#96 | 0.042%(+0.062)#339 |
| 98. | Florham Park Borough | 0.10% | 0.12%(-0.017)#97 | 0.042%(+0.060)#340 |
| 99. | Martinsville | 0.097% | 0.12%(-0.022)#98 | 0.042%(+0.055)#341 |
| 100. | Old Bridge | 0.093% | 0.12%(-0.026)#99 | 0.042%(+0.051)#342 |
Common Questions
What are the Top 10 Cities with the Highest Percentage of Immigrants from Israel in New Jersey?
Top 10 Cities with the Highest Percentage of Immigrants from Israel in New Jersey are:
#1
1.28%
#2
1.17%
#3
1.08%
#4
1.08%
#5
1.03%
#6
0.96%
#7
0.92%
#8
0.76%
#9
0.71%
#10
0.70%
What city has the Highest Percentage of Immigrants from Israel in New Jersey?
Beach Haven West has the Highest Percentage of Immigrants from Israel in New Jersey with 1.28%.
What is the Percentage of Immigrants from Israel in the State of New Jersey?
Percentage of Immigrants from Israel in New Jersey is 0.12%.
What is the Percentage of Immigrants from Israel in the United States?
Percentage of Immigrants from Israel in the United States is 0.042%.