Cities with the Highest Percentage of Brazilian Population in New Jersey
RELATED REPORTS & OPTIONS
Brazilian
New Jersey
Compare Cities
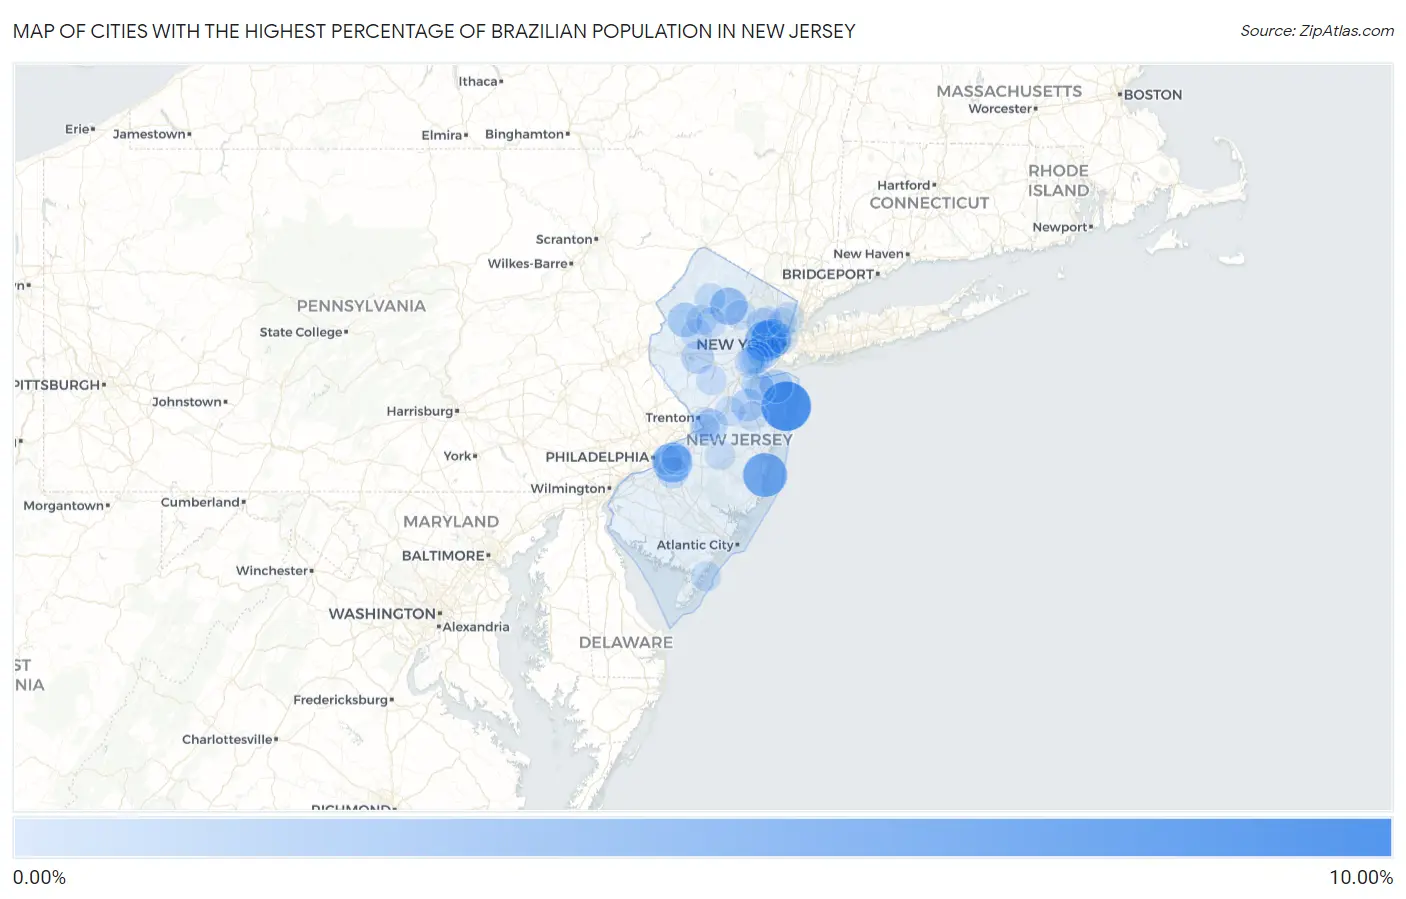
Map of Cities with the Highest Percentage of Brazilian Population in New Jersey
0.00%
10.00%
Cities with the Highest Percentage of Brazilian Population in New Jersey
| City | Brazilian | vs State | vs National | |
| 1. | Long Branch | 8.96% | 0.51%(+8.45)#1 | 0.15%(+8.81)#15 |
| 2. | Forked River | 6.40% | 0.51%(+5.89)#2 | 0.15%(+6.24)#28 |
| 3. | Newark | 4.79% | 0.51%(+4.29)#3 | 0.15%(+4.64)#41 |
| 4. | Kingston Estates | 4.67% | 0.51%(+4.17)#4 | 0.15%(+4.52)#42 |
| 5. | Kearny | 4.49% | 0.51%(+3.98)#5 | 0.15%(+4.33)#47 |
| 6. | Union | 4.44% | 0.51%(+3.93)#6 | 0.15%(+4.28)#49 |
| 7. | Lake Telemark | 3.54% | 0.51%(+3.03)#7 | 0.15%(+3.38)#73 |
| 8. | Ampere North | 3.41% | 0.51%(+2.90)#8 | 0.15%(+3.25)#77 |
| 9. | Harrison | 3.17% | 0.51%(+2.66)#9 | 0.15%(+3.02)#83 |
| 10. | East Newark Borough | 2.94% | 0.51%(+2.44)#10 | 0.15%(+2.79)#90 |
| 11. | Cliffside Park Borough | 2.85% | 0.51%(+2.34)#11 | 0.15%(+2.69)#96 |
| 12. | Mount Hope | 2.81% | 0.51%(+2.31)#12 | 0.15%(+2.66)#98 |
| 13. | Springfield | 2.81% | 0.51%(+2.30)#13 | 0.15%(+2.65)#99 |
| 14. | North Arlington Borough | 2.65% | 0.51%(+2.15)#14 | 0.15%(+2.50)#105 |
| 15. | Vienna | 2.35% | 0.51%(+1.84)#15 | 0.15%(+2.20)#129 |
| 16. | Kenilworth Borough | 2.34% | 0.51%(+1.83)#16 | 0.15%(+2.18)#131 |
| 17. | Hewitt | 2.28% | 0.51%(+1.78)#17 | 0.15%(+2.13)#133 |
| 18. | Elizabeth | 2.17% | 0.51%(+1.67)#18 | 0.15%(+2.02)#144 |
| 19. | Towaco | 2.05% | 0.51%(+1.55)#19 | 0.15%(+1.90)#159 |
| 20. | Roselle Park Borough | 1.88% | 0.51%(+1.38)#20 | 0.15%(+1.73)#168 |
| 21. | South River Borough | 1.83% | 0.51%(+1.32)#21 | 0.15%(+1.67)#175 |
| 22. | Garwood Borough | 1.78% | 0.51%(+1.28)#22 | 0.15%(+1.63)#180 |
| 23. | West Long Branch Borough | 1.77% | 0.51%(+1.26)#23 | 0.15%(+1.61)#184 |
| 24. | Belford | 1.76% | 0.51%(+1.25)#24 | 0.15%(+1.60)#185 |
| 25. | Raritan Borough | 1.61% | 0.51%(+1.11)#25 | 0.15%(+1.46)#203 |
| 26. | Jamesburg Borough | 1.54% | 0.51%(+1.03)#26 | 0.15%(+1.39)#218 |
| 27. | White House Station | 1.53% | 0.51%(+1.02)#27 | 0.15%(+1.38)#220 |
| 28. | Yorketown | 1.47% | 0.51%(+0.964)#28 | 0.15%(+1.32)#233 |
| 29. | Upper Greenwood Lake | 1.43% | 0.51%(+0.927)#29 | 0.15%(+1.28)#242 |
| 30. | Groveville | 1.41% | 0.51%(+0.903)#30 | 0.15%(+1.26)#248 |
| 31. | Roselle Borough | 1.38% | 0.51%(+0.871)#31 | 0.15%(+1.22)#255 |
| 32. | Ringwood Borough | 1.29% | 0.51%(+0.785)#32 | 0.15%(+1.14)#281 |
| 33. | Spotswood Borough | 1.27% | 0.51%(+0.759)#33 | 0.15%(+1.11)#290 |
| 34. | South Toms River Borough | 1.26% | 0.51%(+0.750)#34 | 0.15%(+1.10)#294 |
| 35. | Norwood Borough | 1.26% | 0.51%(+0.748)#35 | 0.15%(+1.10)#296 |
| 36. | Liberty Corner | 1.25% | 0.51%(+0.744)#36 | 0.15%(+1.10)#297 |
| 37. | Sayreville Borough | 1.22% | 0.51%(+0.710)#37 | 0.15%(+1.06)#306 |
| 38. | Edgewater Borough | 1.21% | 0.51%(+0.702)#38 | 0.15%(+1.05)#307 |
| 39. | Packanack Lake | 1.20% | 0.51%(+0.697)#39 | 0.15%(+1.05)#312 |
| 40. | Menlo Park Terrace | 1.19% | 0.51%(+0.680)#40 | 0.15%(+1.03)#317 |
| 41. | Linden | 1.15% | 0.51%(+0.646)#41 | 0.15%(+0.998)#334 |
| 42. | Totowa Borough | 1.15% | 0.51%(+0.641)#42 | 0.15%(+0.994)#337 |
| 43. | Echelon | 1.14% | 0.51%(+0.630)#43 | 0.15%(+0.982)#341 |
| 44. | Upper Montclair | 1.08% | 0.51%(+0.570)#44 | 0.15%(+0.923)#364 |
| 45. | Laurence Harbor | 1.06% | 0.51%(+0.553)#45 | 0.15%(+0.906)#372 |
| 46. | Rockaway Borough | 1.05% | 0.51%(+0.541)#46 | 0.15%(+0.893)#377 |
| 47. | Allendale Borough | 1.03% | 0.51%(+0.520)#47 | 0.15%(+0.873)#392 |
| 48. | Highlands Borough | 1.01% | 0.51%(+0.505)#48 | 0.15%(+0.858)#401 |
| 49. | River Edge Borough | 0.99% | 0.51%(+0.483)#49 | 0.15%(+0.836)#409 |
| 50. | Englewood | 0.97% | 0.51%(+0.459)#50 | 0.15%(+0.811)#418 |
| 51. | Hampton Borough | 0.85% | 0.51%(+0.339)#51 | 0.15%(+0.692)#475 |
| 52. | Rahway | 0.83% | 0.51%(+0.319)#52 | 0.15%(+0.672)#485 |
| 53. | Ramapo College Of New Jersey | 0.80% | 0.51%(+0.296)#53 | 0.15%(+0.649)#497 |
| 54. | Hillsdale Borough | 0.77% | 0.51%(+0.264)#54 | 0.15%(+0.617)#519 |
| 55. | Lake Mohawk | 0.76% | 0.51%(+0.256)#55 | 0.15%(+0.609)#525 |
| 56. | Long Valley | 0.73% | 0.51%(+0.227)#56 | 0.15%(+0.579)#545 |
| 57. | Troy Hills | 0.73% | 0.51%(+0.223)#57 | 0.15%(+0.576)#549 |
| 58. | Thorofare | 0.71% | 0.51%(+0.205)#58 | 0.15%(+0.558)#562 |
| 59. | Mount Ephraim Borough | 0.69% | 0.51%(+0.183)#59 | 0.15%(+0.536)#581 |
| 60. | Watsessing | 0.67% | 0.51%(+0.167)#60 | 0.15%(+0.520)#595 |
| 61. | Hoboken | 0.66% | 0.51%(+0.150)#61 | 0.15%(+0.503)#617 |
| 62. | Golden Triangle | 0.65% | 0.51%(+0.139)#62 | 0.15%(+0.491)#631 |
| 63. | Milford Borough | 0.64% | 0.51%(+0.136)#63 | 0.15%(+0.489)#635 |
| 64. | Milltown Borough | 0.63% | 0.51%(+0.120)#64 | 0.15%(+0.473)#645 |
| 65. | Port Morris | 0.63% | 0.51%(+0.120)#65 | 0.15%(+0.473)#646 |
| 66. | Budd Lake | 0.62% | 0.51%(+0.114)#66 | 0.15%(+0.467)#653 |
| 67. | Colonia | 0.62% | 0.51%(+0.112)#67 | 0.15%(+0.465)#656 |
| 68. | Fairview Borough | 0.62% | 0.51%(+0.109)#68 | 0.15%(+0.462)#662 |
| 69. | Midland Park Borough | 0.61% | 0.51%(+0.106)#69 | 0.15%(+0.459)#667 |
| 70. | Newfield Borough | 0.60% | 0.51%(+0.094)#70 | 0.15%(+0.447)#680 |
| 71. | White Horse | 0.60% | 0.51%(+0.092)#71 | 0.15%(+0.445)#683 |
| 72. | Belle Mead | 0.60% | 0.51%(+0.090)#72 | 0.15%(+0.443)#684 |
| 73. | The College Of New Jersey | 0.58% | 0.51%(+0.075)#73 | 0.15%(+0.428)#701 |
| 74. | Succasunna | 0.58% | 0.51%(+0.073)#74 | 0.15%(+0.426)#705 |
| 75. | Cranford | 0.58% | 0.51%(+0.072)#75 | 0.15%(+0.425)#706 |
| 76. | Strathmore | 0.56% | 0.51%(+0.058)#76 | 0.15%(+0.411)#721 |
| 77. | Moorestown Lenola | 0.56% | 0.51%(+0.057)#77 | 0.15%(+0.409)#723 |
| 78. | Kinnelon Borough | 0.54% | 0.51%(+0.034)#78 | 0.15%(+0.387)#746 |
| 79. | West Freehold | 0.53% | 0.51%(+0.026)#79 | 0.15%(+0.379)#753 |
| 80. | Helmetta Borough | 0.52% | 0.51%(+0.015)#80 | 0.15%(+0.367)#772 |
| 81. | Browns Mills | 0.52% | 0.51%(+0.010)#81 | 0.15%(+0.363)#780 |
| 82. | Lincoln Park Borough | 0.51% | 0.51%(-0.001)#82 | 0.15%(+0.351)#793 |
| 83. | Twin Rivers | 0.50% | 0.51%(-0.003)#83 | 0.15%(+0.350)#798 |
| 84. | Boonton | 0.50% | 0.51%(-0.006)#84 | 0.15%(+0.347)#802 |
| 85. | Cookstown | 0.49% | 0.51%(-0.014)#85 | 0.15%(+0.339)#814 |
| 86. | Sea Isle City | 0.49% | 0.51%(-0.018)#86 | 0.15%(+0.335)#824 |
| 87. | Moonachie Borough | 0.48% | 0.51%(-0.022)#87 | 0.15%(+0.331)#829 |
| 88. | Stockton University | 0.46% | 0.51%(-0.048)#88 | 0.15%(+0.305)#869 |
| 89. | Clifton | 0.44% | 0.51%(-0.065)#89 | 0.15%(+0.288)#890 |
| 90. | Fort Lee Borough | 0.44% | 0.51%(-0.067)#90 | 0.15%(+0.286)#895 |
| 91. | Stratford Borough | 0.43% | 0.51%(-0.076)#91 | 0.15%(+0.277)#908 |
| 92. | New Milford Borough | 0.42% | 0.51%(-0.086)#92 | 0.15%(+0.267)#928 |
| 93. | Ridgefield Borough | 0.42% | 0.51%(-0.088)#93 | 0.15%(+0.265)#935 |
| 94. | Bordentown | 0.40% | 0.51%(-0.106)#94 | 0.15%(+0.247)#968 |
| 95. | East Rutherford Borough | 0.40% | 0.51%(-0.107)#95 | 0.15%(+0.245)#975 |
| 96. | Northvale Borough | 0.40% | 0.51%(-0.108)#96 | 0.15%(+0.245)#977 |
| 97. | Ramblewood | 0.40% | 0.51%(-0.111)#97 | 0.15%(+0.242)#987 |
| 98. | Glassboro Borough | 0.40% | 0.51%(-0.111)#98 | 0.15%(+0.242)#989 |
| 99. | Ridgefield Park | 0.40% | 0.51%(-0.112)#99 | 0.15%(+0.241)#990 |
| 100. | Audubon Park Borough | 0.39% | 0.51%(-0.119)#100 | 0.15%(+0.234)#1,005 |
Common Questions
What are the Top 10 Cities with the Highest Percentage of Brazilian Population in New Jersey?
Top 10 Cities with the Highest Percentage of Brazilian Population in New Jersey are:
#1
8.96%
#2
6.40%
#3
4.79%
#4
4.67%
#5
4.49%
#6
3.54%
#7
3.17%
#8
2.35%
#9
2.17%
#10
1.76%
What city has the Highest Percentage of Brazilian Population in New Jersey?
Long Branch has the Highest Percentage of Brazilian Population in New Jersey with 8.96%.
What is the Percentage of Brazilian Population in the State of New Jersey?
Percentage of Brazilian Population in New Jersey is 0.51%.
What is the Percentage of Brazilian Population in the United States?
Percentage of Brazilian Population in the United States is 0.15%.