Cities with the Highest Percentage of Korean Population in New Jersey
RELATED REPORTS & OPTIONS
Korean
New Jersey
Compare Cities
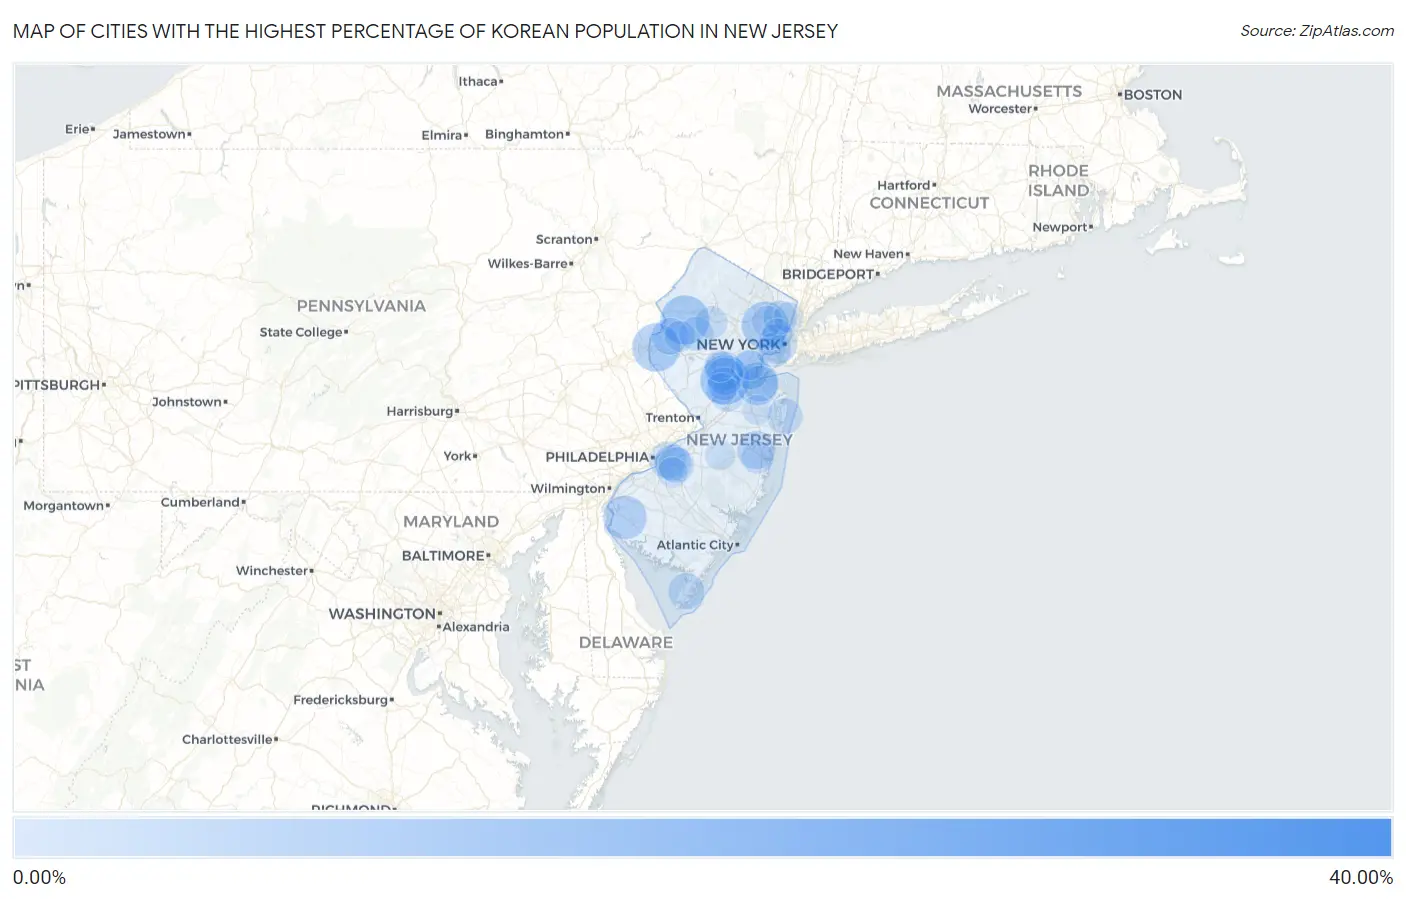
Map of Cities with the Highest Percentage of Korean Population in New Jersey
0.00%
40.00%
Cities with the Highest Percentage of Korean Population in New Jersey
| City | Korean | vs State | vs National | |
| 1. | Springfield | 31.35% | 1.62%(+29.7)#1 | 1.31%(+30.0)#61 |
| 2. | Connecticut Farms | 24.25% | 1.62%(+22.6)#2 | 1.31%(+22.9)#99 |
| 3. | Bergenfield Borough | 18.96% | 1.62%(+17.3)#3 | 1.31%(+17.6)#132 |
| 4. | Rainbow Lakes | 16.43% | 1.62%(+14.8)#4 | 1.31%(+15.1)#155 |
| 5. | Silver Lake Cdp Essex County | 11.89% | 1.62%(+10.3)#5 | 1.31%(+10.6)#223 |
| 6. | New Milford Borough | 11.49% | 1.62%(+9.87)#6 | 1.31%(+10.2)#231 |
| 7. | Dumont Borough | 10.86% | 1.62%(+9.24)#7 | 1.31%(+9.55)#249 |
| 8. | Six Mile Run | 9.62% | 1.62%(+8.00)#8 | 1.31%(+8.31)#281 |
| 9. | Vienna | 9.53% | 1.62%(+7.91)#9 | 1.31%(+8.22)#283 |
| 10. | Greenwich | 9.18% | 1.62%(+7.55)#10 | 1.31%(+7.87)#296 |
| 11. | Brookdale | 8.74% | 1.62%(+7.11)#11 | 1.31%(+7.43)#318 |
| 12. | Raritan Borough | 8.11% | 1.62%(+6.48)#12 | 1.31%(+6.80)#355 |
| 13. | Quinton | 7.54% | 1.62%(+5.92)#13 | 1.31%(+6.23)#395 |
| 14. | William Paterson University Of New Jersey | 7.32% | 1.62%(+5.70)#14 | 1.31%(+6.01)#408 |
| 15. | Laurence Harbor | 7.20% | 1.62%(+5.58)#15 | 1.31%(+5.89)#419 |
| 16. | Nesco | 6.72% | 1.62%(+5.10)#16 | 1.31%(+5.41)#455 |
| 17. | Union | 6.52% | 1.62%(+4.90)#17 | 1.31%(+5.21)#474 |
| 18. | Medford Lakes Borough | 6.10% | 1.62%(+4.48)#18 | 1.31%(+4.79)#518 |
| 19. | Jersey City | 6.09% | 1.62%(+4.47)#19 | 1.31%(+4.78)#520 |
| 20. | Franklin Center | 6.00% | 1.62%(+4.38)#20 | 1.31%(+4.69)#532 |
| 21. | Maywood Borough | 5.93% | 1.62%(+4.30)#21 | 1.31%(+4.62)#546 |
| 22. | Lakehurst Borough | 5.92% | 1.62%(+4.30)#22 | 1.31%(+4.61)#547 |
| 23. | Menlo Park Terrace | 5.84% | 1.62%(+4.22)#23 | 1.31%(+4.53)#560 |
| 24. | Encore At Monroe | 5.82% | 1.62%(+4.20)#24 | 1.31%(+4.51)#563 |
| 25. | Hasbrouck Heights Borough | 5.76% | 1.62%(+4.14)#25 | 1.31%(+4.45)#570 |
| 26. | Fords | 5.68% | 1.62%(+4.06)#26 | 1.31%(+4.37)#581 |
| 27. | Englewood Cliffs Borough | 5.61% | 1.62%(+3.99)#27 | 1.31%(+4.30)#593 |
| 28. | Emerson Borough | 5.53% | 1.62%(+3.91)#28 | 1.31%(+4.22)#606 |
| 29. | Pine Lake Park | 5.53% | 1.62%(+3.91)#29 | 1.31%(+4.22)#609 |
| 30. | Bridgewater Center | 5.52% | 1.62%(+3.90)#30 | 1.31%(+4.21)#611 |
| 31. | Pompton Lakes Borough | 5.49% | 1.62%(+3.87)#31 | 1.31%(+4.18)#617 |
| 32. | Westwood Borough | 5.37% | 1.62%(+3.75)#32 | 1.31%(+4.06)#633 |
| 33. | Middlebush | 5.21% | 1.62%(+3.59)#33 | 1.31%(+3.90)#655 |
| 34. | Somerville Borough | 5.14% | 1.62%(+3.52)#34 | 1.31%(+3.83)#666 |
| 35. | Golden Triangle | 5.14% | 1.62%(+3.52)#35 | 1.31%(+3.83)#667 |
| 36. | Forsgate | 5.09% | 1.62%(+3.46)#36 | 1.31%(+3.78)#676 |
| 37. | Brass Castle | 5.03% | 1.62%(+3.41)#37 | 1.31%(+3.72)#691 |
| 38. | Little Ferry Borough | 4.97% | 1.62%(+3.34)#38 | 1.31%(+3.66)#706 |
| 39. | Kingston Estates | 4.84% | 1.62%(+3.22)#39 | 1.31%(+3.53)#728 |
| 40. | Whitesboro | 4.77% | 1.62%(+3.14)#40 | 1.31%(+3.46)#744 |
| 41. | Cliffwood Beach | 4.72% | 1.62%(+3.10)#41 | 1.31%(+3.41)#753 |
| 42. | Roseland Borough | 4.69% | 1.62%(+3.07)#42 | 1.31%(+3.38)#759 |
| 43. | Greentree | 4.57% | 1.62%(+2.94)#43 | 1.31%(+3.26)#786 |
| 44. | Loch Arbour | 4.55% | 1.62%(+2.92)#44 | 1.31%(+3.24)#788 |
| 45. | Bayonne | 4.29% | 1.62%(+2.67)#45 | 1.31%(+2.98)#839 |
| 46. | Bedminster | 4.26% | 1.62%(+2.63)#46 | 1.31%(+2.95)#851 |
| 47. | Laurel Springs Borough | 4.24% | 1.62%(+2.62)#47 | 1.31%(+2.93)#856 |
| 48. | Wharton Borough | 4.23% | 1.62%(+2.60)#48 | 1.31%(+2.92)#860 |
| 49. | Monroe Manor | 4.20% | 1.62%(+2.58)#49 | 1.31%(+2.89)#869 |
| 50. | Stirling | 4.14% | 1.62%(+2.52)#50 | 1.31%(+2.83)#884 |
| 51. | Englishtown Borough | 4.13% | 1.62%(+2.51)#51 | 1.31%(+2.82)#887 |
| 52. | Long Valley | 4.01% | 1.62%(+2.39)#52 | 1.31%(+2.70)#918 |
| 53. | Frenchtown Borough | 3.90% | 1.62%(+2.28)#53 | 1.31%(+2.59)#954 |
| 54. | Bogota Borough | 3.88% | 1.62%(+2.26)#54 | 1.31%(+2.57)#962 |
| 55. | Hackensack | 3.87% | 1.62%(+2.25)#55 | 1.31%(+2.56)#966 |
| 56. | Rutherford Borough | 3.76% | 1.62%(+2.14)#56 | 1.31%(+2.45)#1,007 |
| 57. | Cresskill Borough | 3.71% | 1.62%(+2.09)#57 | 1.31%(+2.40)#1,020 |
| 58. | Dayton | 3.70% | 1.62%(+2.07)#58 | 1.31%(+2.39)#1,027 |
| 59. | Paramus Borough | 3.68% | 1.62%(+2.05)#59 | 1.31%(+2.37)#1,033 |
| 60. | Lodi Borough | 3.65% | 1.62%(+2.03)#60 | 1.31%(+2.34)#1,041 |
| 61. | Franklin Park | 3.58% | 1.62%(+1.96)#61 | 1.31%(+2.27)#1,068 |
| 62. | Hillsborough | 3.57% | 1.62%(+1.94)#62 | 1.31%(+2.26)#1,076 |
| 63. | Newtonville | 3.53% | 1.62%(+1.91)#63 | 1.31%(+2.22)#1,095 |
| 64. | Old Tappan Borough | 3.51% | 1.62%(+1.89)#64 | 1.31%(+2.20)#1,101 |
| 65. | Succasunna | 3.46% | 1.62%(+1.83)#65 | 1.31%(+2.15)#1,121 |
| 66. | Magnolia Borough | 3.45% | 1.62%(+1.83)#66 | 1.31%(+2.14)#1,123 |
| 67. | Holiday City South | 3.45% | 1.62%(+1.82)#67 | 1.31%(+2.14)#1,126 |
| 68. | Eatontown Borough | 3.40% | 1.62%(+1.78)#68 | 1.31%(+2.09)#1,139 |
| 69. | Bay Head Borough | 3.38% | 1.62%(+1.75)#69 | 1.31%(+2.07)#1,153 |
| 70. | Alpha Borough | 3.37% | 1.62%(+1.75)#70 | 1.31%(+2.06)#1,157 |
| 71. | West Berlin | 3.31% | 1.62%(+1.69)#71 | 1.31%(+2.00)#1,184 |
| 72. | River Edge Borough | 3.14% | 1.62%(+1.51)#72 | 1.31%(+1.83)#1,256 |
| 73. | New Providence Borough | 3.09% | 1.62%(+1.47)#73 | 1.31%(+1.78)#1,286 |
| 74. | North Arlington Borough | 3.08% | 1.62%(+1.46)#74 | 1.31%(+1.77)#1,289 |
| 75. | Highland Park Borough | 3.08% | 1.62%(+1.46)#75 | 1.31%(+1.77)#1,290 |
| 76. | Kendall Park | 3.07% | 1.62%(+1.45)#76 | 1.31%(+1.76)#1,298 |
| 77. | Carteret Borough | 3.00% | 1.62%(+1.38)#77 | 1.31%(+1.69)#1,325 |
| 78. | Mckee | 2.95% | 1.62%(+1.33)#78 | 1.31%(+1.64)#1,359 |
| 79. | Clifton | 2.92% | 1.62%(+1.30)#79 | 1.31%(+1.61)#1,377 |
| 80. | Finderne | 2.91% | 1.62%(+1.28)#80 | 1.31%(+1.60)#1,386 |
| 81. | Wood Ridge Borough | 2.90% | 1.62%(+1.27)#81 | 1.31%(+1.59)#1,392 |
| 82. | Essex Fells Borough | 2.88% | 1.62%(+1.26)#82 | 1.31%(+1.57)#1,407 |
| 83. | Anderson | 2.86% | 1.62%(+1.24)#83 | 1.31%(+1.55)#1,419 |
| 84. | Regency At Monroe | 2.85% | 1.62%(+1.23)#84 | 1.31%(+1.54)#1,424 |
| 85. | Milltown Borough | 2.85% | 1.62%(+1.23)#85 | 1.31%(+1.54)#1,425 |
| 86. | High Bridge Borough | 2.83% | 1.62%(+1.21)#86 | 1.31%(+1.52)#1,436 |
| 87. | Hi Nella Borough | 2.83% | 1.62%(+1.21)#87 | 1.31%(+1.52)#1,438 |
| 88. | Keyport Borough | 2.82% | 1.62%(+1.20)#88 | 1.31%(+1.51)#1,443 |
| 89. | Shrewsbury Borough | 2.80% | 1.62%(+1.18)#89 | 1.31%(+1.49)#1,457 |
| 90. | Palermo | 2.80% | 1.62%(+1.18)#90 | 1.31%(+1.49)#1,458 |
| 91. | Northvale Borough | 2.73% | 1.62%(+1.10)#91 | 1.31%(+1.42)#1,504 |
| 92. | Englewood | 2.70% | 1.62%(+1.08)#92 | 1.31%(+1.39)#1,522 |
| 93. | Echelon | 2.69% | 1.62%(+1.07)#93 | 1.31%(+1.38)#1,533 |
| 94. | Secaucus | 2.63% | 1.62%(+1.00)#94 | 1.31%(+1.32)#1,570 |
| 95. | Browns Mills | 2.62% | 1.62%(+1.00)#95 | 1.31%(+1.31)#1,571 |
| 96. | Iselin | 2.59% | 1.62%(+0.965)#96 | 1.31%(+1.28)#1,596 |
| 97. | Elmwood Park Borough | 2.57% | 1.62%(+0.950)#97 | 1.31%(+1.26)#1,608 |
| 98. | East Freehold | 2.56% | 1.62%(+0.940)#98 | 1.31%(+1.25)#1,612 |
| 99. | Pleasantdale | 2.56% | 1.62%(+0.936)#99 | 1.31%(+1.25)#1,615 |
| 100. | Ridgefield Borough | 2.54% | 1.62%(+0.915)#100 | 1.31%(+1.23)#1,623 |
Common Questions
What are the Top 10 Cities with the Highest Percentage of Korean Population in New Jersey?
Top 10 Cities with the Highest Percentage of Korean Population in New Jersey are:
#1
9.62%
#2
9.53%
#3
9.18%
#4
8.74%
#5
7.54%
#6
7.20%
#7
6.09%
#8
6.00%
#9
5.68%
#10
5.53%
What city has the Highest Percentage of Korean Population in New Jersey?
Six Mile Run has the Highest Percentage of Korean Population in New Jersey with 9.62%.
What is the Percentage of Korean Population in the State of New Jersey?
Percentage of Korean Population in New Jersey is 1.62%.
What is the Percentage of Korean Population in the United States?
Percentage of Korean Population in the United States is 1.31%.