Cities with the Lowest Poverty Level Among Children Under the Age of 5 in New Jersey
RELATED REPORTS & OPTIONS
Lowest Poverty | Child 0-5
New Jersey
Compare Cities
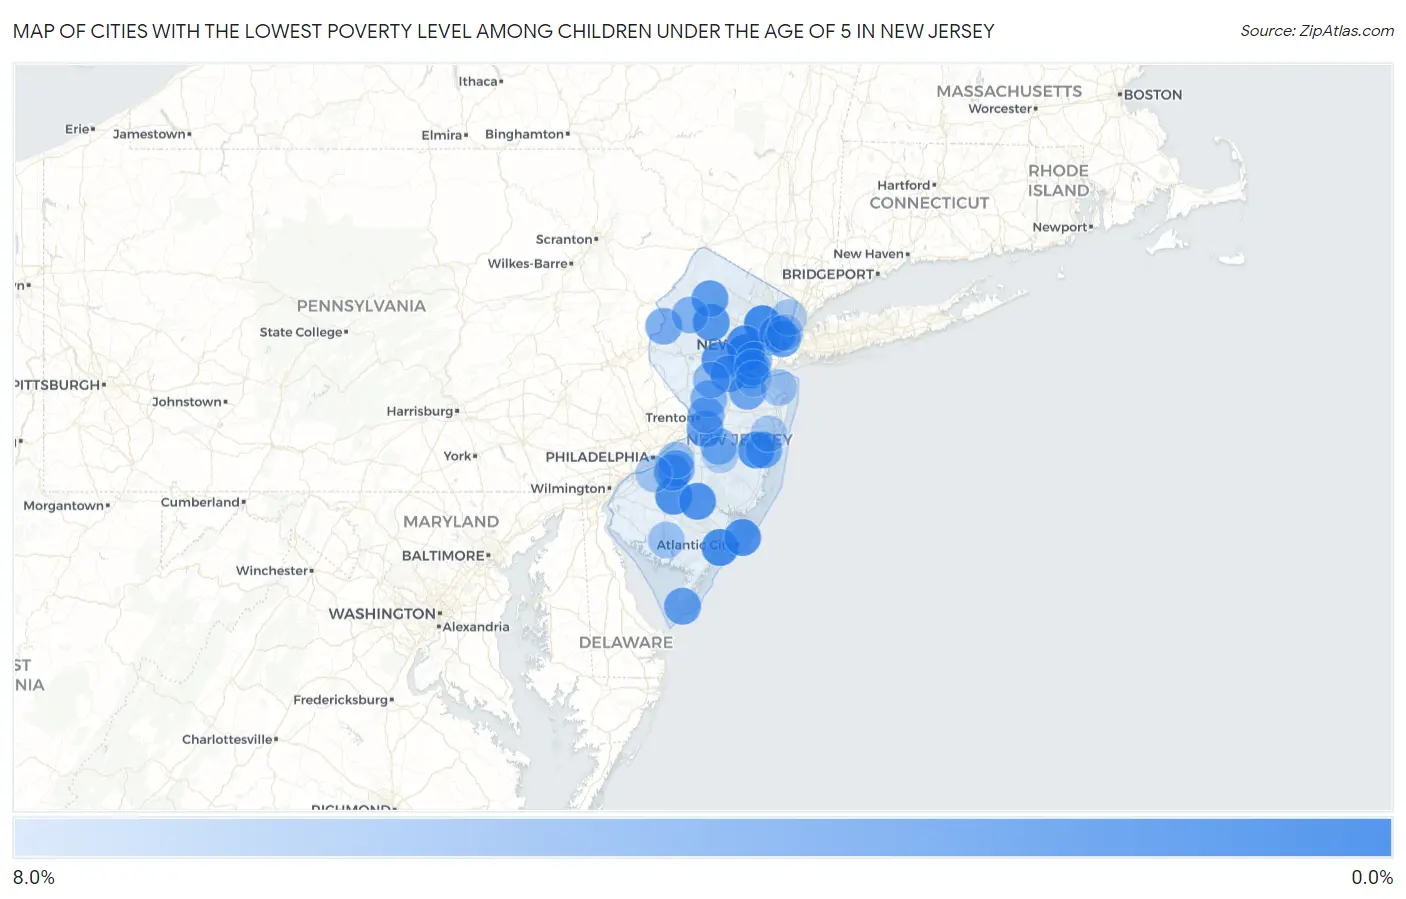
Map of Cities with the Lowest Poverty Level Among Children Under the Age of 5 in New Jersey
8.0%
0.0%
Cities with the Lowest Poverty Level Among Children Under the Age of 5 in New Jersey
| City | Child Poverty | vs State | vs National | |
| 1. | Westfield | 0.22% | 14.3%(-14.1)#1 | 18.1%(-17.8)#3 |
| 2. | Bellmawr Borough | 0.74% | 14.3%(-13.5)#2 | 18.1%(-17.3)#54 |
| 3. | Upper Montclair | 0.92% | 14.3%(-13.4)#3 | 18.1%(-17.1)#82 |
| 4. | New Milford Borough | 1.0% | 14.3%(-13.3)#4 | 18.1%(-17.0)#107 |
| 5. | Metuchen Borough | 1.1% | 14.3%(-13.1)#5 | 18.1%(-16.9)#123 |
| 6. | River Edge Borough | 1.1% | 14.3%(-13.1)#6 | 18.1%(-16.9)#127 |
| 7. | Linwood | 1.4% | 14.3%(-12.8)#7 | 18.1%(-16.6)#188 |
| 8. | Brigantine | 1.6% | 14.3%(-12.7)#8 | 18.1%(-16.5)#215 |
| 9. | Williamstown | 1.6% | 14.3%(-12.7)#9 | 18.1%(-16.5)#219 |
| 10. | Chatham Borough | 1.6% | 14.3%(-12.6)#10 | 18.1%(-16.4)#234 |
| 11. | Summit | 1.7% | 14.3%(-12.6)#11 | 18.1%(-16.4)#249 |
| 12. | New Providence Borough | 1.7% | 14.3%(-12.6)#12 | 18.1%(-16.4)#252 |
| 13. | Pine Lake Park | 1.7% | 14.3%(-12.6)#13 | 18.1%(-16.4)#254 |
| 14. | Hammonton | 1.9% | 14.3%(-12.4)#14 | 18.1%(-16.1)#316 |
| 15. | Keyport Borough | 2.0% | 14.3%(-12.3)#15 | 18.1%(-16.0)#345 |
| 16. | Fords | 2.0% | 14.3%(-12.2)#16 | 18.1%(-16.0)#351 |
| 17. | Martinsville | 2.0% | 14.3%(-12.2)#17 | 18.1%(-16.0)#360 |
| 18. | Secaucus | 2.1% | 14.3%(-12.2)#18 | 18.1%(-16.0)#370 |
| 19. | Waldwick Borough | 2.1% | 14.3%(-12.2)#19 | 18.1%(-15.9)#384 |
| 20. | Succasunna | 2.1% | 14.3%(-12.1)#20 | 18.1%(-15.9)#388 |
| 21. | Audubon Borough | 2.2% | 14.3%(-12.1)#21 | 18.1%(-15.9)#399 |
| 22. | Old Tappan Borough | 2.2% | 14.3%(-12.1)#22 | 18.1%(-15.9)#406 |
| 23. | Leonia Borough | 2.2% | 14.3%(-12.1)#23 | 18.1%(-15.8)#414 |
| 24. | Bogota Borough | 2.2% | 14.3%(-12.0)#24 | 18.1%(-15.8)#423 |
| 25. | Somerset | 2.3% | 14.3%(-12.0)#25 | 18.1%(-15.7)#446 |
| 26. | Hawthorne Borough | 2.4% | 14.3%(-11.8)#26 | 18.1%(-15.6)#486 |
| 27. | Oaklyn Borough | 2.5% | 14.3%(-11.8)#27 | 18.1%(-15.6)#499 |
| 28. | Manasquan Borough | 2.7% | 14.3%(-11.6)#28 | 18.1%(-15.4)#562 |
| 29. | Lake Mohawk | 2.8% | 14.3%(-11.5)#29 | 18.1%(-15.3)#605 |
| 30. | Westmont | 2.9% | 14.3%(-11.4)#30 | 18.1%(-15.2)#658 |
| 31. | Cape May | 2.9% | 14.3%(-11.4)#31 | 18.1%(-15.2)#663 |
| 32. | Haddonfield Borough | 2.9% | 14.3%(-11.3)#32 | 18.1%(-15.1)#690 |
| 33. | Eatontown Borough | 3.0% | 14.3%(-11.3)#33 | 18.1%(-15.1)#697 |
| 34. | Runnemede Borough | 3.1% | 14.3%(-11.2)#34 | 18.1%(-15.0)#733 |
| 35. | Sayreville Borough | 3.1% | 14.3%(-11.2)#35 | 18.1%(-15.0)#743 |
| 36. | Raritan Borough | 3.1% | 14.3%(-11.1)#36 | 18.1%(-14.9)#766 |
| 37. | Bordentown | 3.2% | 14.3%(-11.1)#37 | 18.1%(-14.9)#789 |
| 38. | Troy Hills | 3.2% | 14.3%(-11.0)#38 | 18.1%(-14.8)#805 |
| 39. | West Long Branch Borough | 3.3% | 14.3%(-11.0)#39 | 18.1%(-14.8)#828 |
| 40. | Hoboken | 3.3% | 14.3%(-10.9)#40 | 18.1%(-14.7)#849 |
| 41. | Middlesex Borough | 3.4% | 14.3%(-10.9)#41 | 18.1%(-14.7)#863 |
| 42. | Fair Lawn Borough | 3.4% | 14.3%(-10.9)#42 | 18.1%(-14.7)#875 |
| 43. | South Plainfield Borough | 3.4% | 14.3%(-10.9)#43 | 18.1%(-14.6)#880 |
| 44. | Fanwood Borough | 3.5% | 14.3%(-10.8)#44 | 18.1%(-14.6)#905 |
| 45. | Springdale | 3.5% | 14.3%(-10.8)#45 | 18.1%(-14.5)#921 |
| 46. | Echelon | 3.6% | 14.3%(-10.7)#46 | 18.1%(-14.5)#956 |
| 47. | Fort Lee Borough | 3.7% | 14.3%(-10.6)#47 | 18.1%(-14.3)#1,014 |
| 48. | Old Bridge | 3.8% | 14.3%(-10.4)#48 | 18.1%(-14.2)#1,053 |
| 49. | Roosevelt Borough | 3.8% | 14.3%(-10.4)#49 | 18.1%(-14.2)#1,057 |
| 50. | National Park Borough | 3.9% | 14.3%(-10.3)#50 | 18.1%(-14.1)#1,107 |
| 51. | Toms River | 4.1% | 14.3%(-10.2)#51 | 18.1%(-14.0)#1,163 |
| 52. | Parsippany | 4.2% | 14.3%(-10.1)#52 | 18.1%(-13.9)#1,181 |
| 53. | Collingswood Borough | 4.2% | 14.3%(-10.1)#53 | 18.1%(-13.9)#1,185 |
| 54. | Belvidere | 4.3% | 14.3%(-10.0)#54 | 18.1%(-13.8)#1,236 |
| 55. | The Hills | 4.4% | 14.3%(-9.89)#55 | 18.1%(-13.7)#1,287 |
| 56. | Flanders | 4.4% | 14.3%(-9.83)#56 | 18.1%(-13.6)#1,310 |
| 57. | Princeton | 4.5% | 14.3%(-9.75)#57 | 18.1%(-13.5)#1,340 |
| 58. | Atlantic Highlands Borough | 4.5% | 14.3%(-9.73)#58 | 18.1%(-13.5)#1,346 |
| 59. | Menlo Park Terrace | 4.5% | 14.3%(-9.73)#59 | 18.1%(-13.5)#1,347 |
| 60. | Rutherford Borough | 4.6% | 14.3%(-9.68)#60 | 18.1%(-13.5)#1,384 |
| 61. | Swedesboro Borough | 4.7% | 14.3%(-9.58)#61 | 18.1%(-13.4)#1,422 |
| 62. | Mount Arlington Borough | 4.7% | 14.3%(-9.56)#62 | 18.1%(-13.3)#1,429 |
| 63. | Englishtown Borough | 4.8% | 14.3%(-9.52)#63 | 18.1%(-13.3)#1,444 |
| 64. | Mcguire Afb | 4.8% | 14.3%(-9.49)#64 | 18.1%(-13.3)#1,482 |
| 65. | Hillsborough | 4.8% | 14.3%(-9.48)#65 | 18.1%(-13.3)#1,485 |
| 66. | Panther Valley | 4.8% | 14.3%(-9.43)#66 | 18.1%(-13.2)#1,505 |
| 67. | Edgewater Borough | 4.9% | 14.3%(-9.36)#67 | 18.1%(-13.1)#1,534 |
| 68. | Mercerville | 5.0% | 14.3%(-9.26)#68 | 18.1%(-13.0)#1,581 |
| 69. | Rahway | 5.0% | 14.3%(-9.25)#69 | 18.1%(-13.0)#1,584 |
| 70. | Maywood Borough | 5.1% | 14.3%(-9.20)#70 | 18.1%(-13.0)#1,607 |
| 71. | Elmer Borough | 5.3% | 14.3%(-9.01)#71 | 18.1%(-12.8)#1,682 |
| 72. | Hopatcong Borough | 5.4% | 14.3%(-8.87)#72 | 18.1%(-12.7)#1,755 |
| 73. | Belle Mead | 5.6% | 14.3%(-8.67)#73 | 18.1%(-12.5)#1,838 |
| 74. | Lake Hopatcong | 5.6% | 14.3%(-8.66)#74 | 18.1%(-12.4)#1,839 |
| 75. | Flemington Borough | 5.6% | 14.3%(-8.66)#75 | 18.1%(-12.4)#1,842 |
| 76. | Dumont Borough | 5.9% | 14.3%(-8.38)#76 | 18.1%(-12.2)#1,953 |
| 77. | Tinton Falls Borough | 6.0% | 14.3%(-8.29)#77 | 18.1%(-12.1)#1,978 |
| 78. | Woodbridge | 6.0% | 14.3%(-8.28)#78 | 18.1%(-12.1)#1,987 |
| 79. | Newfield Borough | 6.1% | 14.3%(-8.22)#79 | 18.1%(-12.0)#2,004 |
| 80. | Ramblewood | 6.2% | 14.3%(-8.09)#80 | 18.1%(-11.9)#2,054 |
| 81. | Millville | 6.3% | 14.3%(-7.95)#81 | 18.1%(-11.7)#2,133 |
| 82. | Ogdensburg Borough | 6.5% | 14.3%(-7.76)#82 | 18.1%(-11.5)#2,199 |
| 83. | Leonardo | 6.6% | 14.3%(-7.70)#83 | 18.1%(-11.5)#2,224 |
| 84. | Woodbury | 6.7% | 14.3%(-7.54)#84 | 18.1%(-11.3)#2,299 |
| 85. | Beachwood Borough | 6.8% | 14.3%(-7.45)#85 | 18.1%(-11.2)#2,341 |
| 86. | Totowa Borough | 6.9% | 14.3%(-7.40)#86 | 18.1%(-11.2)#2,363 |
| 87. | Bloomingdale Borough | 6.9% | 14.3%(-7.39)#87 | 18.1%(-11.2)#2,364 |
| 88. | Englewood | 7.0% | 14.3%(-7.25)#88 | 18.1%(-11.0)#2,433 |
| 89. | Buena Borough | 7.0% | 14.3%(-7.23)#89 | 18.1%(-11.0)#2,441 |
| 90. | Brooklawn Borough | 7.1% | 14.3%(-7.13)#90 | 18.1%(-10.9)#2,478 |
| 91. | Guttenberg | 7.2% | 14.3%(-7.13)#91 | 18.1%(-10.9)#2,500 |
| 92. | Ramtown | 7.2% | 14.3%(-7.10)#92 | 18.1%(-10.9)#2,508 |
| 93. | Haddon Heights Borough | 7.2% | 14.3%(-7.08)#93 | 18.1%(-10.9)#2,513 |
| 94. | Clayton Borough | 7.3% | 14.3%(-7.01)#94 | 18.1%(-10.8)#2,540 |
| 95. | Roselle Park Borough | 7.5% | 14.3%(-6.80)#95 | 18.1%(-10.6)#2,621 |
| 96. | Folsom Borough | 7.5% | 14.3%(-6.78)#96 | 18.1%(-10.6)#2,632 |
| 97. | Browns Mills | 7.6% | 14.3%(-6.67)#97 | 18.1%(-10.5)#2,670 |
| 98. | Sussex Borough | 7.7% | 14.3%(-6.59)#98 | 18.1%(-10.4)#2,705 |
| 99. | Cliffside Park Borough | 7.7% | 14.3%(-6.56)#99 | 18.1%(-10.3)#2,733 |
| 100. | South Amboy | 7.9% | 14.3%(-6.37)#100 | 18.1%(-10.2)#2,801 |
Common Questions
What are the Top 10 Cities with the Lowest Poverty Level Among Children Under the Age of 5 in New Jersey?
Top 10 Cities with the Lowest Poverty Level Among Children Under the Age of 5 in New Jersey are:
#1
0.22%
#2
0.92%
#3
1.4%
#4
1.6%
#5
1.6%
#6
1.7%
#7
1.7%
#8
1.9%
#9
2.0%
#10
2.0%
What city has the Lowest Poverty Level Among Children Under the Age of 5 in New Jersey?
Westfield has the Lowest Poverty Level Among Children Under the Age of 5 in New Jersey with 0.22%.
What is the Poverty Level Among Children Under the Age of 5 in the State of New Jersey?
Poverty Level Among Children Under the Age of 5 in New Jersey is 14.3%.
What is the Poverty Level Among Children Under the Age of 5 in the United States?
Poverty Level Among Children Under the Age of 5 in the United States is 18.1%.