Cities with the Highest Percentage of Hawaiian / Pacific Population in New Jersey
RELATED REPORTS & OPTIONS
Hawaiian / Pacific
New Jersey
Compare Cities
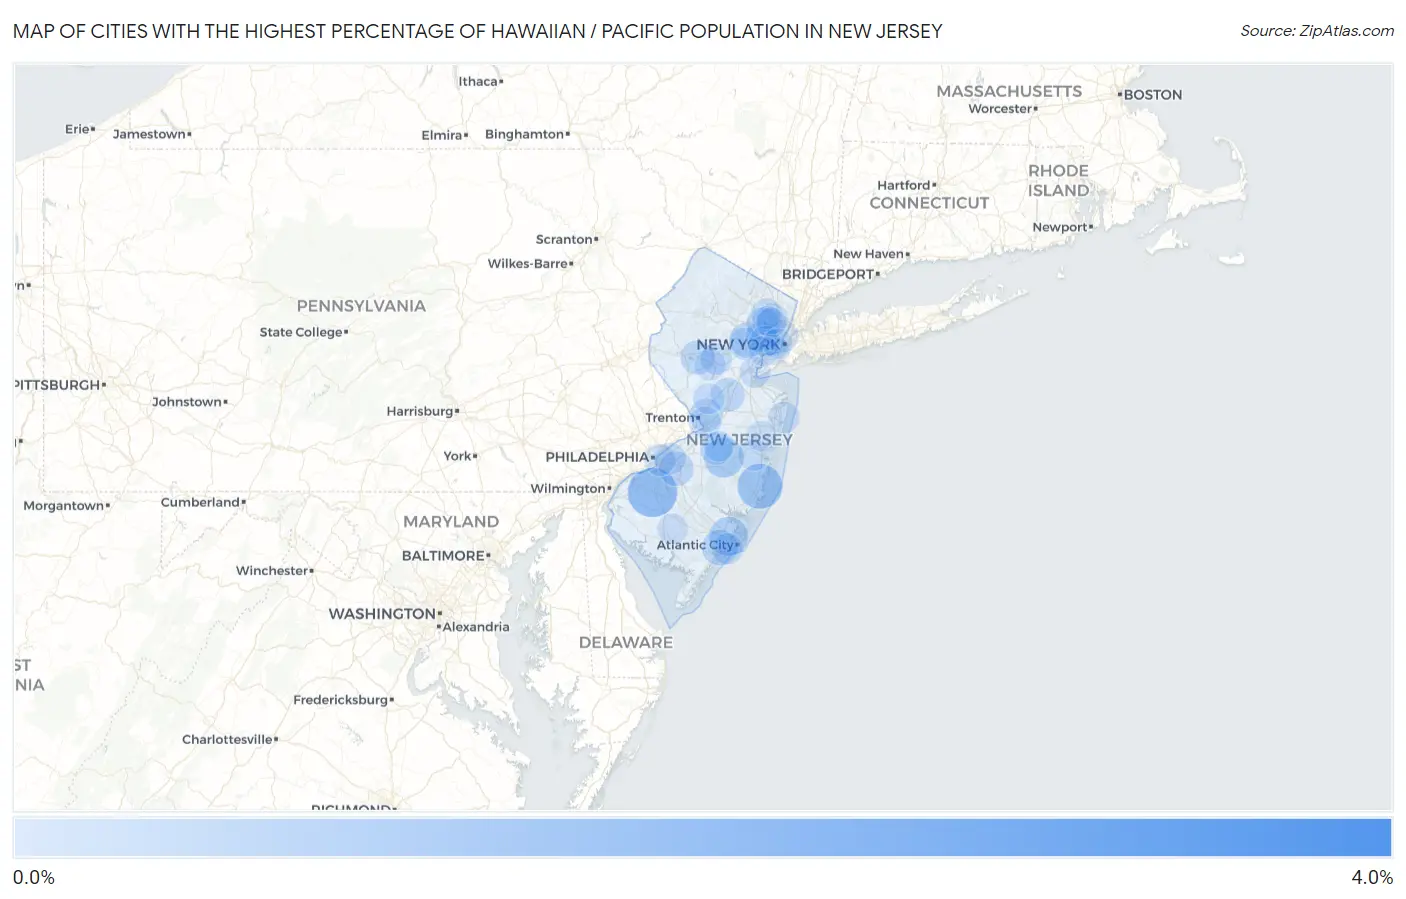
Map of Cities with the Highest Percentage of Hawaiian / Pacific Population in New Jersey
0.0%
4.0%
Cities with the Highest Percentage of Hawaiian / Pacific Population in New Jersey
| City | Hawaiian / Pacific | vs State | vs National | |
| 1. | East Vineland | 3.2% | 0.028%(+3.17)#1 | 0.19%(+3.01)#290 |
| 2. | Richwood | 1.3% | 0.028%(+1.29)#2 | 0.19%(+1.12)#619 |
| 3. | Alpha Borough | 1.0% | 0.028%(+1.01)#3 | 0.19%(+0.846)#721 |
| 4. | Barnegat | 1.0% | 0.028%(+0.977)#4 | 0.19%(+0.816)#737 |
| 5. | Country Lake Estates | 0.67% | 0.028%(+0.642)#5 | 0.19%(+0.481)#1,041 |
| 6. | Saddle River Borough | 0.65% | 0.028%(+0.627)#6 | 0.19%(+0.465)#1,057 |
| 7. | Absecon | 0.59% | 0.028%(+0.567)#7 | 0.19%(+0.406)#1,127 |
| 8. | Somerdale Borough | 0.56% | 0.028%(+0.534)#8 | 0.19%(+0.372)#1,162 |
| 9. | Landing | 0.54% | 0.028%(+0.514)#9 | 0.19%(+0.353)#1,187 |
| 10. | Chesilhurst Borough | 0.51% | 0.028%(+0.478)#10 | 0.19%(+0.317)#1,238 |
| 11. | Little Silver Borough | 0.48% | 0.028%(+0.447)#11 | 0.19%(+0.286)#1,300 |
| 12. | Linwood | 0.39% | 0.028%(+0.361)#12 | 0.19%(+0.200)#1,473 |
| 13. | Hopewell Borough | 0.38% | 0.028%(+0.356)#13 | 0.19%(+0.195)#1,485 |
| 14. | Short Hills | 0.35% | 0.028%(+0.325)#14 | 0.19%(+0.164)#1,572 |
| 15. | Carteret Borough | 0.34% | 0.028%(+0.310)#15 | 0.19%(+0.149)#1,623 |
| 16. | Springdale | 0.31% | 0.028%(+0.281)#16 | 0.19%(+0.120)#1,703 |
| 17. | Englewood Cliffs Borough | 0.30% | 0.028%(+0.272)#17 | 0.19%(+0.111)#1,733 |
| 18. | White House Station | 0.26% | 0.028%(+0.236)#18 | 0.19%(+0.075)#1,871 |
| 19. | Dayton | 0.25% | 0.028%(+0.224)#19 | 0.19%(+0.062)#1,928 |
| 20. | Beachwood Borough | 0.21% | 0.028%(+0.183)#20 | 0.19%(+0.022)#2,085 |
| 21. | Mercerville | 0.21% | 0.028%(+0.181)#21 | 0.19%(+0.020)#2,091 |
| 22. | Leonia Borough | 0.19% | 0.028%(+0.166)#22 | 0.19%(+0.005)#2,160 |
| 23. | Rumson Borough | 0.18% | 0.028%(+0.151)#23 | 0.19%(-0.010)#2,235 |
| 24. | Point Pleasant Borough | 0.16% | 0.028%(+0.130)#24 | 0.19%(-0.031)#2,356 |
| 25. | Roselle Borough | 0.16% | 0.028%(+0.128)#25 | 0.19%(-0.033)#2,368 |
| 26. | Summit | 0.16% | 0.028%(+0.128)#26 | 0.19%(-0.034)#2,371 |
| 27. | Upper Montclair | 0.15% | 0.028%(+0.125)#27 | 0.19%(-0.036)#2,391 |
| 28. | Fort Dix | 0.14% | 0.028%(+0.114)#28 | 0.19%(-0.047)#2,456 |
| 29. | Fort Lee Borough | 0.14% | 0.028%(+0.111)#29 | 0.19%(-0.051)#2,478 |
| 30. | Woodland Park Borough | 0.13% | 0.028%(+0.100)#30 | 0.19%(-0.061)#2,539 |
| 31. | Union City | 0.12% | 0.028%(+0.097)#31 | 0.19%(-0.064)#2,558 |
| 32. | Lake Hopatcong | 0.12% | 0.028%(+0.096)#32 | 0.19%(-0.065)#2,564 |
| 33. | Cherry Hill Mall | 0.12% | 0.028%(+0.095)#33 | 0.19%(-0.066)#2,576 |
| 34. | South River Borough | 0.12% | 0.028%(+0.091)#34 | 0.19%(-0.071)#2,609 |
| 35. | White Horse | 0.11% | 0.028%(+0.086)#35 | 0.19%(-0.075)#2,641 |
| 36. | Butler Borough | 0.11% | 0.028%(+0.084)#36 | 0.19%(-0.077)#2,653 |
| 37. | Buena Borough | 0.11% | 0.028%(+0.083)#37 | 0.19%(-0.078)#2,664 |
| 38. | Camden | 0.11% | 0.028%(+0.081)#38 | 0.19%(-0.080)#2,679 |
| 39. | Asbury Park | 0.10% | 0.028%(+0.077)#39 | 0.19%(-0.084)#2,699 |
| 40. | East Orange | 0.10% | 0.028%(+0.074)#40 | 0.19%(-0.087)#2,728 |
| 41. | Holiday City Berkeley | 0.095% | 0.028%(+0.067)#41 | 0.19%(-0.094)#2,781 |
| 42. | Lodi Borough | 0.092% | 0.028%(+0.065)#42 | 0.19%(-0.096)#2,804 |
| 43. | Green Knoll | 0.090% | 0.028%(+0.063)#43 | 0.19%(-0.098)#2,815 |
| 44. | Margate City | 0.075% | 0.028%(+0.047)#44 | 0.19%(-0.114)#2,942 |
| 45. | Bradley Gardens | 0.070% | 0.028%(+0.042)#45 | 0.19%(-0.119)#2,996 |
| 46. | Bound Brook Borough | 0.067% | 0.028%(+0.040)#46 | 0.19%(-0.122)#3,025 |
| 47. | Sayreville Borough | 0.058% | 0.028%(+0.030)#47 | 0.19%(-0.131)#3,130 |
| 48. | New Providence Borough | 0.051% | 0.028%(+0.024)#48 | 0.19%(-0.137)#3,187 |
| 49. | Princeton | 0.049% | 0.028%(+0.022)#49 | 0.19%(-0.139)#3,215 |
| 50. | Madison Borough | 0.048% | 0.028%(+0.021)#50 | 0.19%(-0.140)#3,223 |
| 51. | North Arlington Borough | 0.043% | 0.028%(+0.015)#51 | 0.19%(-0.146)#3,289 |
| 52. | Garfield | 0.040% | 0.028%(+0.012)#52 | 0.19%(-0.149)#3,320 |
| 53. | Perth Amboy | 0.038% | 0.028%(+0.010)#53 | 0.19%(-0.151)#3,342 |
| 54. | Vineland | 0.035% | 0.028%(+0.007)#54 | 0.19%(-0.154)#3,382 |
| 55. | Paterson | 0.030% | 0.028%(+0.003)#55 | 0.19%(-0.158)#3,441 |
| 56. | Newark | 0.028% | 0.028%(+0.000)#56 | 0.19%(-0.161)#3,479 |
| 57. | South Plainfield Borough | 0.025% | 0.028%(-0.003)#57 | 0.19%(-0.164)#3,522 |
| 58. | Bayonne | 0.023% | 0.028%(-0.005)#58 | 0.19%(-0.166)#3,549 |
| 59. | Mcguire Afb | 0.020% | 0.028%(-0.007)#59 | 0.19%(-0.168)#3,583 |
| 60. | Clifton | 0.017% | 0.028%(-0.011)#60 | 0.19%(-0.172)#3,636 |
| 61. | Passaic | 0.013% | 0.028%(-0.015)#61 | 0.19%(-0.176)#3,680 |
| 62. | Lakewood | 0.012% | 0.028%(-0.016)#62 | 0.19%(-0.177)#3,695 |
| 63. | Elizabeth | 0.0074% | 0.028%(-0.020)#63 | 0.19%(-0.181)#3,746 |
| 64. | Jersey City | 0.0069% | 0.028%(-0.021)#64 | 0.19%(-0.182)#3,752 |
| 65. | Palisades Park Borough | 0.0049% | 0.028%(-0.023)#65 | 0.19%(-0.184)#3,769 |
Common Questions
What are the Top 10 Cities with the Highest Percentage of Hawaiian / Pacific Population in New Jersey?
Top 10 Cities with the Highest Percentage of Hawaiian / Pacific Population in New Jersey are:
#1
1.3%
#2
1.0%
#3
0.67%
#4
0.59%
#5
0.39%
#6
0.35%
#7
0.31%
#8
0.26%
#9
0.25%
#10
0.21%
What city has the Highest Percentage of Hawaiian / Pacific Population in New Jersey?
Richwood has the Highest Percentage of Hawaiian / Pacific Population in New Jersey with 1.3%.
What is the Percentage of Hawaiian / Pacific Population in the State of New Jersey?
Percentage of Hawaiian / Pacific Population in New Jersey is 0.028%.
What is the Percentage of Hawaiian / Pacific Population in the United States?
Percentage of Hawaiian / Pacific Population in the United States is 0.19%.