Cities with the Most Immigrants from Trinidad and Tobago in New Jersey
RELATED REPORTS & OPTIONS
Trinidad and Tobago
New Jersey
Compare Cities
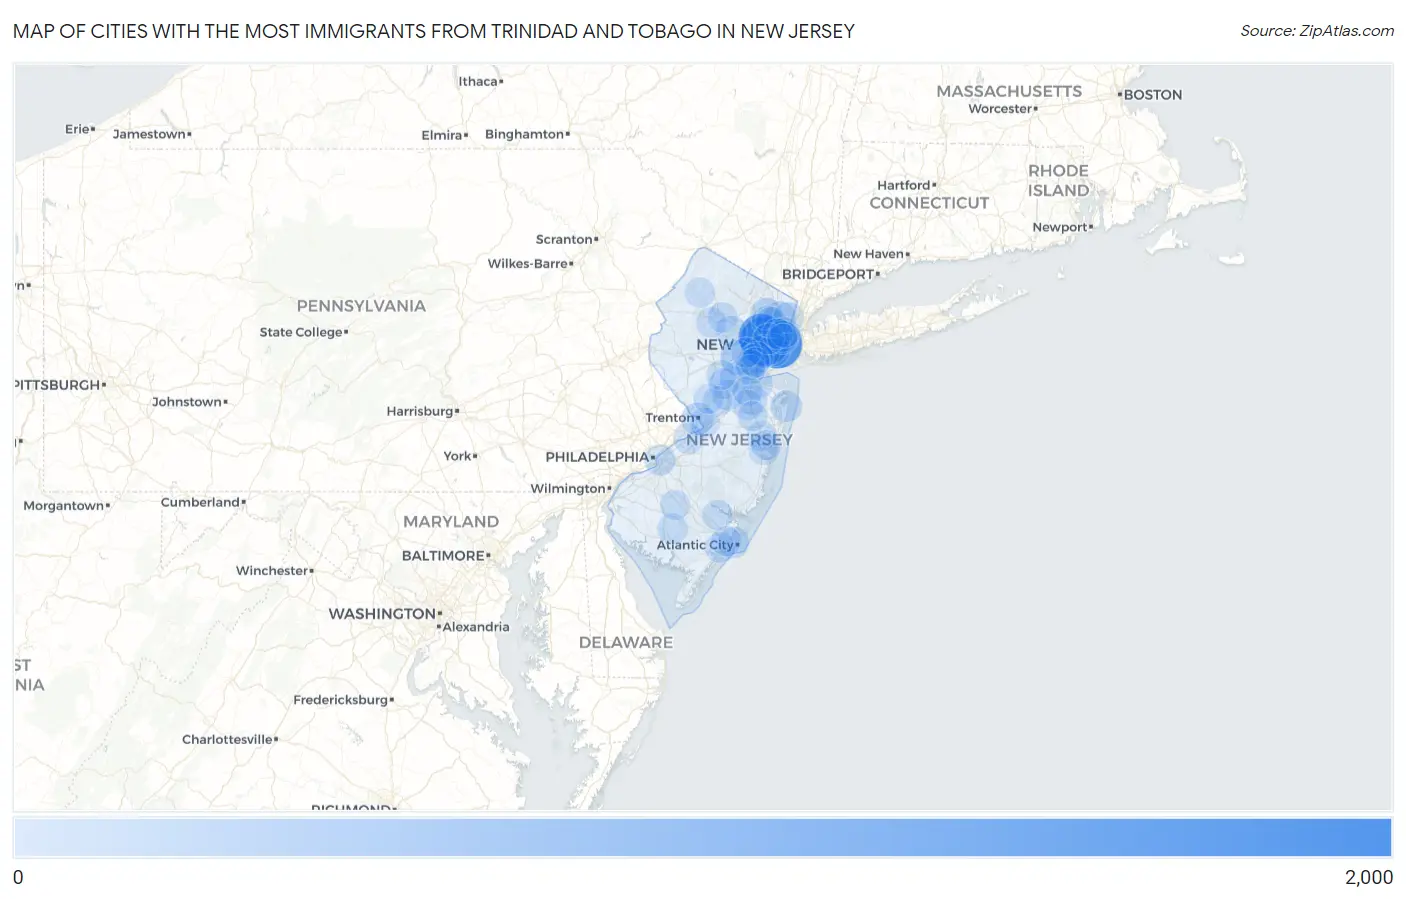
Map of Cities with the Most Immigrants from Trinidad and Tobago in New Jersey
0
2,000
Cities with the Most Immigrants from Trinidad and Tobago in New Jersey
| City | Trinidad and Tobago | vs State | vs National | |
| 1. | Jersey City | 1,586 | 15,533(10.21%)#1 | 231,222(0.69%)#6 |
| 2. | Newark | 1,566 | 15,533(10.08%)#2 | 231,222(0.68%)#7 |
| 3. | East Orange | 1,210 | 15,533(7.79%)#3 | 231,222(0.52%)#13 |
| 4. | Cliffside Park Borough | 426 | 15,533(2.74%)#4 | 231,222(0.18%)#43 |
| 5. | Plainfield | 351 | 15,533(2.26%)#5 | 231,222(0.15%)#53 |
| 6. | Bergenfield Borough | 238 | 15,533(1.53%)#6 | 231,222(0.10%)#94 |
| 7. | Elizabeth | 221 | 15,533(1.42%)#7 | 231,222(0.10%)#100 |
| 8. | Bayonne | 215 | 15,533(1.38%)#8 | 231,222(0.09%)#104 |
| 9. | Trenton | 192 | 15,533(1.24%)#9 | 231,222(0.08%)#121 |
| 10. | Hackensack | 190 | 15,533(1.22%)#10 | 231,222(0.08%)#123 |
| 11. | Sayreville Borough | 169 | 15,533(1.09%)#11 | 231,222(0.07%)#144 |
| 12. | Paterson | 146 | 15,533(0.94%)#12 | 231,222(0.06%)#167 |
| 13. | Rahway | 146 | 15,533(0.94%)#13 | 231,222(0.06%)#168 |
| 14. | Long Branch | 143 | 15,533(0.92%)#14 | 231,222(0.06%)#174 |
| 15. | Roselle Borough | 139 | 15,533(0.89%)#15 | 231,222(0.06%)#185 |
| 16. | Lodi Borough | 137 | 15,533(0.88%)#16 | 231,222(0.06%)#188 |
| 17. | Sicklerville | 128 | 15,533(0.82%)#17 | 231,222(0.06%)#198 |
| 18. | North Plainfield Borough | 112 | 15,533(0.72%)#18 | 231,222(0.05%)#245 |
| 19. | Clifton | 108 | 15,533(0.70%)#19 | 231,222(0.05%)#256 |
| 20. | Dumont Borough | 103 | 15,533(0.66%)#20 | 231,222(0.04%)#272 |
| 21. | Passaic | 100 | 15,533(0.64%)#21 | 231,222(0.04%)#278 |
| 22. | Atlantic City | 97 | 15,533(0.62%)#22 | 231,222(0.04%)#283 |
| 23. | Camden | 96 | 15,533(0.62%)#23 | 231,222(0.04%)#287 |
| 24. | Linden | 94 | 15,533(0.61%)#24 | 231,222(0.04%)#292 |
| 25. | Morristown | 87 | 15,533(0.56%)#25 | 231,222(0.04%)#320 |
| 26. | Hawthorne Borough | 82 | 15,533(0.53%)#26 | 231,222(0.04%)#343 |
| 27. | Englewood | 80 | 15,533(0.52%)#27 | 231,222(0.03%)#349 |
| 28. | Union City | 79 | 15,533(0.51%)#28 | 231,222(0.03%)#356 |
| 29. | Laurence Harbor | 79 | 15,533(0.51%)#29 | 231,222(0.03%)#358 |
| 30. | Harrison | 75 | 15,533(0.48%)#30 | 231,222(0.03%)#377 |
| 31. | Vineland | 71 | 15,533(0.46%)#31 | 231,222(0.03%)#403 |
| 32. | Fair Lawn Borough | 71 | 15,533(0.46%)#32 | 231,222(0.03%)#404 |
| 33. | Iselin | 67 | 15,533(0.43%)#33 | 231,222(0.03%)#432 |
| 34. | Dayton | 67 | 15,533(0.43%)#34 | 231,222(0.03%)#433 |
| 35. | Burlington | 64 | 15,533(0.41%)#35 | 231,222(0.03%)#443 |
| 36. | Vauxhall | 64 | 15,533(0.41%)#36 | 231,222(0.03%)#444 |
| 37. | New Brunswick | 60 | 15,533(0.39%)#37 | 231,222(0.03%)#461 |
| 38. | Watsessing | 60 | 15,533(0.39%)#38 | 231,222(0.03%)#465 |
| 39. | Bogota Borough | 56 | 15,533(0.36%)#39 | 231,222(0.02%)#497 |
| 40. | Union Beach Borough | 55 | 15,533(0.35%)#40 | 231,222(0.02%)#503 |
| 41. | Franklin Park | 52 | 15,533(0.33%)#41 | 231,222(0.02%)#518 |
| 42. | Glen Ridge Borough | 51 | 15,533(0.33%)#42 | 231,222(0.02%)#525 |
| 43. | Freehold Borough | 49 | 15,533(0.32%)#43 | 231,222(0.02%)#540 |
| 44. | Fort Lee Borough | 44 | 15,533(0.28%)#44 | 231,222(0.02%)#574 |
| 45. | Egg Harbor City | 42 | 15,533(0.27%)#45 | 231,222(0.02%)#595 |
| 46. | Fords | 41 | 15,533(0.26%)#46 | 231,222(0.02%)#605 |
| 47. | Linwood | 41 | 15,533(0.26%)#47 | 231,222(0.02%)#609 |
| 48. | Secaucus | 39 | 15,533(0.25%)#48 | 231,222(0.02%)#621 |
| 49. | Succasunna | 38 | 15,533(0.24%)#49 | 231,222(0.02%)#640 |
| 50. | North Haledon Borough | 38 | 15,533(0.24%)#50 | 231,222(0.02%)#641 |
| 51. | Robbinsville Center | 38 | 15,533(0.24%)#51 | 231,222(0.02%)#645 |
| 52. | Toms River | 37 | 15,533(0.24%)#52 | 231,222(0.02%)#651 |
| 53. | West New York | 37 | 15,533(0.24%)#53 | 231,222(0.02%)#652 |
| 54. | Closter Borough | 36 | 15,533(0.23%)#54 | 231,222(0.02%)#678 |
| 55. | Parsippany | 33 | 15,533(0.21%)#55 | 231,222(0.01%)#719 |
| 56. | Westwood Borough | 33 | 15,533(0.21%)#56 | 231,222(0.01%)#722 |
| 57. | Newton | 33 | 15,533(0.21%)#57 | 231,222(0.01%)#723 |
| 58. | Palisades Park Borough | 32 | 15,533(0.21%)#58 | 231,222(0.01%)#734 |
| 59. | Leonia Borough | 32 | 15,533(0.21%)#59 | 231,222(0.01%)#735 |
| 60. | South Plainfield Borough | 31 | 15,533(0.20%)#60 | 231,222(0.01%)#742 |
| 61. | Robertsville | 31 | 15,533(0.20%)#61 | 231,222(0.01%)#748 |
| 62. | Yorketown | 31 | 15,533(0.20%)#62 | 231,222(0.01%)#751 |
| 63. | Plainsboro Center | 31 | 15,533(0.20%)#63 | 231,222(0.01%)#755 |
| 64. | Westmont | 30 | 15,533(0.19%)#64 | 231,222(0.01%)#767 |
| 65. | Landing | 30 | 15,533(0.19%)#65 | 231,222(0.01%)#771 |
| 66. | Keansburg Borough | 29 | 15,533(0.19%)#66 | 231,222(0.01%)#787 |
| 67. | Allendale Borough | 29 | 15,533(0.19%)#67 | 231,222(0.01%)#790 |
| 68. | Bloomingdale Borough | 28 | 15,533(0.18%)#68 | 231,222(0.01%)#803 |
| 69. | Lakewood | 27 | 15,533(0.17%)#69 | 231,222(0.01%)#811 |
| 70. | New Milford Borough | 26 | 15,533(0.17%)#70 | 231,222(0.01%)#839 |
| 71. | Franklin Lakes Borough | 26 | 15,533(0.17%)#71 | 231,222(0.01%)#842 |
| 72. | Ampere North | 26 | 15,533(0.17%)#72 | 231,222(0.01%)#845 |
| 73. | Dover | 25 | 15,533(0.16%)#73 | 231,222(0.01%)#858 |
| 74. | White Horse | 25 | 15,533(0.16%)#74 | 231,222(0.01%)#866 |
| 75. | Pleasantville | 24 | 15,533(0.15%)#75 | 231,222(0.01%)#884 |
| 76. | Victory Lakes | 24 | 15,533(0.15%)#76 | 231,222(0.01%)#891 |
| 77. | Princeton | 23 | 15,533(0.15%)#77 | 231,222(0.01%)#902 |
| 78. | Washington Borough | 23 | 15,533(0.15%)#78 | 231,222(0.01%)#914 |
| 79. | East Millstone | 23 | 15,533(0.15%)#79 | 231,222(0.01%)#918 |
| 80. | Matawan Borough | 22 | 15,533(0.14%)#80 | 231,222(0.01%)#937 |
| 81. | Pine Brook | 21 | 15,533(0.14%)#81 | 231,222(0.01%)#962 |
| 82. | Old Bridge | 20 | 15,533(0.13%)#82 | 231,222(0.01%)#973 |
| 83. | Wood Ridge Borough | 20 | 15,533(0.13%)#83 | 231,222(0.01%)#980 |
| 84. | Somerville Borough | 19 | 15,533(0.12%)#84 | 231,222(0.01%)#1,006 |
| 85. | Maywood Borough | 19 | 15,533(0.12%)#85 | 231,222(0.01%)#1,010 |
| 86. | Haledon Borough | 19 | 15,533(0.12%)#86 | 231,222(0.01%)#1,013 |
| 87. | Cedar Knolls | 19 | 15,533(0.12%)#87 | 231,222(0.01%)#1,019 |
| 88. | Westfield | 18 | 15,533(0.12%)#88 | 231,222(0.01%)#1,030 |
| 89. | Elmwood Park Borough | 18 | 15,533(0.12%)#89 | 231,222(0.01%)#1,032 |
| 90. | Ramsey Borough | 18 | 15,533(0.12%)#90 | 231,222(0.01%)#1,036 |
| 91. | Eatontown Borough | 18 | 15,533(0.12%)#91 | 231,222(0.01%)#1,037 |
| 92. | Woodland Park Borough | 18 | 15,533(0.12%)#92 | 231,222(0.01%)#1,038 |
| 93. | Flanders | 18 | 15,533(0.12%)#93 | 231,222(0.01%)#1,044 |
| 94. | Leisure Village East | 18 | 15,533(0.12%)#94 | 231,222(0.01%)#1,051 |
| 95. | Riverdale Borough | 18 | 15,533(0.12%)#95 | 231,222(0.01%)#1,053 |
| 96. | Netcong Borough | 18 | 15,533(0.12%)#96 | 231,222(0.01%)#1,055 |
| 97. | Hoboken | 17 | 15,533(0.11%)#97 | 231,222(0.01%)#1,063 |
| 98. | Avenel | 17 | 15,533(0.11%)#98 | 231,222(0.01%)#1,077 |
| 99. | West Freehold | 17 | 15,533(0.11%)#99 | 231,222(0.01%)#1,080 |
| 100. | Oak Ridge | 17 | 15,533(0.11%)#100 | 231,222(0.01%)#1,083 |
Common Questions
What are the Top 10 Cities with the Most Immigrants from Trinidad and Tobago in New Jersey?
Top 10 Cities with the Most Immigrants from Trinidad and Tobago in New Jersey are:
#1
1,586
#2
1,566
#3
1,210
#4
351
#5
221
#6
215
#7
192
#8
190
#9
146
#10
146
What city has the Most Immigrants from Trinidad and Tobago in New Jersey?
Jersey City has the Most Immigrants from Trinidad and Tobago in New Jersey with 1,586.
What is the Total Immigrants from Trinidad and Tobago in the State of New Jersey?
Total Immigrants from Trinidad and Tobago in New Jersey is 15,533.
What is the Total Immigrants from Trinidad and Tobago in the United States?
Total Immigrants from Trinidad and Tobago in the United States is 231,222.