Cities with the Highest Percentage of Costa Rican Population in New Jersey
RELATED REPORTS & OPTIONS
Costa Rican
New Jersey
Compare Cities
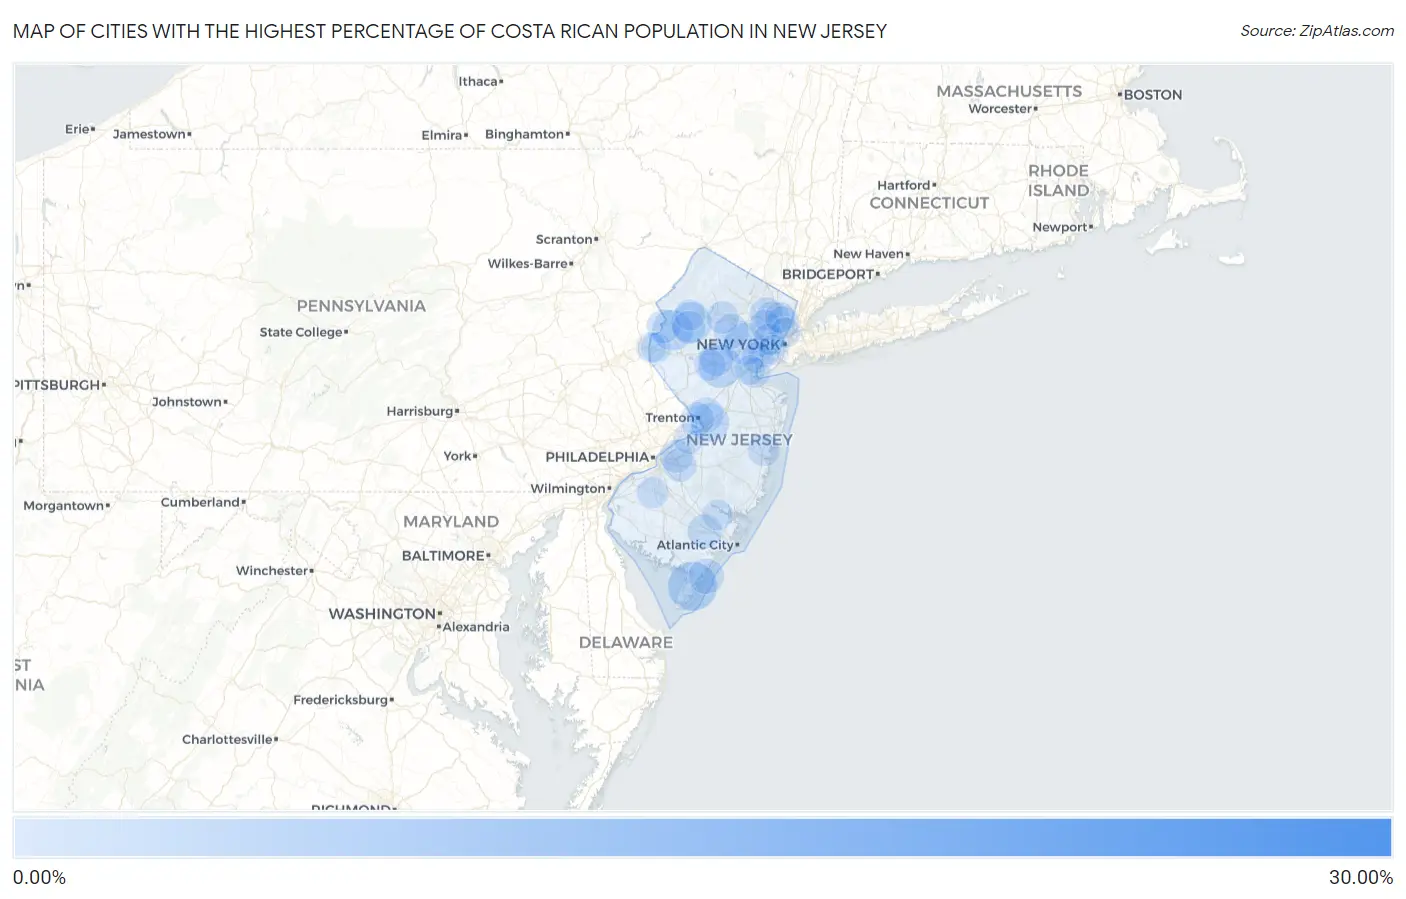
Map of Cities with the Highest Percentage of Costa Rican Population in New Jersey
0.00%
30.00%
Cities with the Highest Percentage of Costa Rican Population in New Jersey
| City | Costa Rican | vs State | vs National | |
| 1. | Millstone Borough | 26.88% | 0.25%(+26.6)#1 | 0.052%(+26.8)#1 |
| 2. | Bound Brook Borough | 9.80% | 0.25%(+9.55)#2 | 0.052%(+9.75)#6 |
| 3. | South Bound Brook Borough | 6.61% | 0.25%(+6.36)#3 | 0.052%(+6.56)#10 |
| 4. | Raritan Borough | 5.10% | 0.25%(+4.84)#4 | 0.052%(+5.04)#16 |
| 5. | Cape May Court House | 4.53% | 0.25%(+4.28)#5 | 0.052%(+4.48)#20 |
| 6. | Deal Borough | 3.57% | 0.25%(+3.31)#6 | 0.052%(+3.51)#28 |
| 7. | Netcong Borough | 3.44% | 0.25%(+3.19)#7 | 0.052%(+3.39)#31 |
| 8. | Stirling | 3.28% | 0.25%(+3.03)#8 | 0.052%(+3.23)#33 |
| 9. | New Vernon | 3.22% | 0.25%(+2.97)#9 | 0.052%(+3.17)#34 |
| 10. | Lyons | 3.21% | 0.25%(+2.95)#10 | 0.052%(+3.15)#35 |
| 11. | Finderne | 3.08% | 0.25%(+2.83)#11 | 0.052%(+3.03)#37 |
| 12. | Bedminster | 3.03% | 0.25%(+2.78)#12 | 0.052%(+2.98)#38 |
| 13. | Summit | 2.99% | 0.25%(+2.74)#13 | 0.052%(+2.94)#41 |
| 14. | Oxford | 2.64% | 0.25%(+2.39)#14 | 0.052%(+2.59)#45 |
| 15. | Hackettstown | 2.63% | 0.25%(+2.38)#15 | 0.052%(+2.58)#46 |
| 16. | Flemington Borough | 2.32% | 0.25%(+2.07)#16 | 0.052%(+2.27)#52 |
| 17. | Belmar Borough | 2.11% | 0.25%(+1.86)#17 | 0.052%(+2.06)#62 |
| 18. | Yardville | 2.11% | 0.25%(+1.86)#18 | 0.052%(+2.06)#63 |
| 19. | Lake Como Borough | 1.81% | 0.25%(+1.56)#19 | 0.052%(+1.76)#78 |
| 20. | Allendale Borough | 1.60% | 0.25%(+1.35)#20 | 0.052%(+1.55)#86 |
| 21. | Manville Borough | 1.55% | 0.25%(+1.30)#21 | 0.052%(+1.50)#88 |
| 22. | Rainbow Lakes | 1.43% | 0.25%(+1.18)#22 | 0.052%(+1.38)#98 |
| 23. | Ringwood Borough | 1.42% | 0.25%(+1.17)#23 | 0.052%(+1.37)#100 |
| 24. | Victory Gardens Borough | 1.42% | 0.25%(+1.17)#24 | 0.052%(+1.37)#101 |
| 25. | Sea Isle City | 1.42% | 0.25%(+1.17)#25 | 0.052%(+1.36)#102 |
| 26. | Prospect Park Borough | 1.41% | 0.25%(+1.16)#26 | 0.052%(+1.36)#104 |
| 27. | Somerville Borough | 1.35% | 0.25%(+1.10)#27 | 0.052%(+1.30)#112 |
| 28. | Ridgefield Borough | 1.33% | 0.25%(+1.08)#28 | 0.052%(+1.28)#114 |
| 29. | Mercerville | 1.33% | 0.25%(+1.08)#29 | 0.052%(+1.28)#115 |
| 30. | Morristown | 1.31% | 0.25%(+1.06)#30 | 0.052%(+1.25)#119 |
| 31. | Midland Park Borough | 1.25% | 0.25%(+1.00)#31 | 0.052%(+1.20)#125 |
| 32. | Green Knoll | 1.25% | 0.25%(+1.000)#32 | 0.052%(+1.20)#126 |
| 33. | Garfield | 1.24% | 0.25%(+0.987)#33 | 0.052%(+1.19)#128 |
| 34. | Mays Landing | 1.21% | 0.25%(+0.962)#34 | 0.052%(+1.16)#130 |
| 35. | Florham Park Borough | 1.15% | 0.25%(+0.898)#35 | 0.052%(+1.10)#134 |
| 36. | Belvidere | 1.11% | 0.25%(+0.855)#36 | 0.052%(+1.05)#145 |
| 37. | Caldwell Borough | 1.06% | 0.25%(+0.805)#37 | 0.052%(+1.00)#153 |
| 38. | East Vineland | 1.04% | 0.25%(+0.789)#38 | 0.052%(+0.988)#155 |
| 39. | Hillsborough | 1.02% | 0.25%(+0.773)#39 | 0.052%(+0.972)#157 |
| 40. | Trenton | 0.99% | 0.25%(+0.738)#40 | 0.052%(+0.937)#163 |
| 41. | Marlton | 0.97% | 0.25%(+0.720)#41 | 0.052%(+0.919)#168 |
| 42. | Stratford Borough | 0.95% | 0.25%(+0.697)#42 | 0.052%(+0.896)#169 |
| 43. | Silver Lake Cdp Warren County | 0.93% | 0.25%(+0.675)#43 | 0.052%(+0.874)#171 |
| 44. | Moorestown Lenola | 0.91% | 0.25%(+0.660)#44 | 0.052%(+0.859)#173 |
| 45. | Union | 0.91% | 0.25%(+0.657)#45 | 0.052%(+0.856)#175 |
| 46. | Paterson | 0.90% | 0.25%(+0.648)#46 | 0.052%(+0.847)#177 |
| 47. | Beattystown | 0.89% | 0.25%(+0.642)#47 | 0.052%(+0.840)#178 |
| 48. | Westwood Borough | 0.87% | 0.25%(+0.621)#48 | 0.052%(+0.819)#183 |
| 49. | Ridgefield Park | 0.87% | 0.25%(+0.615)#49 | 0.052%(+0.814)#184 |
| 50. | North Plainfield Borough | 0.85% | 0.25%(+0.604)#50 | 0.052%(+0.802)#188 |
| 51. | Stanhope Borough | 0.82% | 0.25%(+0.570)#51 | 0.052%(+0.768)#196 |
| 52. | Middlesex Borough | 0.79% | 0.25%(+0.541)#52 | 0.052%(+0.739)#209 |
| 53. | Dover | 0.78% | 0.25%(+0.530)#53 | 0.052%(+0.729)#212 |
| 54. | Wharton Borough | 0.78% | 0.25%(+0.525)#54 | 0.052%(+0.724)#216 |
| 55. | Mount Arlington Borough | 0.75% | 0.25%(+0.499)#55 | 0.052%(+0.698)#226 |
| 56. | Toms River | 0.70% | 0.25%(+0.446)#56 | 0.052%(+0.645)#245 |
| 57. | Woodland Park Borough | 0.69% | 0.25%(+0.441)#57 | 0.052%(+0.640)#248 |
| 58. | Madison Borough | 0.68% | 0.25%(+0.427)#58 | 0.052%(+0.626)#256 |
| 59. | New Providence Borough | 0.65% | 0.25%(+0.404)#59 | 0.052%(+0.602)#265 |
| 60. | Dunellen Borough | 0.64% | 0.25%(+0.394)#60 | 0.052%(+0.593)#269 |
| 61. | Ampere North | 0.64% | 0.25%(+0.388)#61 | 0.052%(+0.587)#272 |
| 62. | Palisades Park Borough | 0.63% | 0.25%(+0.377)#62 | 0.052%(+0.575)#275 |
| 63. | Kenilworth Borough | 0.62% | 0.25%(+0.372)#63 | 0.052%(+0.571)#280 |
| 64. | Elizabeth | 0.62% | 0.25%(+0.372)#64 | 0.052%(+0.570)#281 |
| 65. | Linden | 0.61% | 0.25%(+0.361)#65 | 0.052%(+0.559)#284 |
| 66. | Richwood | 0.57% | 0.25%(+0.323)#66 | 0.052%(+0.522)#300 |
| 67. | Bradley Gardens | 0.56% | 0.25%(+0.314)#67 | 0.052%(+0.512)#306 |
| 68. | Tinton Falls Borough | 0.56% | 0.25%(+0.307)#68 | 0.052%(+0.506)#312 |
| 69. | Bergenfield Borough | 0.53% | 0.25%(+0.277)#69 | 0.052%(+0.476)#322 |
| 70. | Montvale Borough | 0.48% | 0.25%(+0.224)#70 | 0.052%(+0.423)#349 |
| 71. | Chester Borough | 0.47% | 0.25%(+0.222)#71 | 0.052%(+0.421)#350 |
| 72. | Panther Valley | 0.46% | 0.25%(+0.209)#72 | 0.052%(+0.408)#358 |
| 73. | Butler Borough | 0.46% | 0.25%(+0.209)#73 | 0.052%(+0.408)#359 |
| 74. | Elmwood Park Borough | 0.44% | 0.25%(+0.191)#74 | 0.052%(+0.390)#370 |
| 75. | Wallington Borough | 0.41% | 0.25%(+0.163)#75 | 0.052%(+0.362)#405 |
| 76. | Highland Park Borough | 0.41% | 0.25%(+0.162)#76 | 0.052%(+0.361)#407 |
| 77. | Egg Harbor City | 0.41% | 0.25%(+0.160)#77 | 0.052%(+0.359)#409 |
| 78. | Brookdale | 0.41% | 0.25%(+0.156)#78 | 0.052%(+0.355)#412 |
| 79. | Paramus Borough | 0.40% | 0.25%(+0.144)#79 | 0.052%(+0.343)#424 |
| 80. | Roseland Borough | 0.39% | 0.25%(+0.135)#80 | 0.052%(+0.333)#431 |
| 81. | Harrison | 0.38% | 0.25%(+0.129)#81 | 0.052%(+0.328)#436 |
| 82. | Bogota Borough | 0.36% | 0.25%(+0.107)#82 | 0.052%(+0.306)#466 |
| 83. | Woodbine Borough | 0.35% | 0.25%(+0.102)#83 | 0.052%(+0.301)#472 |
| 84. | Greenwich | 0.35% | 0.25%(+0.098)#84 | 0.052%(+0.297)#477 |
| 85. | Perth Amboy | 0.34% | 0.25%(+0.093)#85 | 0.052%(+0.292)#481 |
| 86. | Burlington | 0.34% | 0.25%(+0.085)#86 | 0.052%(+0.283)#488 |
| 87. | Avon By The Sea Borough | 0.33% | 0.25%(+0.084)#87 | 0.052%(+0.282)#490 |
| 88. | Hackensack | 0.33% | 0.25%(+0.083)#88 | 0.052%(+0.282)#495 |
| 89. | Point Pleasant Borough | 0.32% | 0.25%(+0.070)#89 | 0.052%(+0.268)#511 |
| 90. | Rutherford Borough | 0.30% | 0.25%(+0.053)#90 | 0.052%(+0.252)#539 |
| 91. | West New York | 0.30% | 0.25%(+0.052)#91 | 0.052%(+0.251)#540 |
| 92. | Bayonne | 0.30% | 0.25%(+0.047)#92 | 0.052%(+0.246)#547 |
| 93. | Roselle Borough | 0.30% | 0.25%(+0.047)#93 | 0.052%(+0.245)#548 |
| 94. | Parsippany | 0.29% | 0.25%(+0.042)#94 | 0.052%(+0.241)#553 |
| 95. | North Haledon Borough | 0.27% | 0.25%(+0.022)#95 | 0.052%(+0.220)#585 |
| 96. | Phillipsburg | 0.25% | 0.25%(-0.001)#96 | 0.052%(+0.198)#622 |
| 97. | Stockton University | 0.25% | 0.25%(-0.004)#97 | 0.052%(+0.195)#626 |
| 98. | Keansburg Borough | 0.25% | 0.25%(-0.005)#98 | 0.052%(+0.194)#629 |
| 99. | Fords | 0.24% | 0.25%(-0.006)#99 | 0.052%(+0.192)#631 |
| 100. | Milford Borough | 0.24% | 0.25%(-0.010)#100 | 0.052%(+0.189)#636 |
Common Questions
What are the Top 10 Cities with the Highest Percentage of Costa Rican Population in New Jersey?
Top 10 Cities with the Highest Percentage of Costa Rican Population in New Jersey are:
#1
4.53%
#2
3.08%
#3
2.99%
#4
2.64%
#5
2.63%
#6
2.11%
#7
1.42%
#8
1.33%
#9
1.31%
#10
1.25%
What city has the Highest Percentage of Costa Rican Population in New Jersey?
Cape May Court House has the Highest Percentage of Costa Rican Population in New Jersey with 4.53%.
What is the Percentage of Costa Rican Population in the State of New Jersey?
Percentage of Costa Rican Population in New Jersey is 0.25%.
What is the Percentage of Costa Rican Population in the United States?
Percentage of Costa Rican Population in the United States is 0.052%.