Cities with the Highest Percentage of Immigrants from Caribbean in New Jersey
RELATED REPORTS & OPTIONS
Caribbean
New Jersey
Compare Cities
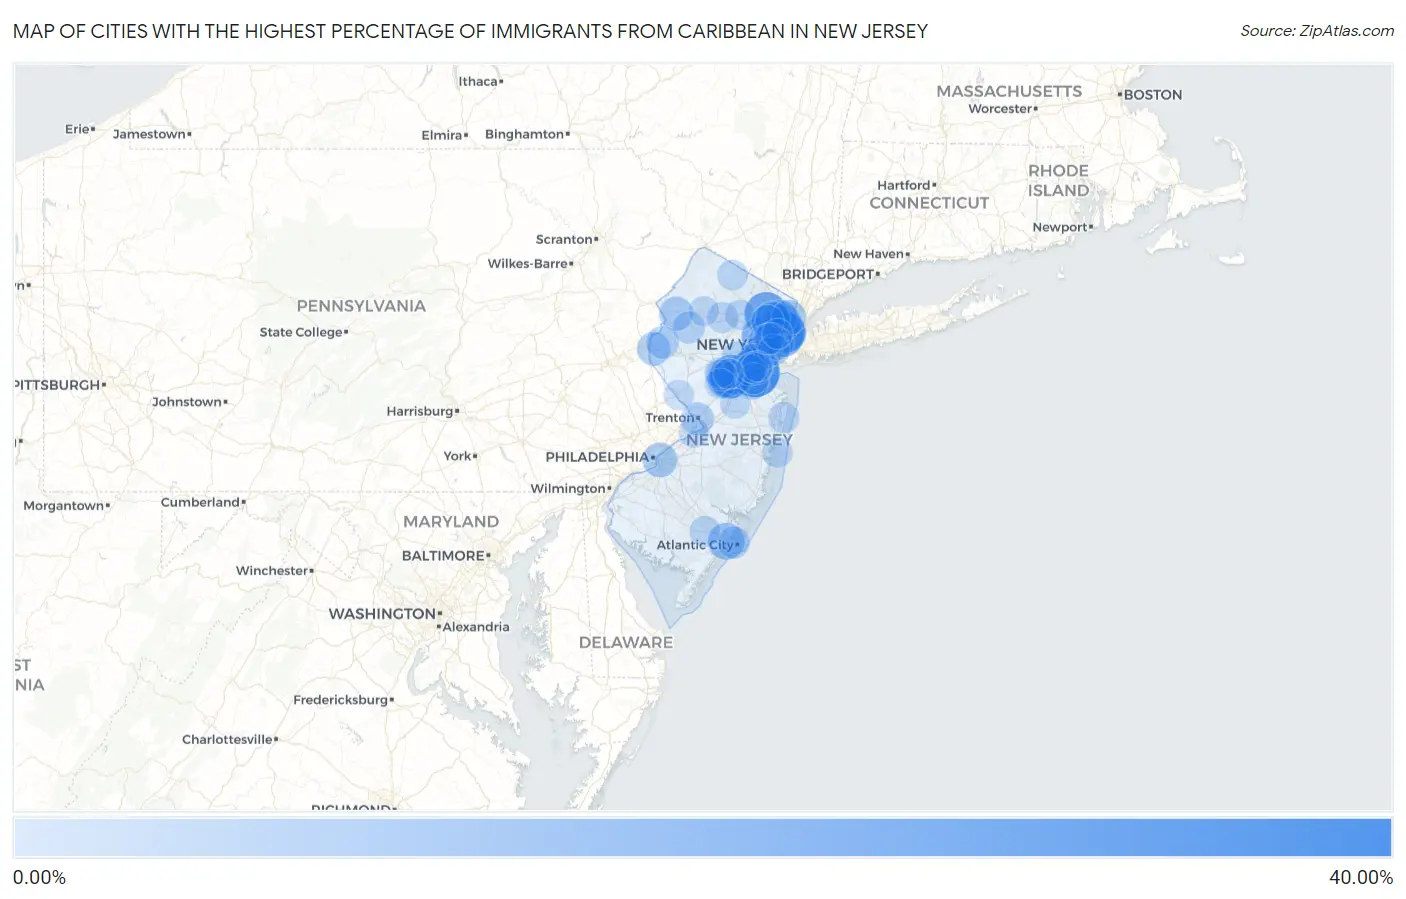
Map of Cities with the Highest Percentage of Immigrants from Caribbean in New Jersey
0.00%
40.00%
Cities with the Highest Percentage of Immigrants from Caribbean in New Jersey
| City | Caribbean | vs State | vs National | |
| 1. | Perth Amboy | 32.25% | 4.14%(+28.1)#74 | 1.37%(+30.9)#2,320 |
| 2. | Union | 25.29% | 4.14%(+21.1)#75 | 1.37%(+23.9)#2,321 |
| 3. | Paterson | 22.92% | 4.14%(+18.8)#76 | 1.37%(+21.5)#2,322 |
| 4. | East Franklin | 22.26% | 4.14%(+18.1)#77 | 1.37%(+20.9)#2,323 |
| 5. | West New York | 21.16% | 4.14%(+17.0)#78 | 1.37%(+19.8)#2,324 |
| 6. | Union City | 20.10% | 4.14%(+16.0)#79 | 1.37%(+18.7)#2,325 |
| 7. | Guttenberg | 18.73% | 4.14%(+14.6)#80 | 1.37%(+17.4)#2,326 |
| 8. | Keasbey | 17.63% | 4.14%(+13.5)#81 | 1.37%(+16.3)#2,327 |
| 9. | Voorhees | 17.35% | 4.14%(+13.2)#82 | 1.37%(+16.0)#2,328 |
| 10. | East Orange | 16.95% | 4.14%(+12.8)#83 | 1.37%(+15.6)#2,329 |
| 11. | Passaic | 16.72% | 4.14%(+12.6)#84 | 1.37%(+15.3)#2,330 |
| 12. | Roselle Borough | 13.63% | 4.14%(+9.49)#85 | 1.37%(+12.3)#2,331 |
| 13. | Ridgefield Park | 13.44% | 4.14%(+9.30)#86 | 1.37%(+12.1)#2,332 |
| 14. | Pleasantville | 12.81% | 4.14%(+8.68)#87 | 1.37%(+11.4)#2,333 |
| 15. | Prospect Park Borough | 12.65% | 4.14%(+8.51)#88 | 1.37%(+11.3)#2,334 |
| 16. | Elizabeth | 12.40% | 4.14%(+8.26)#89 | 1.37%(+11.0)#2,335 |
| 17. | Bogota Borough | 12.04% | 4.14%(+7.90)#90 | 1.37%(+10.7)#2,336 |
| 18. | Six Mile Run | 11.03% | 4.14%(+6.89)#91 | 1.37%(+9.66)#2,337 |
| 19. | Hackensack | 10.31% | 4.14%(+6.17)#92 | 1.37%(+8.93)#2,406 |
| 20. | Garfield | 9.94% | 4.14%(+5.80)#93 | 1.37%(+8.57)#2,407 |
| 21. | Fairview Borough | 9.93% | 4.14%(+5.79)#94 | 1.37%(+8.56)#2,408 |
| 22. | Englewood | 9.84% | 4.14%(+5.70)#95 | 1.37%(+8.47)#2,409 |
| 23. | Haledon Borough | 9.64% | 4.14%(+5.50)#96 | 1.37%(+8.26)#2,410 |
| 24. | Camden | 9.64% | 4.14%(+5.50)#97 | 1.37%(+8.26)#2,411 |
| 25. | Silver Lake Cdp Essex County | 9.26% | 4.14%(+5.12)#98 | 1.37%(+7.89)#2,412 |
| 26. | New Brunswick | 9.06% | 4.14%(+4.92)#99 | 1.37%(+7.68)#2,413 |
| 27. | Hope | 8.68% | 4.14%(+4.54)#100 | 1.37%(+7.30)#2,414 |
| 28. | Upper Pohatcong | 8.18% | 4.14%(+4.04)#101 | 1.37%(+6.81)#2,415 |
| 29. | Newark | 7.94% | 4.14%(+3.80)#102 | 1.37%(+6.57)#2,416 |
| 30. | Linden | 7.66% | 4.14%(+3.52)#103 | 1.37%(+6.29)#2,417 |
| 31. | Elmwood Park Borough | 7.53% | 4.14%(+3.39)#104 | 1.37%(+6.15)#2,418 |
| 32. | Ampere North | 7.44% | 4.14%(+3.30)#105 | 1.37%(+6.06)#2,419 |
| 33. | Watsessing | 7.28% | 4.14%(+3.14)#106 | 1.37%(+5.91)#2,420 |
| 34. | Cliffside Park Borough | 7.20% | 4.14%(+3.06)#107 | 1.37%(+5.83)#2,421 |
| 35. | South Toms River Borough | 6.99% | 4.14%(+2.85)#108 | 1.37%(+5.62)#2,422 |
| 36. | New Village | 6.96% | 4.14%(+2.82)#109 | 1.37%(+5.59)#2,423 |
| 37. | Trenton | 6.92% | 4.14%(+2.78)#110 | 1.37%(+5.55)#2,424 |
| 38. | Llewellyn Park | 6.90% | 4.14%(+2.76)#111 | 1.37%(+5.53)#2,425 |
| 39. | Bergenfield Borough | 6.85% | 4.14%(+2.71)#112 | 1.37%(+5.48)#2,426 |
| 40. | Jersey City | 6.74% | 4.14%(+2.60)#113 | 1.37%(+5.37)#2,427 |
| 41. | Teterboro Borough | 6.59% | 4.14%(+2.45)#114 | 1.37%(+5.22)#2,428 |
| 42. | Clifton | 6.57% | 4.14%(+2.43)#115 | 1.37%(+5.19)#2,429 |
| 43. | Woodlynne Borough | 6.30% | 4.14%(+2.16)#116 | 1.37%(+4.93)#2,430 |
| 44. | Little Ferry Borough | 6.28% | 4.14%(+2.14)#117 | 1.37%(+4.91)#2,431 |
| 45. | Hasbrouck Heights Borough | 6.24% | 4.14%(+2.10)#118 | 1.37%(+4.87)#2,432 |
| 46. | Neptune City Borough | 6.21% | 4.14%(+2.07)#119 | 1.37%(+4.84)#2,433 |
| 47. | Rahway | 6.15% | 4.14%(+2.01)#120 | 1.37%(+4.78)#2,434 |
| 48. | Atlantic City | 6.12% | 4.14%(+1.98)#121 | 1.37%(+4.75)#2,435 |
| 49. | Lodi Borough | 6.12% | 4.14%(+1.98)#122 | 1.37%(+4.75)#2,436 |
| 50. | Moonachie Borough | 6.01% | 4.14%(+1.87)#123 | 1.37%(+4.64)#2,437 |
| 51. | Beattystown | 6.01% | 4.14%(+1.87)#124 | 1.37%(+4.64)#2,438 |
| 52. | Plainfield | 5.98% | 4.14%(+1.84)#125 | 1.37%(+4.61)#2,439 |
| 53. | North Plainfield Borough | 5.60% | 4.14%(+1.47)#126 | 1.37%(+4.23)#2,440 |
| 54. | Kearny | 5.55% | 4.14%(+1.41)#127 | 1.37%(+4.18)#2,441 |
| 55. | Madison Park | 5.36% | 4.14%(+1.22)#128 | 1.37%(+3.98)#2,442 |
| 56. | Carteret Borough | 5.17% | 4.14%(+1.03)#129 | 1.37%(+3.80)#2,443 |
| 57. | Bayonne | 5.15% | 4.14%(+1.01)#130 | 1.37%(+3.77)#2,444 |
| 58. | Newtonville | 4.95% | 4.14%(+0.807)#131 | 1.37%(+3.57)#2,445 |
| 59. | Vauxhall | 4.88% | 4.14%(+0.737)#132 | 1.37%(+3.50)#2,446 |
| 60. | Fords | 4.87% | 4.14%(+0.733)#133 | 1.37%(+3.50)#2,447 |
| 61. | Sewaren | 4.86% | 4.14%(+0.721)#134 | 1.37%(+3.49)#2,448 |
| 62. | Hawthorne Borough | 4.72% | 4.14%(+0.584)#135 | 1.37%(+3.35)#2,449 |
| 63. | Sayreville Borough | 4.71% | 4.14%(+0.575)#136 | 1.37%(+3.34)#2,450 |
| 64. | New Milford Borough | 4.58% | 4.14%(+0.443)#137 | 1.37%(+3.21)#2,451 |
| 65. | Asbury Park | 4.53% | 4.14%(+0.393)#138 | 1.37%(+3.16)#2,452 |
| 66. | South Amboy | 4.46% | 4.14%(+0.316)#139 | 1.37%(+3.08)#2,453 |
| 67. | Wharton Borough | 4.41% | 4.14%(+0.267)#140 | 1.37%(+3.03)#2,454 |
| 68. | Rockaway Borough | 4.40% | 4.14%(+0.262)#141 | 1.37%(+3.03)#2,455 |
| 69. | East Millstone | 4.25% | 4.14%(+0.112)#142 | 1.37%(+2.88)#2,456 |
| 70. | Dover | 4.24% | 4.14%(+0.104)#143 | 1.37%(+2.87)#2,457 |
| 71. | Mays Landing | 4.22% | 4.14%(+0.082)#144 | 1.37%(+2.85)#2,458 |
| 72. | Harrison | 4.17% | 4.14%(+0.034)#145 | 1.37%(+2.80)#2,459 |
| 73. | Absecon Highlands | 4.12% | 4.14%(-0.015)#146 | 1.37%(+2.75)#2,460 |
| 74. | Lindenwold Borough | 4.05% | 4.14%(-0.090)#147 | 1.37%(+2.68)#2,461 |
| 75. | The Ponds | 4.03% | 4.14%(-0.105)#148 | 1.37%(+2.66)#2,462 |
| 76. | Bedminster | 3.97% | 4.14%(-0.171)#149 | 1.37%(+2.60)#2,463 |
| 77. | Woodbridge | 3.90% | 4.14%(-0.240)#150 | 1.37%(+2.53)#2,464 |
| 78. | Highland Lakes | 3.89% | 4.14%(-0.251)#151 | 1.37%(+2.52)#2,465 |
| 79. | Weston | 3.82% | 4.14%(-0.315)#152 | 1.37%(+2.45)#2,466 |
| 80. | Hopelawn | 3.78% | 4.14%(-0.360)#153 | 1.37%(+2.41)#2,467 |
| 81. | Dumont Borough | 3.75% | 4.14%(-0.393)#154 | 1.37%(+2.37)#2,468 |
| 82. | Boonton | 3.66% | 4.14%(-0.484)#155 | 1.37%(+2.28)#2,469 |
| 83. | Landing | 3.60% | 4.14%(-0.536)#156 | 1.37%(+2.23)#2,470 |
| 84. | Port Reading | 3.59% | 4.14%(-0.551)#157 | 1.37%(+2.22)#2,471 |
| 85. | Connecticut Farms | 3.58% | 4.14%(-0.561)#158 | 1.37%(+2.21)#2,472 |
| 86. | North Arlington Borough | 3.55% | 4.14%(-0.593)#159 | 1.37%(+2.17)#2,473 |
| 87. | East Newark Borough | 3.53% | 4.14%(-0.608)#160 | 1.37%(+2.16)#2,474 |
| 88. | Dover Beaches North | 3.48% | 4.14%(-0.661)#161 | 1.37%(+2.11)#2,475 |
| 89. | Byram Center | 3.45% | 4.14%(-0.686)#162 | 1.37%(+2.08)#2,476 |
| 90. | River Edge Borough | 3.44% | 4.14%(-0.696)#163 | 1.37%(+2.07)#2,477 |
| 91. | Roselle Park Borough | 3.39% | 4.14%(-0.745)#164 | 1.37%(+2.02)#2,478 |
| 92. | Florence | 3.30% | 4.14%(-0.838)#165 | 1.37%(+1.93)#2,479 |
| 93. | Lambertville | 3.30% | 4.14%(-0.844)#166 | 1.37%(+1.92)#2,480 |
| 94. | Ridgefield Borough | 3.29% | 4.14%(-0.851)#167 | 1.37%(+1.92)#2,481 |
| 95. | Maywood Borough | 3.27% | 4.14%(-0.873)#168 | 1.37%(+1.89)#2,482 |
| 96. | Secaucus | 3.26% | 4.14%(-0.879)#169 | 1.37%(+1.89)#2,483 |
| 97. | Pleasant Plains | 3.24% | 4.14%(-0.902)#170 | 1.37%(+1.87)#2,484 |
| 98. | Somerset | 3.23% | 4.14%(-0.914)#171 | 1.37%(+1.85)#2,485 |
| 99. | East Rutherford Borough | 3.17% | 4.14%(-0.966)#172 | 1.37%(+1.80)#2,486 |
| 100. | Concordia | 3.14% | 4.14%(-1.00)#173 | 1.37%(+1.76)#2,487 |
Common Questions
What are the Top 10 Cities with the Highest Percentage of Immigrants from Caribbean in New Jersey?
Top 10 Cities with the Highest Percentage of Immigrants from Caribbean in New Jersey are:
#1
32.25%
#2
22.92%
#3
22.26%
#4
21.16%
#5
20.10%
#6
18.73%
#7
17.35%
#8
16.95%
#9
16.72%
#10
13.44%
What city has the Highest Percentage of Immigrants from Caribbean in New Jersey?
Perth Amboy has the Highest Percentage of Immigrants from Caribbean in New Jersey with 32.25%.
What is the Percentage of Immigrants from Caribbean in the State of New Jersey?
Percentage of Immigrants from Caribbean in New Jersey is 4.14%.
What is the Percentage of Immigrants from Caribbean in the United States?
Percentage of Immigrants from Caribbean in the United States is 1.37%.