Cities with the Lowest Births per 1,000 Women in Labor Force in New Jersey
RELATED REPORTS & OPTIONS
Lowest Birth Rate | In Labor Force
New Jersey
Compare Cities
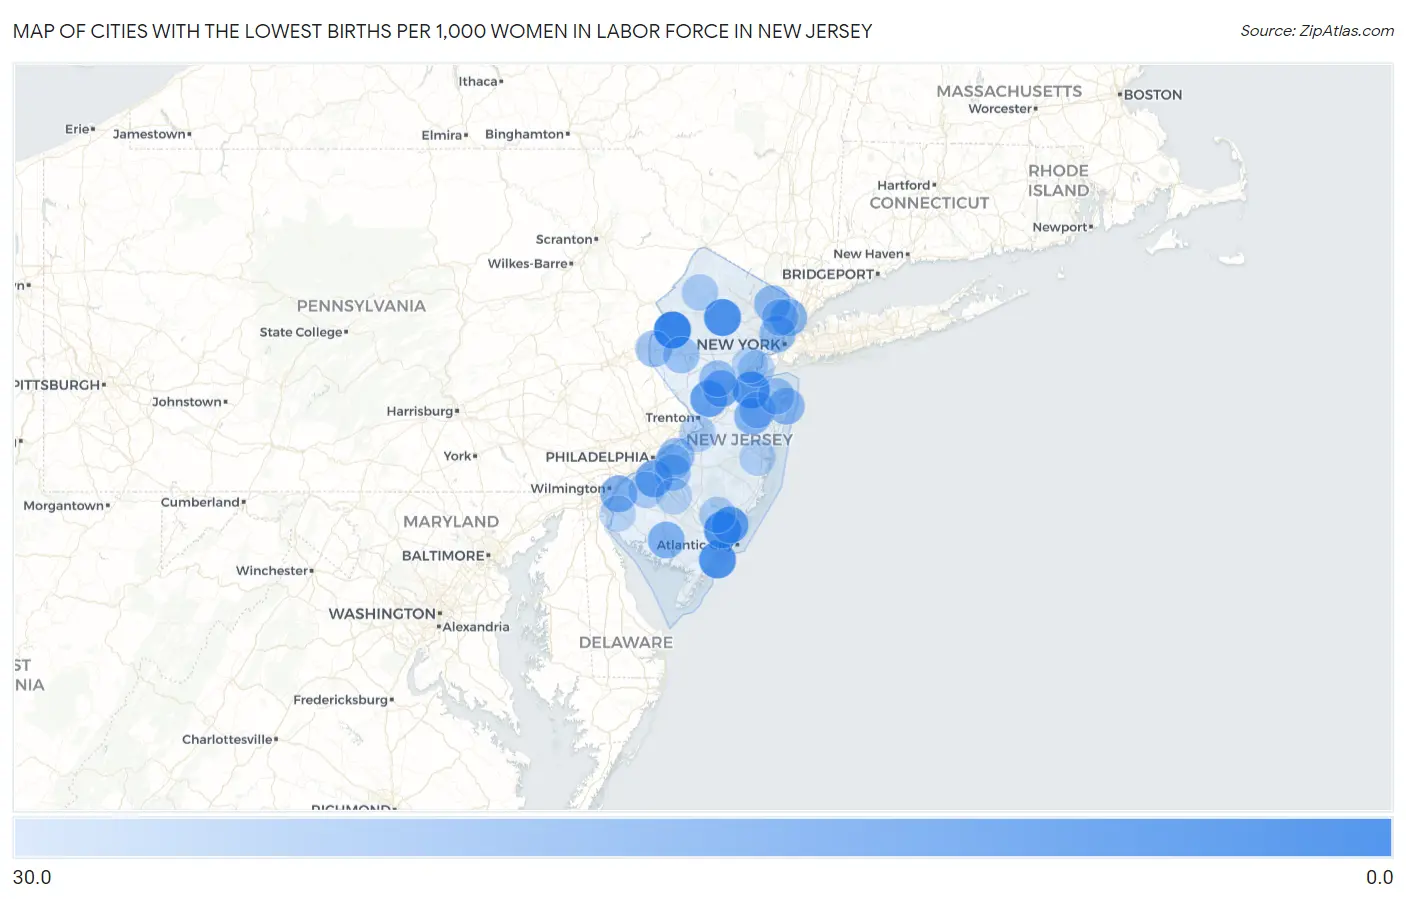
Map of Cities with the Lowest Births per 1,000 Women in Labor Force in New Jersey
30.0
0.0
Cities with the Lowest Births per 1,000 Women in Labor Force in New Jersey
| City | Births / 1,000 Women | vs State | vs National | |
| 1. | Oxford | 4.0 | 50.0(-46.0)#1 | 48.0(-44.0)#53 |
| 2. | Keansburg Borough | 5.0 | 50.0(-45.0)#2 | 48.0(-43.0)#68 |
| 3. | Rumson Borough | 5.0 | 50.0(-45.0)#3 | 48.0(-43.0)#72 |
| 4. | Franklin Borough | 6.0 | 50.0(-44.0)#4 | 48.0(-42.0)#116 |
| 5. | Dover | 8.0 | 50.0(-42.0)#5 | 48.0(-40.0)#203 |
| 6. | Ringwood Borough | 9.0 | 50.0(-41.0)#6 | 48.0(-39.0)#290 |
| 7. | Ocean City | 9.0 | 50.0(-41.0)#7 | 48.0(-39.0)#291 |
| 8. | Pomona | 9.0 | 50.0(-41.0)#8 | 48.0(-39.0)#297 |
| 9. | Packanack Lake | 9.0 | 50.0(-41.0)#9 | 48.0(-39.0)#311 |
| 10. | Old Tappan Borough | 9.0 | 50.0(-41.0)#10 | 48.0(-39.0)#313 |
| 11. | High Bridge Borough | 9.0 | 50.0(-41.0)#11 | 48.0(-39.0)#324 |
| 12. | Brownville | 9.0 | 50.0(-41.0)#12 | 48.0(-39.0)#340 |
| 13. | Lake Como Borough | 9.0 | 50.0(-41.0)#13 | 48.0(-39.0)#347 |
| 14. | Bay Head Borough | 9.0 | 50.0(-41.0)#14 | 48.0(-39.0)#362 |
| 15. | Cresskill Borough | 10.0 | 50.0(-40.0)#15 | 48.0(-38.0)#390 |
| 16. | Pennington Borough | 10.0 | 50.0(-40.0)#16 | 48.0(-38.0)#429 |
| 17. | Brielle Borough | 12.0 | 50.0(-38.0)#17 | 48.0(-36.0)#632 |
| 18. | Princeton | 13.0 | 50.0(-37.0)#18 | 48.0(-35.0)#711 |
| 19. | Collingswood Borough | 13.0 | 50.0(-37.0)#19 | 48.0(-35.0)#726 |
| 20. | Smithville | 13.0 | 50.0(-37.0)#20 | 48.0(-35.0)#732 |
| 21. | Bargaintown | 13.0 | 50.0(-37.0)#21 | 48.0(-35.0)#755 |
| 22. | Folsom Borough | 13.0 | 50.0(-37.0)#22 | 48.0(-35.0)#804 |
| 23. | Farmingdale Borough | 13.0 | 50.0(-37.0)#23 | 48.0(-35.0)#813 |
| 24. | Bernardsville Borough | 14.0 | 50.0(-36.0)#24 | 48.0(-34.0)#880 |
| 25. | Medford Lakes Borough | 14.0 | 50.0(-36.0)#25 | 48.0(-34.0)#901 |
| 26. | Hi Nella Borough | 14.0 | 50.0(-36.0)#26 | 48.0(-34.0)#963 |
| 27. | North Haledon Borough | 15.0 | 50.0(-35.0)#27 | 48.0(-33.0)#1,013 |
| 28. | Oak Valley | 15.0 | 50.0(-35.0)#28 | 48.0(-33.0)#1,032 |
| 29. | Keasbey | 15.0 | 50.0(-35.0)#29 | 48.0(-33.0)#1,051 |
| 30. | Laurel Springs Borough | 15.0 | 50.0(-35.0)#30 | 48.0(-33.0)#1,064 |
| 31. | Springfield | 15.0 | 50.0(-35.0)#31 | 48.0(-33.0)#1,078 |
| 32. | West Long Branch Borough | 16.0 | 50.0(-34.0)#32 | 48.0(-32.0)#1,147 |
| 33. | Mountain Lakes Borough | 16.0 | 50.0(-34.0)#33 | 48.0(-32.0)#1,176 |
| 34. | Monmouth Beach Borough | 16.0 | 50.0(-34.0)#34 | 48.0(-32.0)#1,189 |
| 35. | Woodbine Borough | 16.0 | 50.0(-34.0)#35 | 48.0(-32.0)#1,206 |
| 36. | Millstone Borough | 16.0 | 50.0(-34.0)#36 | 48.0(-32.0)#1,261 |
| 37. | Kendall Park | 17.0 | 50.0(-33.0)#37 | 48.0(-31.0)#1,305 |
| 38. | Flanders | 17.0 | 50.0(-33.0)#38 | 48.0(-31.0)#1,309 |
| 39. | Oradell Borough | 17.0 | 50.0(-33.0)#39 | 48.0(-31.0)#1,314 |
| 40. | Atco | 17.0 | 50.0(-33.0)#40 | 48.0(-31.0)#1,315 |
| 41. | Glen Gardner Borough | 17.0 | 50.0(-33.0)#41 | 48.0(-31.0)#1,383 |
| 42. | Califon Borough | 17.0 | 50.0(-33.0)#42 | 48.0(-31.0)#1,402 |
| 43. | Carneys Point | 18.0 | 50.0(-32.0)#43 | 48.0(-30.0)#1,481 |
| 44. | Rockaway Borough | 18.0 | 50.0(-32.0)#44 | 48.0(-30.0)#1,495 |
| 45. | Morris Plains Borough | 18.0 | 50.0(-32.0)#45 | 48.0(-30.0)#1,498 |
| 46. | Union Beach Borough | 18.0 | 50.0(-32.0)#46 | 48.0(-30.0)#1,500 |
| 47. | Englewood | 19.0 | 50.0(-31.0)#47 | 48.0(-29.0)#1,625 |
| 48. | Millville | 19.0 | 50.0(-31.0)#48 | 48.0(-29.0)#1,628 |
| 49. | Westwood Borough | 19.0 | 50.0(-31.0)#49 | 48.0(-29.0)#1,653 |
| 50. | Brooklawn Borough | 19.0 | 50.0(-31.0)#50 | 48.0(-29.0)#1,725 |
| 51. | Andover Borough | 19.0 | 50.0(-31.0)#51 | 48.0(-29.0)#1,762 |
| 52. | West Freehold | 20.0 | 50.0(-30.0)#52 | 48.0(-28.0)#1,811 |
| 53. | Clayton Borough | 20.0 | 50.0(-30.0)#53 | 48.0(-28.0)#1,825 |
| 54. | Demarest Borough | 20.0 | 50.0(-30.0)#54 | 48.0(-28.0)#1,855 |
| 55. | Spring Lake Heights Borough | 20.0 | 50.0(-30.0)#55 | 48.0(-28.0)#1,857 |
| 56. | Riverton Borough | 20.0 | 50.0(-30.0)#56 | 48.0(-28.0)#1,878 |
| 57. | Long Branch | 21.0 | 50.0(-29.0)#57 | 48.0(-27.0)#1,969 |
| 58. | Ridgewood | 21.0 | 50.0(-29.0)#58 | 48.0(-27.0)#1,971 |
| 59. | Woodstown Borough | 21.0 | 50.0(-29.0)#59 | 48.0(-27.0)#2,044 |
| 60. | Secaucus | 22.0 | 50.0(-28.0)#60 | 48.0(-26.0)#2,152 |
| 61. | Moorestown Lenola | 22.0 | 50.0(-28.0)#61 | 48.0(-26.0)#2,169 |
| 62. | Tenafly Borough | 23.0 | 50.0(-27.0)#62 | 48.0(-25.0)#2,351 |
| 63. | Echelon | 23.0 | 50.0(-27.0)#63 | 48.0(-25.0)#2,354 |
| 64. | Blackwells Mills | 23.0 | 50.0(-27.0)#64 | 48.0(-25.0)#2,366 |
| 65. | Rutgers University-Busch Campus | 23.0 | 50.0(-27.0)#65 | 48.0(-25.0)#2,381 |
| 66. | East Freehold | 23.0 | 50.0(-27.0)#66 | 48.0(-25.0)#2,396 |
| 67. | Northvale Borough | 23.0 | 50.0(-27.0)#67 | 48.0(-25.0)#2,399 |
| 68. | Upper Pohatcong | 23.0 | 50.0(-27.0)#68 | 48.0(-25.0)#2,446 |
| 69. | Pemberton Borough | 23.0 | 50.0(-27.0)#69 | 48.0(-25.0)#2,461 |
| 70. | Hackensack | 24.0 | 50.0(-26.0)#70 | 48.0(-24.0)#2,540 |
| 71. | Eatontown Borough | 24.0 | 50.0(-26.0)#71 | 48.0(-24.0)#2,568 |
| 72. | Pompton Lakes Borough | 24.0 | 50.0(-26.0)#72 | 48.0(-24.0)#2,583 |
| 73. | Fairview | 24.0 | 50.0(-26.0)#73 | 48.0(-24.0)#2,616 |
| 74. | Oaklyn Borough | 24.0 | 50.0(-26.0)#74 | 48.0(-24.0)#2,619 |
| 75. | Sewell | 24.0 | 50.0(-26.0)#75 | 48.0(-24.0)#2,630 |
| 76. | Clinton | 24.0 | 50.0(-26.0)#76 | 48.0(-24.0)#2,636 |
| 77. | Point Pleasant Beach Borough | 26.0 | 50.0(-24.0)#77 | 48.0(-22.0)#3,009 |
| 78. | Sussex Borough | 26.0 | 50.0(-24.0)#78 | 48.0(-22.0)#3,046 |
| 79. | Lebanon Borough | 26.0 | 50.0(-24.0)#79 | 48.0(-22.0)#3,050 |
| 80. | North Plainfield Borough | 27.0 | 50.0(-23.0)#80 | 48.0(-21.0)#3,140 |
| 81. | Haledon Borough | 27.0 | 50.0(-23.0)#81 | 48.0(-21.0)#3,175 |
| 82. | Newton | 27.0 | 50.0(-23.0)#82 | 48.0(-21.0)#3,178 |
| 83. | Kingston Estates | 27.0 | 50.0(-23.0)#83 | 48.0(-21.0)#3,185 |
| 84. | Bridgewater Center | 27.0 | 50.0(-23.0)#84 | 48.0(-21.0)#3,190 |
| 85. | Jamesburg Borough | 27.0 | 50.0(-23.0)#85 | 48.0(-21.0)#3,195 |
| 86. | Mullica Hill | 27.0 | 50.0(-23.0)#86 | 48.0(-21.0)#3,207 |
| 87. | Egg Harbor City | 27.0 | 50.0(-23.0)#87 | 48.0(-21.0)#3,208 |
| 88. | Roebling | 27.0 | 50.0(-23.0)#88 | 48.0(-21.0)#3,211 |
| 89. | Hopelawn | 27.0 | 50.0(-23.0)#89 | 48.0(-21.0)#3,231 |
| 90. | Sewaren | 27.0 | 50.0(-23.0)#90 | 48.0(-21.0)#3,236 |
| 91. | Little Ferry Borough | 28.0 | 50.0(-22.0)#91 | 48.0(-20.0)#3,366 |
| 92. | Watsessing | 28.0 | 50.0(-22.0)#92 | 48.0(-20.0)#3,383 |
| 93. | Holiday City South | 28.0 | 50.0(-22.0)#93 | 48.0(-20.0)#3,402 |
| 94. | Glassboro Borough | 29.0 | 50.0(-21.0)#94 | 48.0(-19.0)#3,520 |
| 95. | Iselin | 29.0 | 50.0(-21.0)#95 | 48.0(-19.0)#3,528 |
| 96. | Williamstown | 29.0 | 50.0(-21.0)#96 | 48.0(-19.0)#3,534 |
| 97. | Park Ridge Borough | 29.0 | 50.0(-21.0)#97 | 48.0(-19.0)#3,549 |
| 98. | Salem | 29.0 | 50.0(-21.0)#98 | 48.0(-19.0)#3,575 |
| 99. | Neptune City Borough | 29.0 | 50.0(-21.0)#99 | 48.0(-19.0)#3,579 |
| 100. | Cedar Knolls | 29.0 | 50.0(-21.0)#100 | 48.0(-19.0)#3,583 |
Common Questions
What are the Top 10 Cities with the Lowest Births per 1,000 Women in Labor Force in New Jersey?
Top 10 Cities with the Lowest Births per 1,000 Women in Labor Force in New Jersey are:
#1
4.0
#2
8.0
#3
9.0
#4
9.0
#5
9.0
#6
13.0
#7
13.0
#8
15.0
#9
17.0
#10
18.0
What city has the Lowest Births per 1,000 Women in Labor Force in New Jersey?
Oxford has the Lowest Births per 1,000 Women in Labor Force in New Jersey with 4.0.
What is the Number Births per 1,000 Women in Labor Force in the State of New Jersey?
Number Births per 1,000 Women in Labor Force in New Jersey is 50.0.
What is the Number Births per 1,000 Women in Labor Force in the United States?
Number Births per 1,000 Women in Labor Force in the United States is 48.0.