Cities with the Highest Percentage of Immigrants from Philippines in New Jersey
RELATED REPORTS & OPTIONS
Philippines
New Jersey
Compare Cities
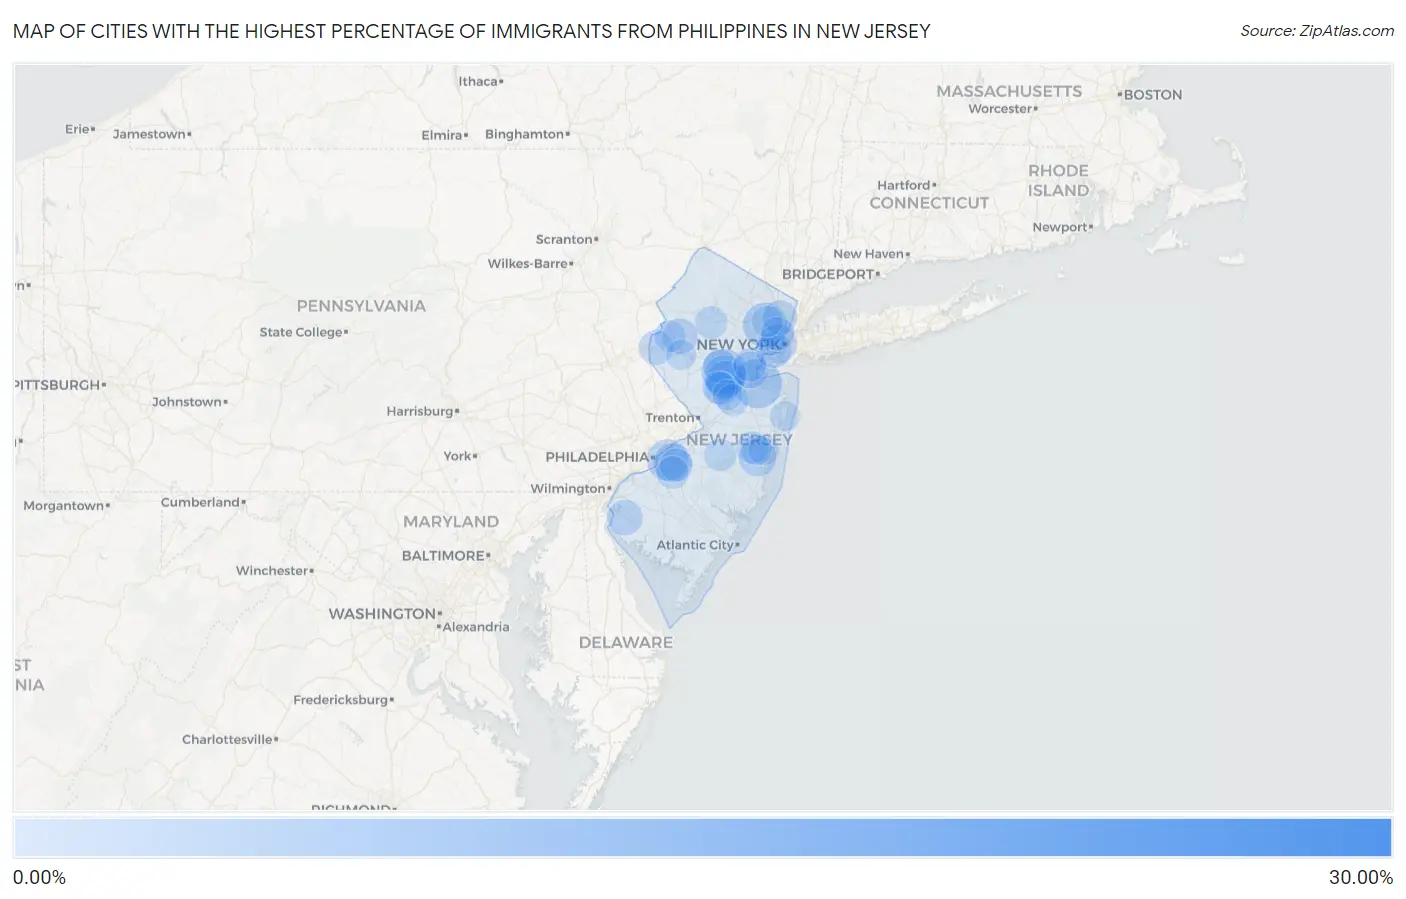
Map of Cities with the Highest Percentage of Immigrants from Philippines in New Jersey
0.00%
30.00%
Cities with the Highest Percentage of Immigrants from Philippines in New Jersey
| City | Philippines | vs State | vs National | |
| 1. | Springfield | 29.98% | 0.93%(+29.1)#-1 | 0.60%(+29.4)#0 |
| 2. | Connecticut Farms | 24.25% | 0.93%(+23.3)#0 | 0.60%(+23.7)#1 |
| 3. | Bergenfield Borough | 12.10% | 0.93%(+11.2)#40 | 0.60%(+11.5)#814 |
| 4. | Sunset Lake | 9.42% | 0.93%(+8.49)#41 | 0.60%(+8.82)#815 |
| 5. | Silver Lake Cdp Essex County | 9.24% | 0.93%(+8.31)#42 | 0.60%(+8.64)#816 |
| 6. | Dumont Borough | 7.94% | 0.93%(+7.01)#43 | 0.60%(+7.34)#817 |
| 7. | Rainbow Lakes | 7.50% | 0.93%(+6.57)#44 | 0.60%(+6.90)#818 |
| 8. | Raritan Borough | 6.72% | 0.93%(+5.79)#45 | 0.60%(+6.12)#819 |
| 9. | New Milford Borough | 6.70% | 0.93%(+5.77)#46 | 0.60%(+6.10)#820 |
| 10. | Laurence Harbor | 6.54% | 0.93%(+5.61)#47 | 0.60%(+5.94)#821 |
| 11. | Encore At Monroe | 5.82% | 0.93%(+4.89)#48 | 0.60%(+5.22)#822 |
| 12. | Franklin Center | 5.34% | 0.93%(+4.41)#49 | 0.60%(+4.74)#823 |
| 13. | Brookdale | 5.29% | 0.93%(+4.36)#50 | 0.60%(+4.69)#824 |
| 14. | Middlebush | 4.69% | 0.93%(+3.76)#51 | 0.60%(+4.09)#825 |
| 15. | Hasbrouck Heights Borough | 4.40% | 0.93%(+3.47)#52 | 0.60%(+3.80)#826 |
| 16. | Golden Triangle | 4.35% | 0.93%(+3.43)#53 | 0.60%(+3.76)#827 |
| 17. | Englewood Cliffs Borough | 4.23% | 0.93%(+3.30)#54 | 0.60%(+3.63)#828 |
| 18. | Jersey City | 3.85% | 0.93%(+2.92)#55 | 0.60%(+3.25)#1,036 |
| 19. | Emerson Borough | 3.85% | 0.93%(+2.92)#56 | 0.60%(+3.25)#1,037 |
| 20. | Somerville Borough | 3.79% | 0.93%(+2.86)#57 | 0.60%(+3.19)#1,038 |
| 21. | Kingston Estates | 3.66% | 0.93%(+2.73)#58 | 0.60%(+3.06)#1,039 |
| 22. | Westwood Borough | 3.66% | 0.93%(+2.73)#59 | 0.60%(+3.06)#1,040 |
| 23. | Six Mile Run | 3.62% | 0.93%(+2.69)#60 | 0.60%(+3.02)#1,041 |
| 24. | Holiday City South | 3.45% | 0.93%(+2.52)#61 | 0.60%(+2.85)#1,042 |
| 25. | Maywood Borough | 3.43% | 0.93%(+2.50)#62 | 0.60%(+2.83)#1,043 |
| 26. | West Berlin | 3.31% | 0.93%(+2.38)#63 | 0.60%(+2.71)#1,044 |
| 27. | Fords | 3.10% | 0.93%(+2.17)#64 | 0.60%(+2.50)#1,045 |
| 28. | East Rutherford Borough | 3.09% | 0.93%(+2.16)#65 | 0.60%(+2.49)#1,046 |
| 29. | Carteret Borough | 2.98% | 0.93%(+2.06)#66 | 0.60%(+2.39)#1,047 |
| 30. | Pompton Lakes Borough | 2.90% | 0.93%(+1.97)#67 | 0.60%(+2.30)#1,048 |
| 31. | Bayonne | 2.88% | 0.93%(+1.95)#68 | 0.60%(+2.28)#1,063 |
| 32. | Anderson | 2.86% | 0.93%(+1.93)#69 | 0.60%(+2.26)#1,064 |
| 33. | Regency At Monroe | 2.85% | 0.93%(+1.92)#70 | 0.60%(+2.25)#1,065 |
| 34. | Monroe Manor | 2.82% | 0.93%(+1.90)#71 | 0.60%(+2.22)#1,066 |
| 35. | Quinton | 2.80% | 0.93%(+1.87)#72 | 0.60%(+2.20)#1,067 |
| 36. | Menlo Park Terrace | 2.79% | 0.93%(+1.86)#73 | 0.60%(+2.19)#1,068 |
| 37. | Greenwich | 2.65% | 0.93%(+1.72)#74 | 0.60%(+2.05)#1,069 |
| 38. | Hackensack | 2.60% | 0.93%(+1.67)#75 | 0.60%(+2.00)#1,070 |
| 39. | Lodi Borough | 2.56% | 0.93%(+1.63)#76 | 0.60%(+1.96)#1,071 |
| 40. | Eatontown Borough | 2.55% | 0.93%(+1.62)#77 | 0.60%(+1.95)#1,072 |
| 41. | Bogota Borough | 2.46% | 0.93%(+1.53)#78 | 0.60%(+1.86)#1,073 |
| 42. | South Plainfield Borough | 2.46% | 0.93%(+1.53)#79 | 0.60%(+1.86)#1,074 |
| 43. | Wharton Borough | 2.42% | 0.93%(+1.50)#80 | 0.60%(+1.83)#1,075 |
| 44. | Union | 2.42% | 0.93%(+1.49)#81 | 0.60%(+1.82)#1,076 |
| 45. | Lake Hiawatha | 2.40% | 0.93%(+1.48)#82 | 0.60%(+1.80)#1,077 |
| 46. | Mckee | 2.38% | 0.93%(+1.45)#83 | 0.60%(+1.78)#1,078 |
| 47. | Frenchtown Borough | 2.38% | 0.93%(+1.45)#84 | 0.60%(+1.78)#1,079 |
| 48. | Highland Park Borough | 2.34% | 0.93%(+1.41)#85 | 0.60%(+1.74)#1,080 |
| 49. | Secaucus | 2.29% | 0.93%(+1.36)#86 | 0.60%(+1.69)#1,081 |
| 50. | High Bridge Borough | 2.27% | 0.93%(+1.34)#87 | 0.60%(+1.67)#1,082 |
| 51. | Old Tappan Borough | 2.27% | 0.93%(+1.34)#88 | 0.60%(+1.67)#1,083 |
| 52. | Finderne | 2.26% | 0.93%(+1.33)#89 | 0.60%(+1.66)#1,084 |
| 53. | Kendall Park | 2.21% | 0.93%(+1.28)#90 | 0.60%(+1.61)#1,085 |
| 54. | Iselin | 2.14% | 0.93%(+1.22)#91 | 0.60%(+1.54)#1,086 |
| 55. | Greentree | 2.14% | 0.93%(+1.21)#92 | 0.60%(+1.54)#1,087 |
| 56. | Little Ferry Borough | 2.08% | 0.93%(+1.15)#93 | 0.60%(+1.48)#1,088 |
| 57. | Succasunna | 2.05% | 0.93%(+1.12)#94 | 0.60%(+1.45)#1,089 |
| 58. | Ten Mile Run | 2.05% | 0.93%(+1.12)#95 | 0.60%(+1.45)#1,090 |
| 59. | Browns Mills | 2.04% | 0.93%(+1.11)#96 | 0.60%(+1.44)#1,091 |
| 60. | Echelon | 2.02% | 0.93%(+1.09)#97 | 0.60%(+1.42)#1,092 |
| 61. | Leisure Knoll | 2.02% | 0.93%(+1.09)#98 | 0.60%(+1.42)#1,093 |
| 62. | Paramus Borough | 2.00% | 0.93%(+1.07)#99 | 0.60%(+1.40)#1,094 |
| 63. | Englishtown Borough | 1.97% | 0.93%(+1.04)#100 | 0.60%(+1.37)#1,095 |
| 64. | Clementon Borough | 1.94% | 0.93%(+1.01)#101 | 0.60%(+1.34)#1,096 |
| 65. | Hi Nella Borough | 1.93% | 0.93%(+0.996)#102 | 0.60%(+1.33)#1,097 |
| 66. | Allentown Borough | 1.87% | 0.93%(+0.942)#103 | 0.60%(+1.27)#1,098 |
| 67. | Ridgefield Borough | 1.87% | 0.93%(+0.937)#104 | 0.60%(+1.27)#1,099 |
| 68. | Magnolia Borough | 1.82% | 0.93%(+0.890)#105 | 0.60%(+1.22)#1,100 |
| 69. | Fort Lee Borough | 1.81% | 0.93%(+0.880)#106 | 0.60%(+1.21)#1,101 |
| 70. | Rossmoor | 1.80% | 0.93%(+0.875)#107 | 0.60%(+1.20)#1,102 |
| 71. | Forsgate | 1.78% | 0.93%(+0.853)#108 | 0.60%(+1.18)#1,103 |
| 72. | Elmwood Park Borough | 1.77% | 0.93%(+0.839)#109 | 0.60%(+1.17)#1,104 |
| 73. | Brass Castle | 1.77% | 0.93%(+0.838)#110 | 0.60%(+1.17)#1,105 |
| 74. | Cresskill Borough | 1.76% | 0.93%(+0.828)#111 | 0.60%(+1.16)#1,106 |
| 75. | Stratford Borough | 1.74% | 0.93%(+0.809)#112 | 0.60%(+1.14)#1,107 |
| 76. | Hewitt | 1.73% | 0.93%(+0.803)#113 | 0.60%(+1.13)#1,108 |
| 77. | Wood Ridge Borough | 1.72% | 0.93%(+0.795)#114 | 0.60%(+1.12)#1,109 |
| 78. | Clifton | 1.68% | 0.93%(+0.754)#115 | 0.60%(+1.08)#1,189 |
| 79. | Carlstadt Borough | 1.67% | 0.93%(+0.743)#116 | 0.60%(+1.07)#1,190 |
| 80. | Hillsborough | 1.65% | 0.93%(+0.717)#117 | 0.60%(+1.05)#1,191 |
| 81. | Bellmawr Borough | 1.64% | 0.93%(+0.707)#118 | 0.60%(+1.04)#1,192 |
| 82. | Woodland Park Borough | 1.59% | 0.93%(+0.658)#119 | 0.60%(+0.988)#1,193 |
| 83. | Rutherford Borough | 1.58% | 0.93%(+0.655)#120 | 0.60%(+0.984)#1,194 |
| 84. | Wanaque Borough | 1.52% | 0.93%(+0.595)#121 | 0.60%(+0.925)#1,195 |
| 85. | Clinton | 1.48% | 0.93%(+0.548)#122 | 0.60%(+0.878)#1,196 |
| 86. | River Edge Borough | 1.47% | 0.93%(+0.543)#123 | 0.60%(+0.873)#1,197 |
| 87. | Palermo | 1.47% | 0.93%(+0.539)#124 | 0.60%(+0.868)#1,198 |
| 88. | Sussex Borough | 1.46% | 0.93%(+0.531)#125 | 0.60%(+0.860)#1,199 |
| 89. | Hightstown Borough | 1.45% | 0.93%(+0.520)#126 | 0.60%(+0.850)#1,200 |
| 90. | Gibbsboro Borough | 1.45% | 0.93%(+0.520)#127 | 0.60%(+0.849)#1,201 |
| 91. | Laurel Springs Borough | 1.45% | 0.93%(+0.518)#128 | 0.60%(+0.847)#1,202 |
| 92. | Toms River | 1.45% | 0.93%(+0.518)#129 | 0.60%(+0.847)#1,235 |
| 93. | Far Hills Borough | 1.43% | 0.93%(+0.504)#130 | 0.60%(+0.833)#1,236 |
| 94. | Dayton | 1.42% | 0.93%(+0.494)#131 | 0.60%(+0.824)#1,237 |
| 95. | Pine Lake Park | 1.40% | 0.93%(+0.471)#132 | 0.60%(+0.801)#1,238 |
| 96. | Sayreville Borough | 1.40% | 0.93%(+0.471)#133 | 0.60%(+0.800)#1,239 |
| 97. | New Providence Borough | 1.39% | 0.93%(+0.461)#134 | 0.60%(+0.790)#1,240 |
| 98. | Barnegat Light Borough | 1.38% | 0.93%(+0.450)#135 | 0.60%(+0.780)#1,241 |
| 99. | North Arlington Borough | 1.38% | 0.93%(+0.447)#136 | 0.60%(+0.776)#1,242 |
| 100. | Loch Arbour | 1.36% | 0.93%(+0.435)#137 | 0.60%(+0.764)#1,243 |
Common Questions
What are the Top 10 Cities with the Highest Percentage of Immigrants from Philippines in New Jersey?
Top 10 Cities with the Highest Percentage of Immigrants from Philippines in New Jersey are:
#1
6.54%
#2
5.34%
#3
5.29%
#4
4.69%
#5
4.35%
#6
3.85%
#7
3.66%
#8
3.62%
#9
3.45%
#10
3.10%
What city has the Highest Percentage of Immigrants from Philippines in New Jersey?
Laurence Harbor has the Highest Percentage of Immigrants from Philippines in New Jersey with 6.54%.
What is the Percentage of Immigrants from Philippines in the State of New Jersey?
Percentage of Immigrants from Philippines in New Jersey is 0.93%.
What is the Percentage of Immigrants from Philippines in the United States?
Percentage of Immigrants from Philippines in the United States is 0.60%.