Zip Codes with the Highest Percentage of Population Employed in Life, Physical & Social Science in Montclair, NJ
RELATED REPORTS & OPTIONS
Life, Physical & Social Science
Montclair
Compare Zip Codes
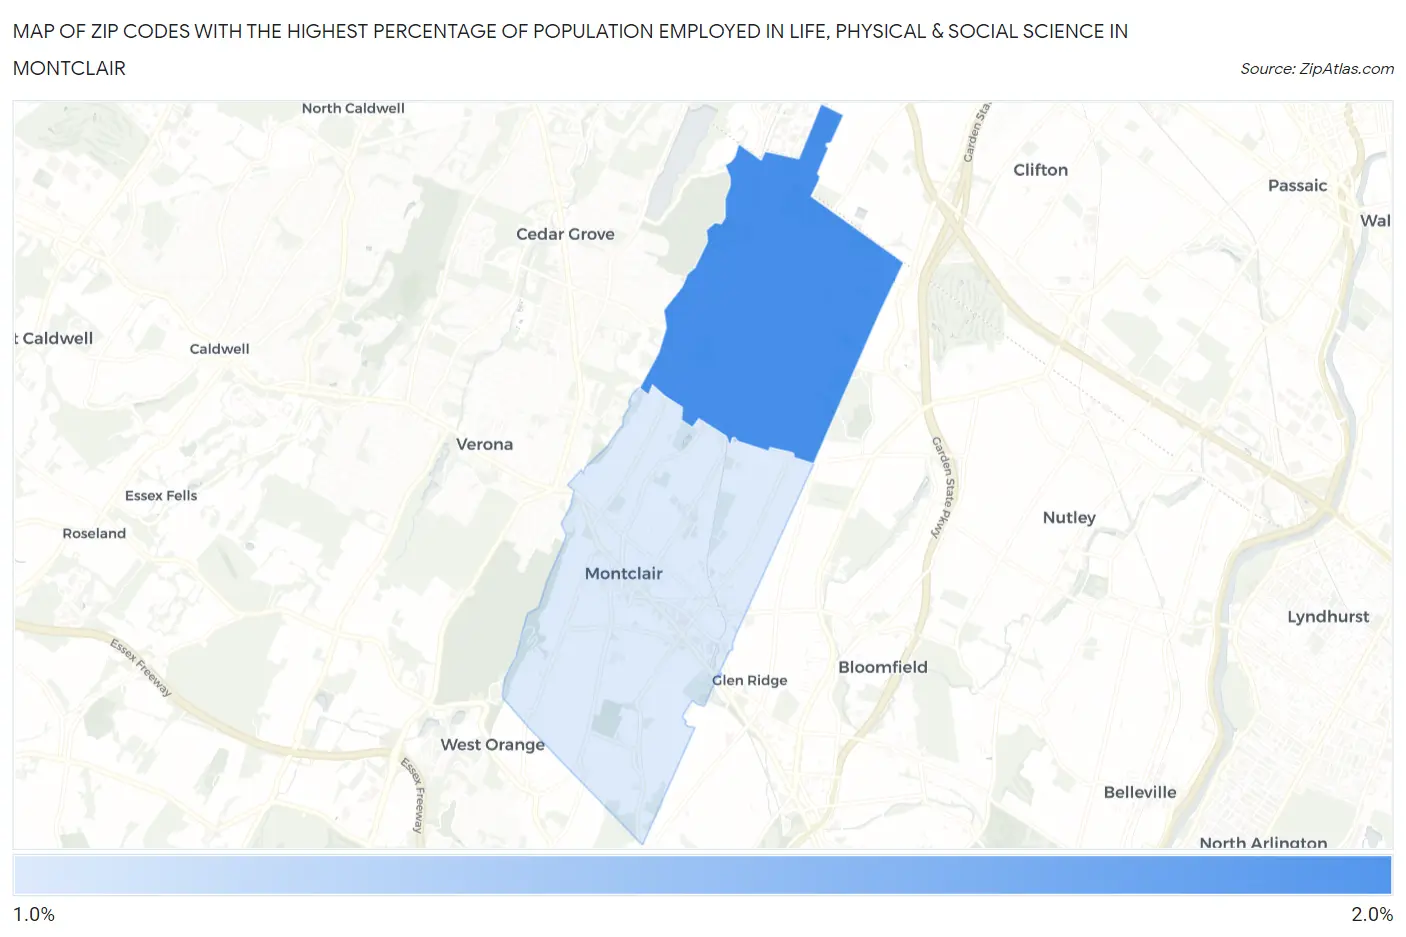
Map of Zip Codes with the Highest Percentage of Population Employed in Life, Physical & Social Science in Montclair
1.1%
1.8%
Zip Codes with the Highest Percentage of Population Employed in Life, Physical & Social Science in Montclair, NJ
| Zip Code | % Employed | vs State | vs National | |
| 1. | 07043 | 1.8% | 1.3%(+0.584)#130 | 1.1%(+0.747)#4,185 |
| 2. | 07042 | 1.1% | 1.3%(-0.145)#261 | 1.1%(+0.018)#8,158 |
1
Common Questions
What are the Top Zip Codes with the Highest Percentage of Population Employed in Life, Physical & Social Science in Montclair, NJ?
Top Zip Codes with the Highest Percentage of Population Employed in Life, Physical & Social Science in Montclair, NJ are:
What zip code has the Highest Percentage of Population Employed in Life, Physical & Social Science in Montclair, NJ?
07043 has the Highest Percentage of Population Employed in Life, Physical & Social Science in Montclair, NJ with 1.8%.
What is the Percentage of Population Employed in Life, Physical & Social Science in New Jersey?
Percentage of Population Employed in Life, Physical & Social Science in New Jersey is 1.3%.
What is the Percentage of Population Employed in Life, Physical & Social Science in the United States?
Percentage of Population Employed in Life, Physical & Social Science in the United States is 1.1%.