Sewaren, NJ Map & Demographics
Sewaren Map
Sewaren Overview
$47,387
PER CAPITA INCOME
$112,101
AVG FAMILY INCOME
$107,887
AVG HOUSEHOLD INCOME
7.0%
WAGE / INCOME GAP [ % ]
93.0¢/ $1
WAGE / INCOME GAP [ $ ]
0.36
INEQUALITY / GINI INDEX
2,695
TOTAL POPULATION
1,382
MALE POPULATION
1,313
FEMALE POPULATION
105.26
MALES / 100 FEMALES
95.01
FEMALES / 100 MALES
48.1
MEDIAN AGE
3.4
AVG FAMILY SIZE
2.5
AVG HOUSEHOLD SIZE
1,576
LABOR FORCE [ PEOPLE ]
71.3%
PERCENT IN LABOR FORCE
5.6%
UNEMPLOYMENT RATE
Sewaren Zip Codes
Income in Sewaren
Income Overview in Sewaren
Per Capita Income in Sewaren is $47,387, while median incomes of families and households are $112,101 and $107,887 respectively.
| Characteristic | Number | Measure |
| Per Capita Income | 2,695 | $47,387 |
| Median Family Income | 627 | $112,101 |
| Mean Family Income | 627 | $136,451 |
| Median Household Income | 1,084 | $107,887 |
| Mean Household Income | 1,084 | $116,583 |
| Income Deficit | 627 | $0 |
| Wage / Income Gap (%) | 2,695 | 6.98% |
| Wage / Income Gap ($) | 2,695 | 93.02¢ per $1 |
| Gini / Inequality Index | 2,695 | 0.36 |
Earnings by Sex in Sewaren
Average Earnings in Sewaren are $61,345, $65,391 for men and $60,824 for women, a difference of 7.0%.
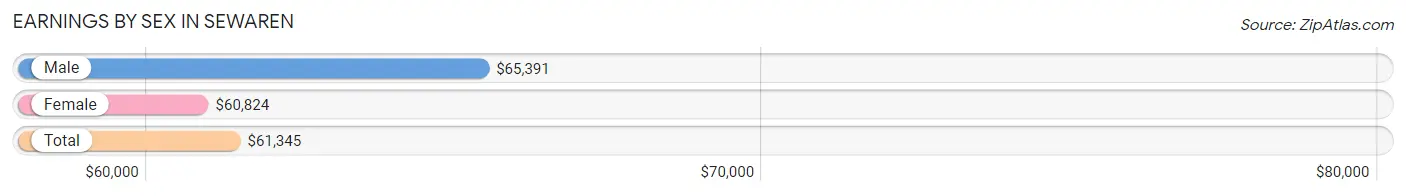
| Sex | Number | Average Earnings |
| Male | 847 (52.4%) | $65,391 |
| Female | 768 (47.5%) | $60,824 |
| Total | 1,615 (100.0%) | $61,345 |
Earnings by Sex by Income Bracket in Sewaren
The most common earnings brackets in Sewaren are $100,000+ for men (174 | 20.5%) and $75,000 to $99,999 for women (169 | 22.0%).
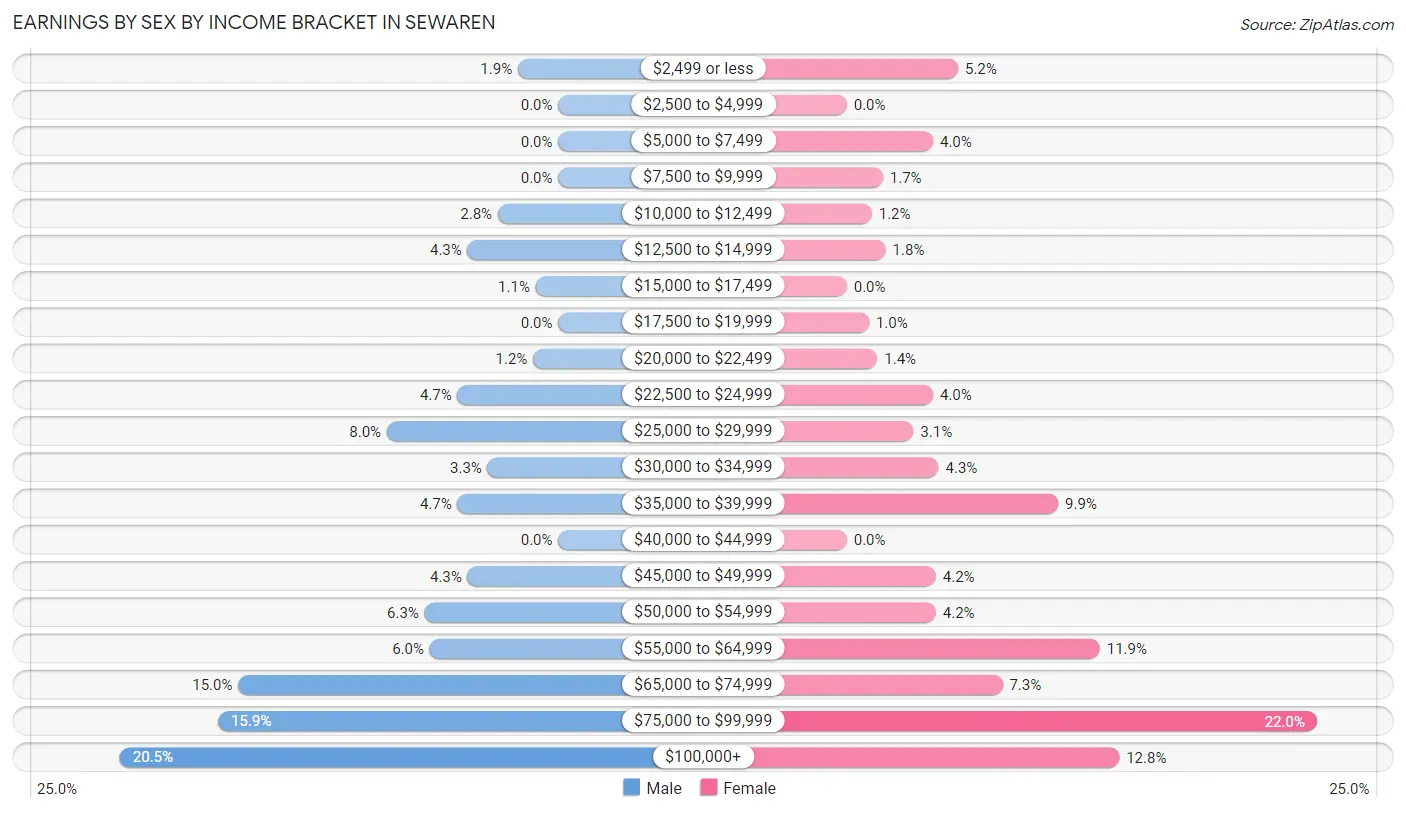
| Income | Male | Female |
| $2,499 or less | 16 (1.9%) | 40 (5.2%) |
| $2,500 to $4,999 | 0 (0.0%) | 0 (0.0%) |
| $5,000 to $7,499 | 0 (0.0%) | 31 (4.0%) |
| $7,500 to $9,999 | 0 (0.0%) | 13 (1.7%) |
| $10,000 to $12,499 | 24 (2.8%) | 9 (1.2%) |
| $12,500 to $14,999 | 36 (4.3%) | 14 (1.8%) |
| $15,000 to $17,499 | 9 (1.1%) | 0 (0.0%) |
| $17,500 to $19,999 | 0 (0.0%) | 8 (1.0%) |
| $20,000 to $22,499 | 10 (1.2%) | 11 (1.4%) |
| $22,500 to $24,999 | 40 (4.7%) | 31 (4.0%) |
| $25,000 to $29,999 | 68 (8.0%) | 24 (3.1%) |
| $30,000 to $34,999 | 28 (3.3%) | 33 (4.3%) |
| $35,000 to $39,999 | 40 (4.7%) | 76 (9.9%) |
| $40,000 to $44,999 | 0 (0.0%) | 0 (0.0%) |
| $45,000 to $49,999 | 36 (4.3%) | 32 (4.2%) |
| $50,000 to $54,999 | 53 (6.3%) | 32 (4.2%) |
| $55,000 to $64,999 | 51 (6.0%) | 91 (11.8%) |
| $65,000 to $74,999 | 127 (15.0%) | 56 (7.3%) |
| $75,000 to $99,999 | 135 (15.9%) | 169 (22.0%) |
| $100,000+ | 174 (20.5%) | 98 (12.8%) |
| Total | 847 (100.0%) | 768 (100.0%) |
Earnings by Sex by Educational Attainment in Sewaren
Average earnings in Sewaren are $65,734 for men and $61,497 for women, a difference of 6.5%. Men with an educational attainment of college or associate's degree enjoy the highest average annual earnings of $89,219, while those with high school diploma education earn the least with $61,786. Women with an educational attainment of graduate degree earn the most with the average annual earnings of $88,281, while those with high school diploma education have the smallest earnings of $39,154.
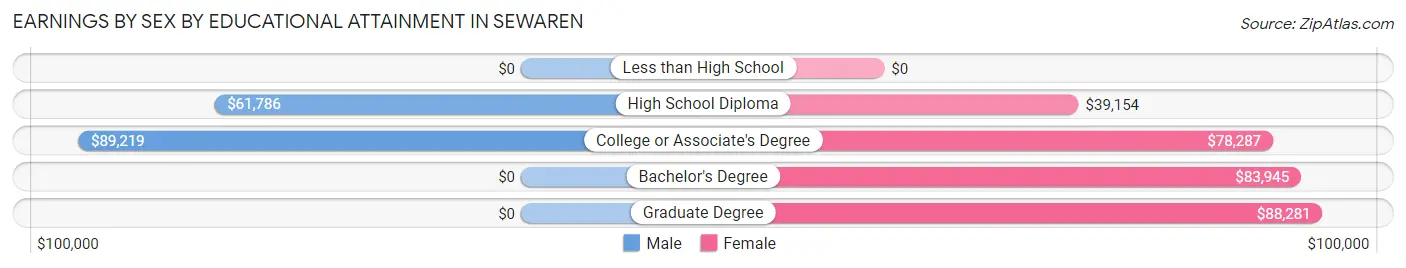
| Educational Attainment | Male Income | Female Income |
| Less than High School | - | - |
| High School Diploma | $61,786 | $39,154 |
| College or Associate's Degree | $89,219 | $78,287 |
| Bachelor's Degree | - | - |
| Graduate Degree | - | - |
| Total | $65,734 | $61,497 |
Family Income in Sewaren
Family Income Brackets in Sewaren
According to the Sewaren family income data, there are 204 families falling into the $100,000 to $149,999 income range, which is the most common income bracket and makes up 32.5% of all families.
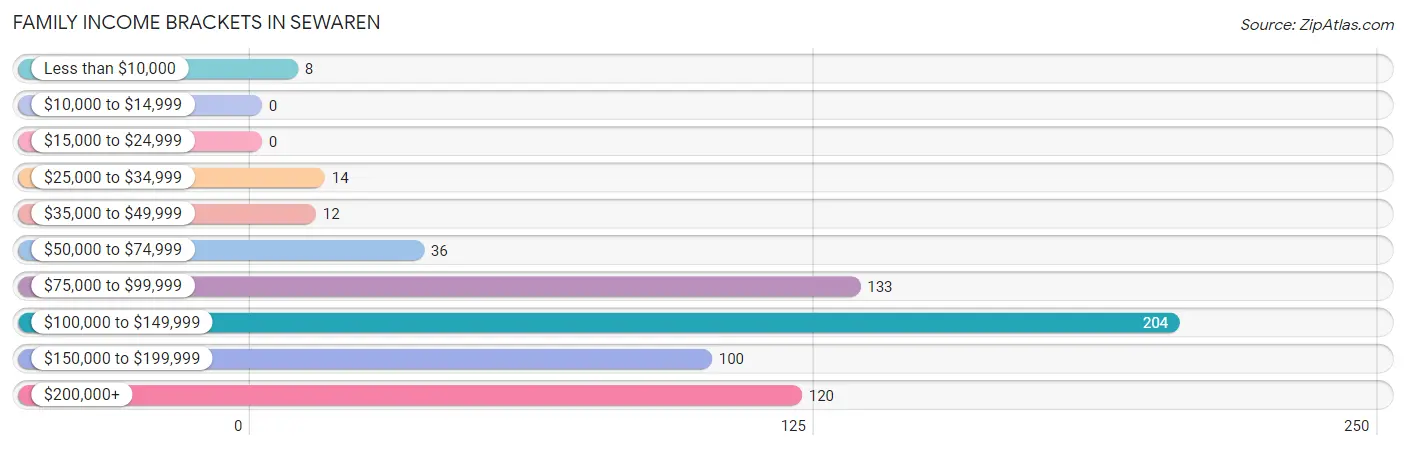
| Income Bracket | # Families | % Families |
| Less than $10,000 | 8 | 1.3% |
| $10,000 to $14,999 | 0 | 0.0% |
| $15,000 to $24,999 | 0 | 0.0% |
| $25,000 to $34,999 | 14 | 2.2% |
| $35,000 to $49,999 | 12 | 1.9% |
| $50,000 to $74,999 | 36 | 5.7% |
| $75,000 to $99,999 | 133 | 21.2% |
| $100,000 to $149,999 | 204 | 32.5% |
| $150,000 to $199,999 | 100 | 15.9% |
| $200,000+ | 120 | 19.1% |
Family Income by Famaliy Size in Sewaren
4-person families (132 | 21.0%) account for the highest median family income in Sewaren with $189,400 per family, while 4-person families (132 | 21.0%) have the highest median income of $47,350 per family member.
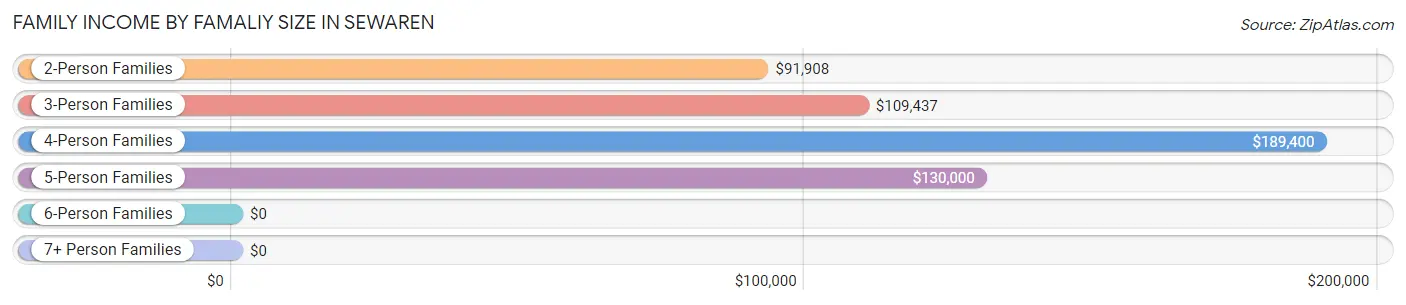
| Income Bracket | # Families | Median Income |
| 2-Person Families | 133 (21.2%) | $91,908 |
| 3-Person Families | 242 (38.6%) | $109,437 |
| 4-Person Families | 132 (21.0%) | $189,400 |
| 5-Person Families | 120 (19.1%) | $130,000 |
| 6-Person Families | 0 (0.0%) | $0 |
| 7+ Person Families | 0 (0.0%) | $0 |
| Total | 627 (100.0%) | $112,101 |
Family Income by Number of Earners in Sewaren
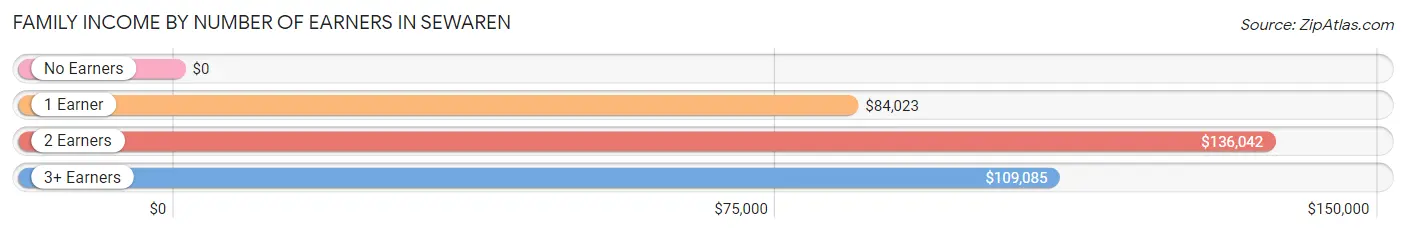
| Number of Earners | # Families | Median Income |
| No Earners | 36 (5.7%) | $0 |
| 1 Earner | 131 (20.9%) | $84,023 |
| 2 Earners | 304 (48.5%) | $136,042 |
| 3+ Earners | 156 (24.9%) | $109,085 |
| Total | 627 (100.0%) | $112,101 |
Household Income in Sewaren
Household Income Brackets in Sewaren
With 224 households falling in the category, the $100,000 to $149,999 income range is the most frequent in Sewaren, accounting for 20.7% of all households.
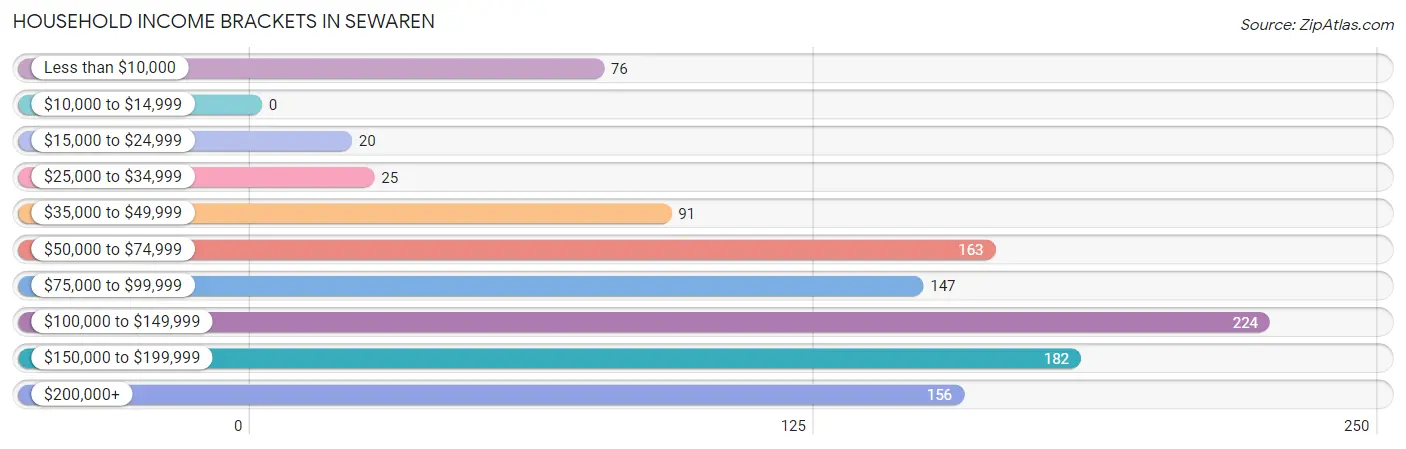
| Income Bracket | # Households | % Households |
| Less than $10,000 | 76 | 7.0% |
| $10,000 to $14,999 | 0 | 0.0% |
| $15,000 to $24,999 | 20 | 1.8% |
| $25,000 to $34,999 | 25 | 2.3% |
| $35,000 to $49,999 | 91 | 8.4% |
| $50,000 to $74,999 | 163 | 15.0% |
| $75,000 to $99,999 | 147 | 13.6% |
| $100,000 to $149,999 | 224 | 20.7% |
| $150,000 to $199,999 | 182 | 16.8% |
| $200,000+ | 156 | 14.4% |
Household Income by Householder Age in Sewaren
The median household income in Sewaren is $107,887, with the highest median household income of $158,438 found in the 25 to 44 years age bracket for the primary householder. A total of 280 households (25.8%) fall into this category.
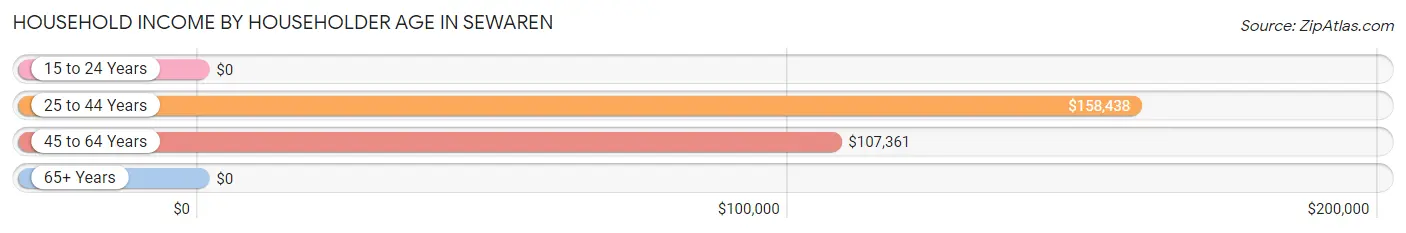
| Income Bracket | # Households | Median Income |
| 15 to 24 Years | 0 (0.0%) | $0 |
| 25 to 44 Years | 280 (25.8%) | $158,438 |
| 45 to 64 Years | 439 (40.5%) | $107,361 |
| 65+ Years | 365 (33.7%) | $0 |
| Total | 1,084 (100.0%) | $107,887 |
Poverty in Sewaren
Income Below Poverty by Sex and Age in Sewaren
With 3.8% poverty level for males and 4.5% for females among the residents of Sewaren, 65 to 74 year old males and 65 to 74 year old females are the most vulnerable to poverty, with 39 males (19.1%) and 27 females (22.1%) in their respective age groups living below the poverty level.
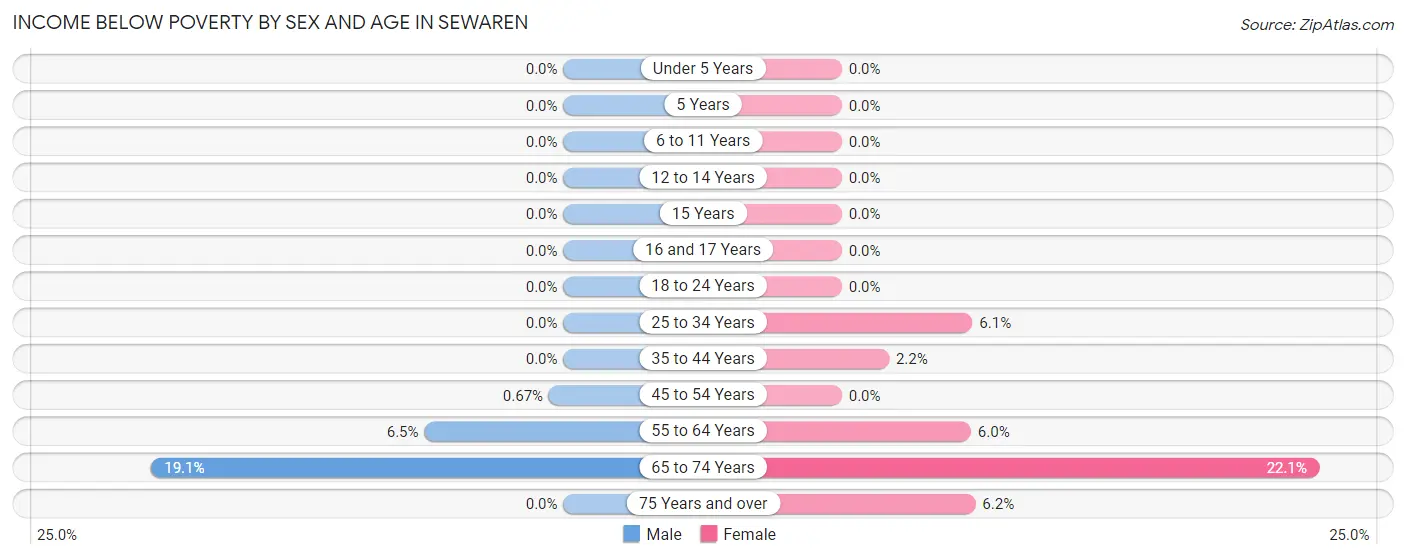
| Age Bracket | Male | Female |
| Under 5 Years | 0 (0.0%) | 0 (0.0%) |
| 5 Years | 0 (0.0%) | 0 (0.0%) |
| 6 to 11 Years | 0 (0.0%) | 0 (0.0%) |
| 12 to 14 Years | 0 (0.0%) | 0 (0.0%) |
| 15 Years | 0 (0.0%) | 0 (0.0%) |
| 16 and 17 Years | 0 (0.0%) | 0 (0.0%) |
| 18 to 24 Years | 0 (0.0%) | 0 (0.0%) |
| 25 to 34 Years | 0 (0.0%) | 6 (6.1%) |
| 35 to 44 Years | 0 (0.0%) | 5 (2.2%) |
| 45 to 54 Years | 2 (0.7%) | 0 (0.0%) |
| 55 to 64 Years | 12 (6.5%) | 13 (6.0%) |
| 65 to 74 Years | 39 (19.1%) | 27 (22.1%) |
| 75 Years and over | 0 (0.0%) | 8 (6.2%) |
| Total | 53 (3.8%) | 59 (4.5%) |
Income Above Poverty by Sex and Age in Sewaren
According to the poverty statistics in Sewaren, males aged under 5 years and females aged under 5 years are the age groups that are most secure financially, with 100.0% of males and 100.0% of females in these age groups living above the poverty line.
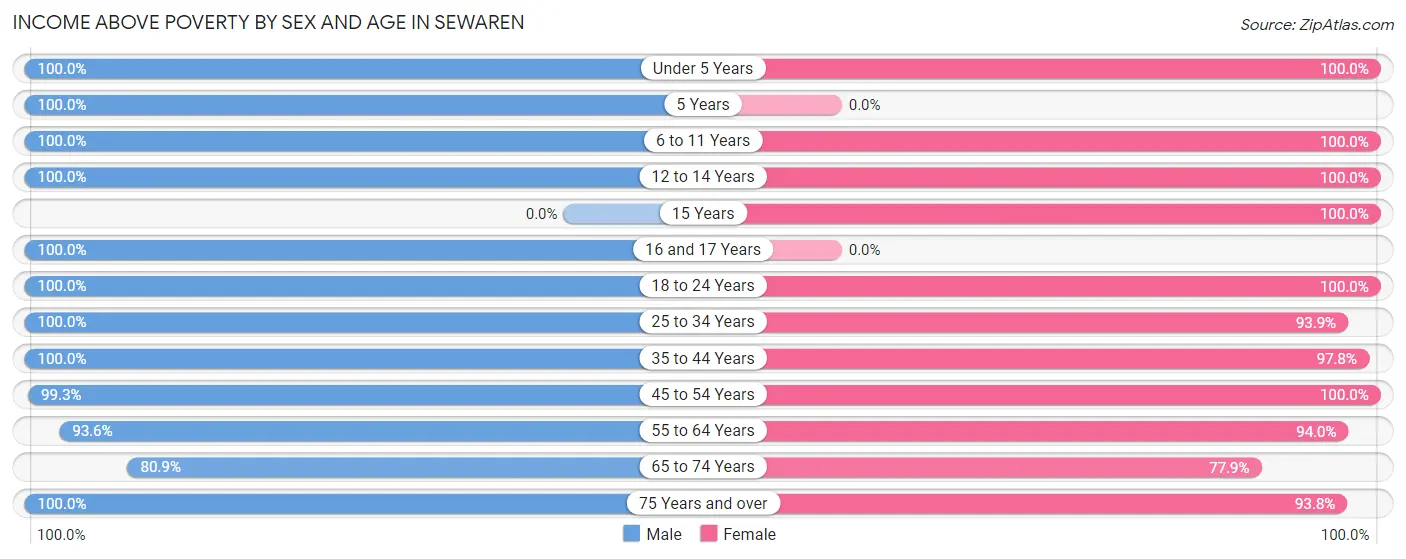
| Age Bracket | Male | Female |
| Under 5 Years | 30 (100.0%) | 43 (100.0%) |
| 5 Years | 37 (100.0%) | 0 (0.0%) |
| 6 to 11 Years | 139 (100.0%) | 123 (100.0%) |
| 12 to 14 Years | 43 (100.0%) | 55 (100.0%) |
| 15 Years | 0 (0.0%) | 14 (100.0%) |
| 16 and 17 Years | 30 (100.0%) | 0 (0.0%) |
| 18 to 24 Years | 22 (100.0%) | 79 (100.0%) |
| 25 to 34 Years | 110 (100.0%) | 93 (93.9%) |
| 35 to 44 Years | 151 (100.0%) | 223 (97.8%) |
| 45 to 54 Years | 298 (99.3%) | 204 (100.0%) |
| 55 to 64 Years | 174 (93.5%) | 204 (94.0%) |
| 65 to 74 Years | 165 (80.9%) | 95 (77.9%) |
| 75 Years and over | 130 (100.0%) | 121 (93.8%) |
| Total | 1,329 (96.2%) | 1,254 (95.5%) |
Income Below Poverty Among Married-Couple Families in Sewaren
The poverty statistics for married-couple families in Sewaren show that 1.4% or 8 of the total 562 families live below the poverty line. Families with no children have the highest poverty rate of 2.9%, comprising of 8 families. On the other hand, families with 1 or 2 children have the lowest poverty rate of 0.0%, which includes 0 families.
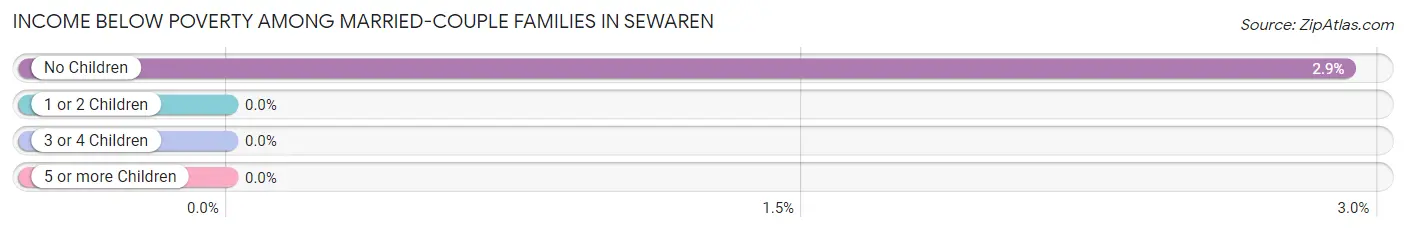
| Children | Above Poverty | Below Poverty |
| No Children | 266 (97.1%) | 8 (2.9%) |
| 1 or 2 Children | 250 (100.0%) | 0 (0.0%) |
| 3 or 4 Children | 38 (100.0%) | 0 (0.0%) |
| 5 or more Children | 0 (0.0%) | 0 (0.0%) |
| Total | 554 (98.6%) | 8 (1.4%) |
Income Below Poverty Among Single-Parent Households in Sewaren
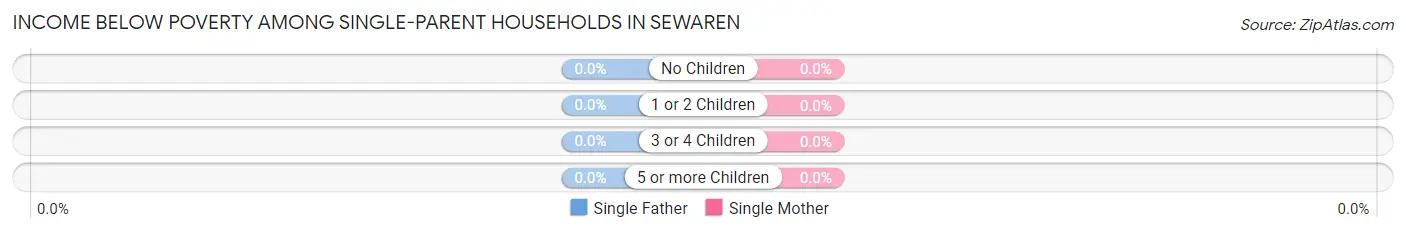
| Children | Single Father | Single Mother |
| No Children | 0 (0.0%) | 0 (0.0%) |
| 1 or 2 Children | 0 (0.0%) | 0 (0.0%) |
| 3 or 4 Children | 0 (0.0%) | 0 (0.0%) |
| 5 or more Children | 0 (0.0%) | 0 (0.0%) |
| Total | 0 (0.0%) | 0 (0.0%) |
Income Below Poverty Among Married-Couple vs Single-Parent Households in Sewaren
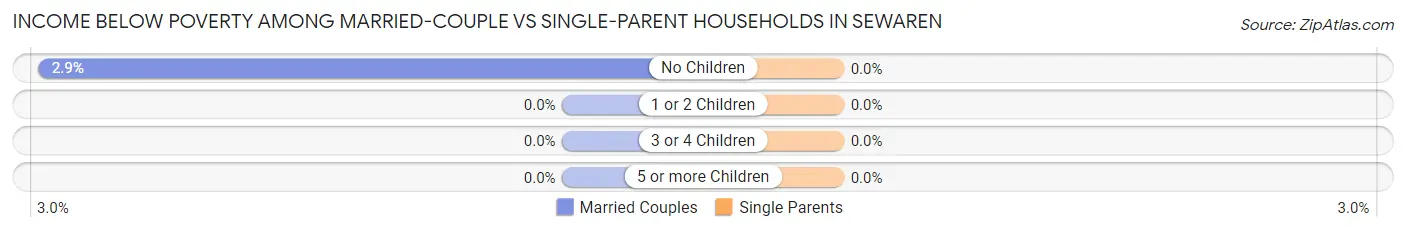
| Children | Married-Couple Families | Single-Parent Households |
| No Children | 8 (2.9%) | 0 (0.0%) |
| 1 or 2 Children | 0 (0.0%) | 0 (0.0%) |
| 3 or 4 Children | 0 (0.0%) | 0 (0.0%) |
| 5 or more Children | 0 (0.0%) | 0 (0.0%) |
| Total | 8 (1.4%) | 0 (0.0%) |
Race in Sewaren
The most populous races in Sewaren are White / Caucasian (1,635 | 60.7%), Hispanic or Latino (642 | 23.8%), and Two or more Races (355 | 13.2%).
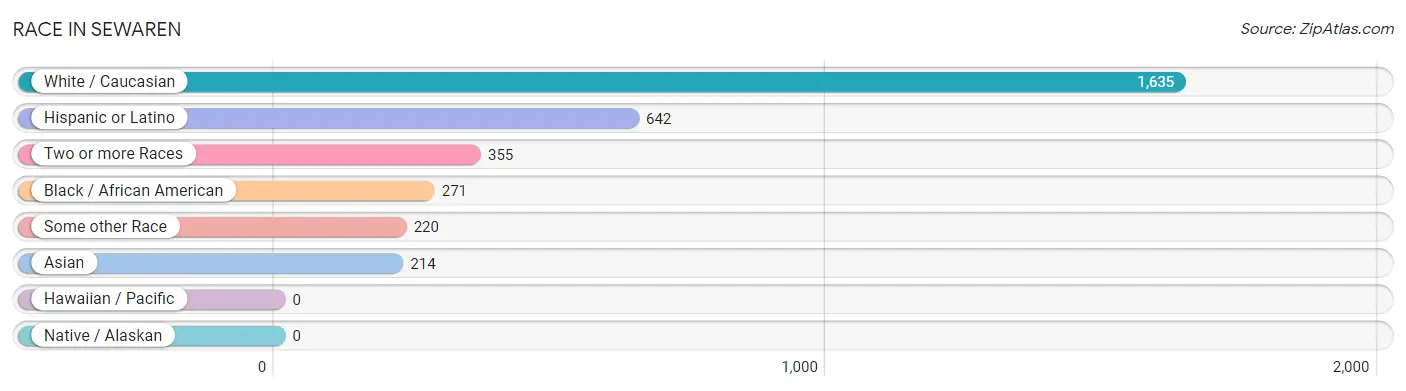
| Race | # Population | % Population |
| Asian | 214 | 7.9% |
| Black / African American | 271 | 10.1% |
| Hawaiian / Pacific | 0 | 0.0% |
| Hispanic or Latino | 642 | 23.8% |
| Native / Alaskan | 0 | 0.0% |
| White / Caucasian | 1,635 | 60.7% |
| Two or more Races | 355 | 13.2% |
| Some other Race | 220 | 8.2% |
| Total | 2,695 | 100.0% |
Ancestry in Sewaren
The most populous ancestries reported in Sewaren are Italian (469 | 17.4%), German (393 | 14.6%), Irish (373 | 13.8%), Polish (333 | 12.4%), and English (273 | 10.1%), together accounting for 68.3% of all Sewaren residents.
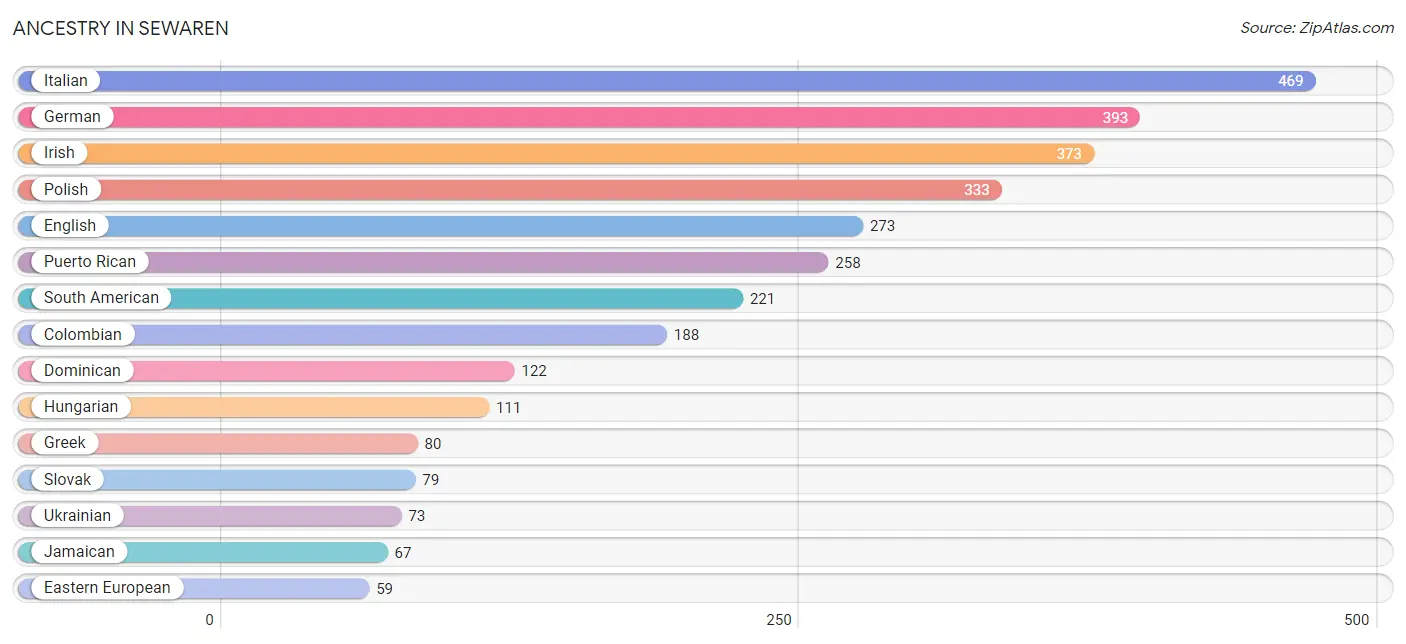
| Ancestry | # Population | % Population |
| American | 40 | 1.5% |
| Arab | 10 | 0.4% |
| British | 8 | 0.3% |
| Carpatho Rusyn | 10 | 0.4% |
| Central American Indian | 8 | 0.3% |
| Colombian | 188 | 7.0% |
| Cuban | 12 | 0.4% |
| Czechoslovakian | 10 | 0.4% |
| Danish | 29 | 1.1% |
| Dominican | 122 | 4.5% |
| Dutch | 40 | 1.5% |
| Eastern European | 59 | 2.2% |
| Egyptian | 10 | 0.4% |
| English | 273 | 10.1% |
| European | 32 | 1.2% |
| Finnish | 14 | 0.5% |
| French | 19 | 0.7% |
| French Canadian | 10 | 0.4% |
| German | 393 | 14.6% |
| Greek | 80 | 3.0% |
| Haitian | 27 | 1.0% |
| Hungarian | 111 | 4.1% |
| Irish | 373 | 13.8% |
| Italian | 469 | 17.4% |
| Jamaican | 67 | 2.5% |
| Lithuanian | 9 | 0.3% |
| Mexican | 27 | 1.0% |
| Peruvian | 33 | 1.2% |
| Polish | 333 | 12.4% |
| Portuguese | 13 | 0.5% |
| Puerto Rican | 258 | 9.6% |
| Russian | 48 | 1.8% |
| Slavic | 11 | 0.4% |
| Slovak | 79 | 2.9% |
| South American | 221 | 8.2% |
| Thai | 25 | 0.9% |
| Trinidadian and Tobagonian | 38 | 1.4% |
| Ukrainian | 73 | 2.7% |
| Welsh | 10 | 0.4% |
| West Indian | 20 | 0.7% | View All 40 Rows |
Immigrants in Sewaren
The most numerous immigrant groups reported in Sewaren came from Latin America (321 | 11.9%), Asia (175 | 6.5%), South Central Asia (175 | 6.5%), Sri Lanka (136 | 5.1%), and Caribbean (131 | 4.9%), together accounting for 34.8% of all Sewaren residents.
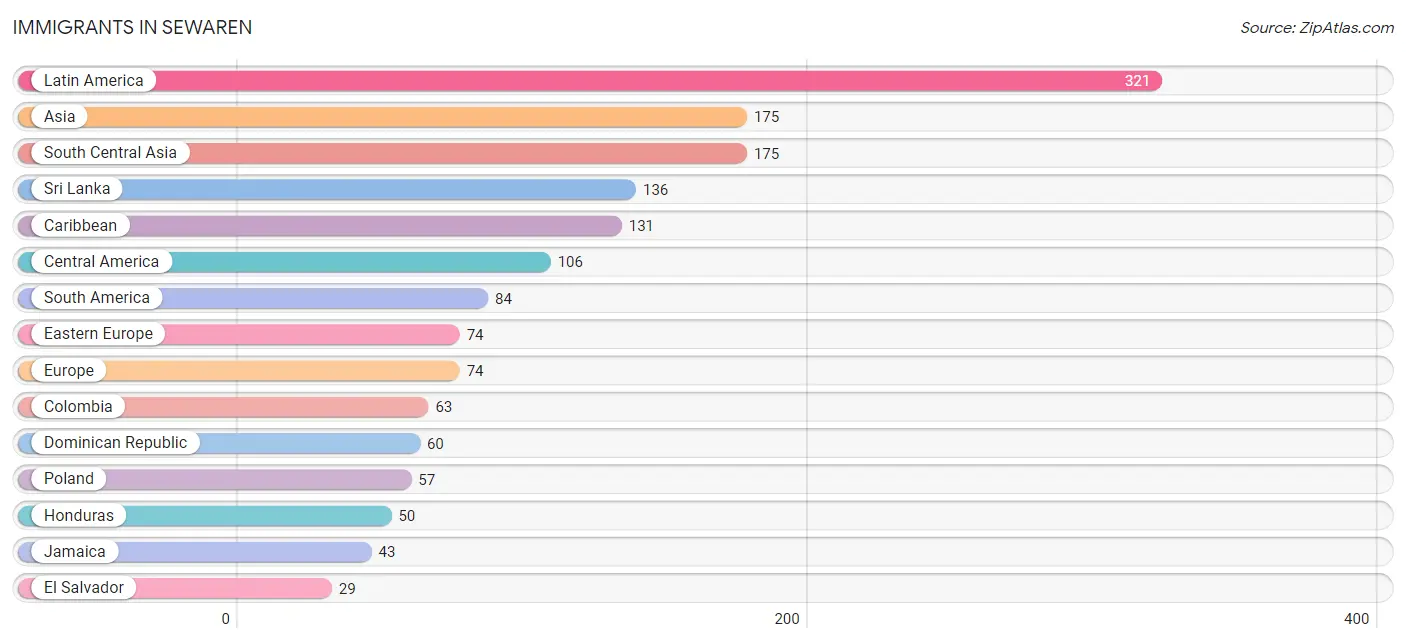
| Immigration Origin | # Population | % Population |
| Africa | 10 | 0.4% |
| Asia | 175 | 6.5% |
| Caribbean | 131 | 4.9% |
| Central America | 106 | 3.9% |
| Colombia | 63 | 2.3% |
| Cuba | 18 | 0.7% |
| Dominican Republic | 60 | 2.2% |
| Eastern Europe | 74 | 2.8% |
| Egypt | 10 | 0.4% |
| El Salvador | 29 | 1.1% |
| Europe | 74 | 2.8% |
| Honduras | 50 | 1.9% |
| India | 17 | 0.6% |
| Jamaica | 43 | 1.6% |
| Latin America | 321 | 11.9% |
| Mexico | 27 | 1.0% |
| Northern Africa | 10 | 0.4% |
| Pakistan | 22 | 0.8% |
| Peru | 21 | 0.8% |
| Poland | 57 | 2.1% |
| Russia | 17 | 0.6% |
| South America | 84 | 3.1% |
| South Central Asia | 175 | 6.5% |
| Sri Lanka | 136 | 5.1% |
| Trinidad and Tobago | 10 | 0.4% | View All 25 Rows |
Sex and Age in Sewaren
Sex and Age in Sewaren
The most populous age groups in Sewaren are 45 to 49 Years (182 | 13.2%) for men and 60 to 64 Years (156 | 11.9%) for women.
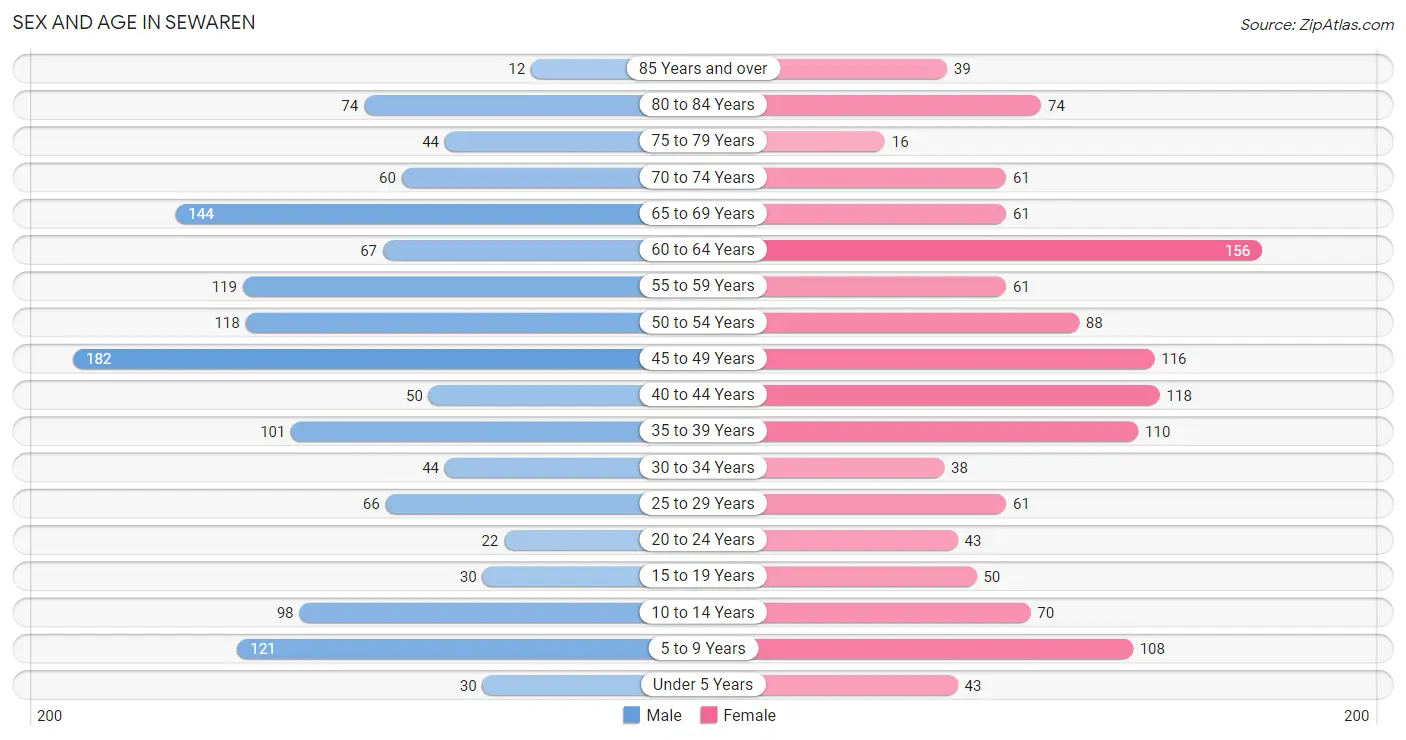
| Age Bracket | Male | Female |
| Under 5 Years | 30 (2.2%) | 43 (3.3%) |
| 5 to 9 Years | 121 (8.8%) | 108 (8.2%) |
| 10 to 14 Years | 98 (7.1%) | 70 (5.3%) |
| 15 to 19 Years | 30 (2.2%) | 50 (3.8%) |
| 20 to 24 Years | 22 (1.6%) | 43 (3.3%) |
| 25 to 29 Years | 66 (4.8%) | 61 (4.6%) |
| 30 to 34 Years | 44 (3.2%) | 38 (2.9%) |
| 35 to 39 Years | 101 (7.3%) | 110 (8.4%) |
| 40 to 44 Years | 50 (3.6%) | 118 (9.0%) |
| 45 to 49 Years | 182 (13.2%) | 116 (8.8%) |
| 50 to 54 Years | 118 (8.5%) | 88 (6.7%) |
| 55 to 59 Years | 119 (8.6%) | 61 (4.6%) |
| 60 to 64 Years | 67 (4.9%) | 156 (11.9%) |
| 65 to 69 Years | 144 (10.4%) | 61 (4.6%) |
| 70 to 74 Years | 60 (4.3%) | 61 (4.6%) |
| 75 to 79 Years | 44 (3.2%) | 16 (1.2%) |
| 80 to 84 Years | 74 (5.3%) | 74 (5.6%) |
| 85 Years and over | 12 (0.9%) | 39 (3.0%) |
| Total | 1,382 (100.0%) | 1,313 (100.0%) |
Families and Households in Sewaren
Median Family Size in Sewaren
The median family size in Sewaren is 3.37 persons per family, with married-couple families (562 | 89.6%) accounting for the largest median family size of 3.45 persons per family. On the other hand, single male/father families (15 | 2.4%) represent the smallest median family size with 2.00 persons per family.
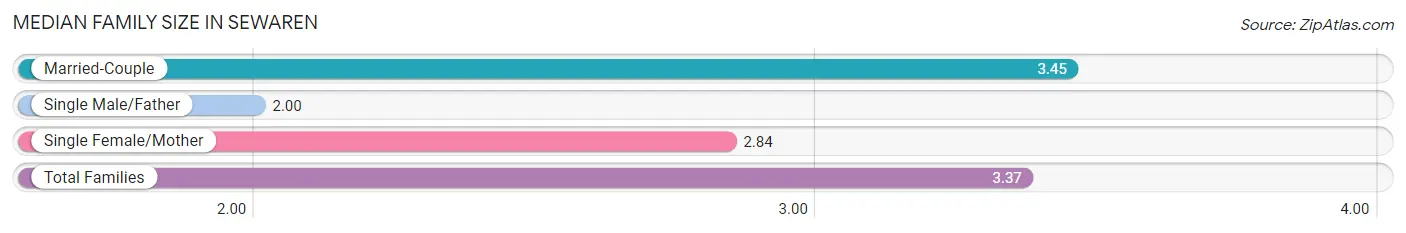
| Family Type | # Families | Family Size |
| Married-Couple | 562 (89.6%) | 3.45 |
| Single Male/Father | 15 (2.4%) | 2.00 |
| Single Female/Mother | 50 (8.0%) | 2.84 |
| Total Families | 627 (100.0%) | 3.37 |
Median Household Size in Sewaren
The median household size in Sewaren is 2.47 persons per household, with single female/mother households (50 | 4.6%) accounting for the largest median household size of 3.54 persons per household. non-family households (457 | 42.2%) represent the smallest median household size with 1.10 persons per household.
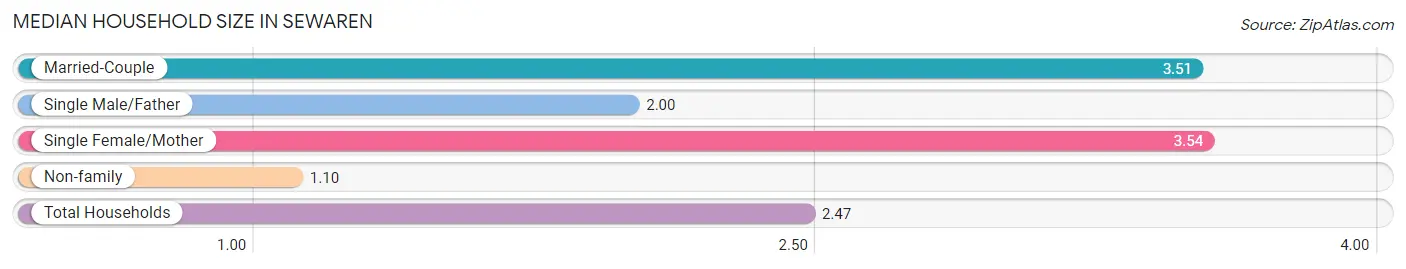
| Household Type | # Households | Household Size |
| Married-Couple | 562 (51.8%) | 3.51 |
| Single Male/Father | 15 (1.4%) | 2.00 |
| Single Female/Mother | 50 (4.6%) | 3.54 |
| Non-family | 457 (42.2%) | 1.10 |
| Total Households | 1,084 (100.0%) | 2.47 |
Household Size by Marriage Status in Sewaren
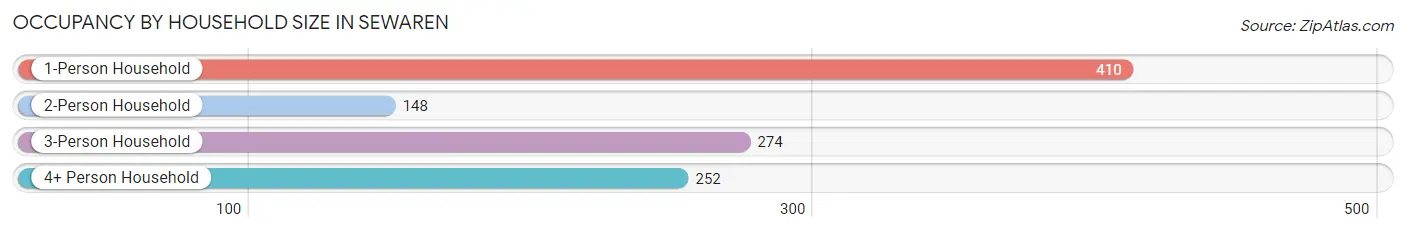
Out of a total of 1,084 households in Sewaren, 627 (57.8%) are family households, while 457 (42.2%) are nonfamily households. The most numerous type of family households are 3-person households, comprising 274, and the most common type of nonfamily households are 1-person households, comprising 410.
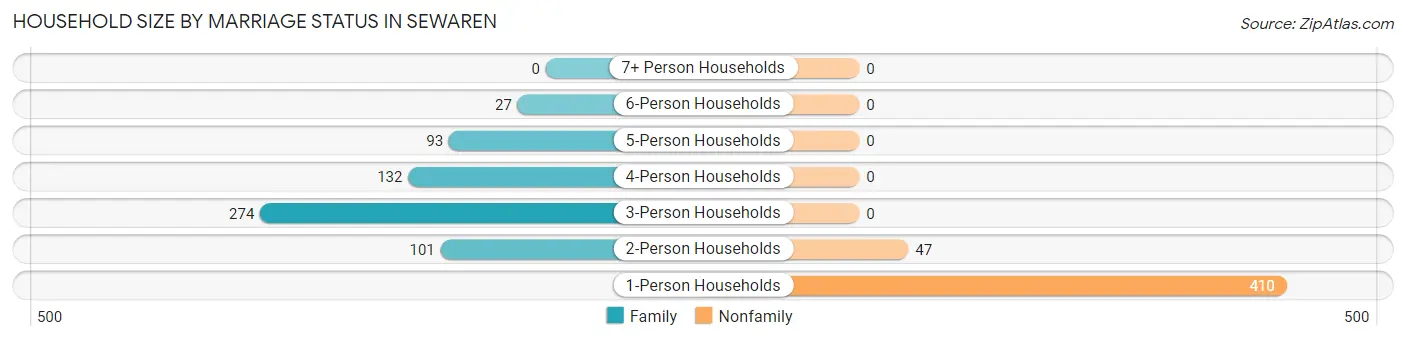
| Household Size | Family Households | Nonfamily Households |
| 1-Person Households | - | 410 (37.8%) |
| 2-Person Households | 101 (9.3%) | 47 (4.3%) |
| 3-Person Households | 274 (25.3%) | 0 (0.0%) |
| 4-Person Households | 132 (12.2%) | 0 (0.0%) |
| 5-Person Households | 93 (8.6%) | 0 (0.0%) |
| 6-Person Households | 27 (2.5%) | 0 (0.0%) |
| 7+ Person Households | 0 (0.0%) | 0 (0.0%) |
| Total | 627 (57.8%) | 457 (42.2%) |
Female Fertility in Sewaren
Fertility by Age in Sewaren
Average fertility rate in Sewaren is 24.0 births per 1,000 women. Women in the age bracket of 20 to 34 years have the highest fertility rate with 92.0 births per 1,000 women. Women in the age bracket of 20 to 34 years acount for 100.0% of all women with births.
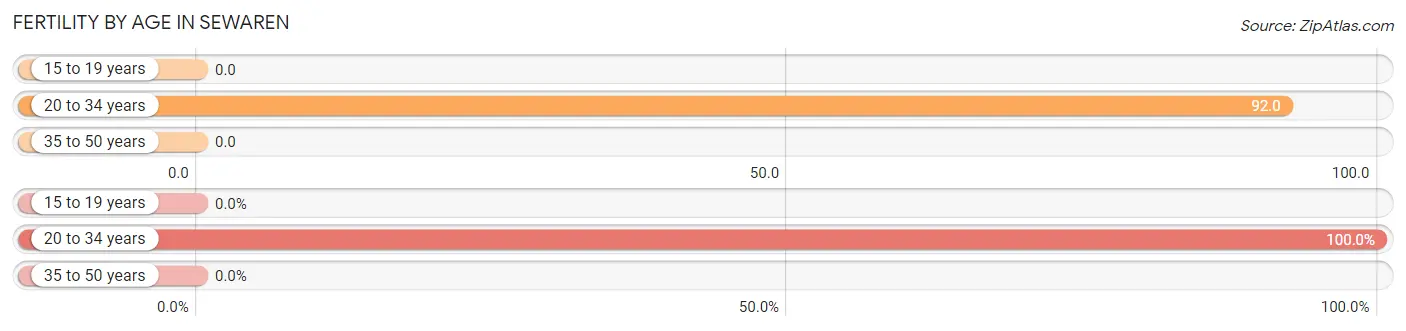
| Age Bracket | Women with Births | Births / 1,000 Women |
| 15 to 19 years | 0 (0.0%) | 0.0 |
| 20 to 34 years | 13 (100.0%) | 92.0 |
| 35 to 50 years | 0 (0.0%) | 0.0 |
| Total | 13 (100.0%) | 24.0 |
Fertility by Age by Marriage Status in Sewaren
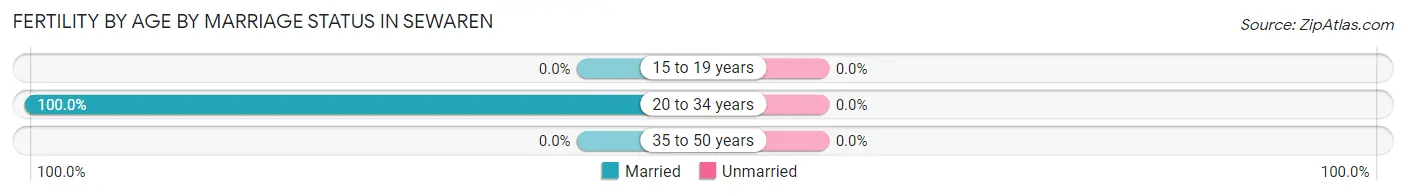
| Age Bracket | Married | Unmarried |
| 15 to 19 years | 0 (0.0%) | 0 (0.0%) |
| 20 to 34 years | 13 (100.0%) | 0 (0.0%) |
| 35 to 50 years | 0 (0.0%) | 0 (0.0%) |
| Total | 13 (100.0%) | 0 (0.0%) |
Fertility by Education in Sewaren
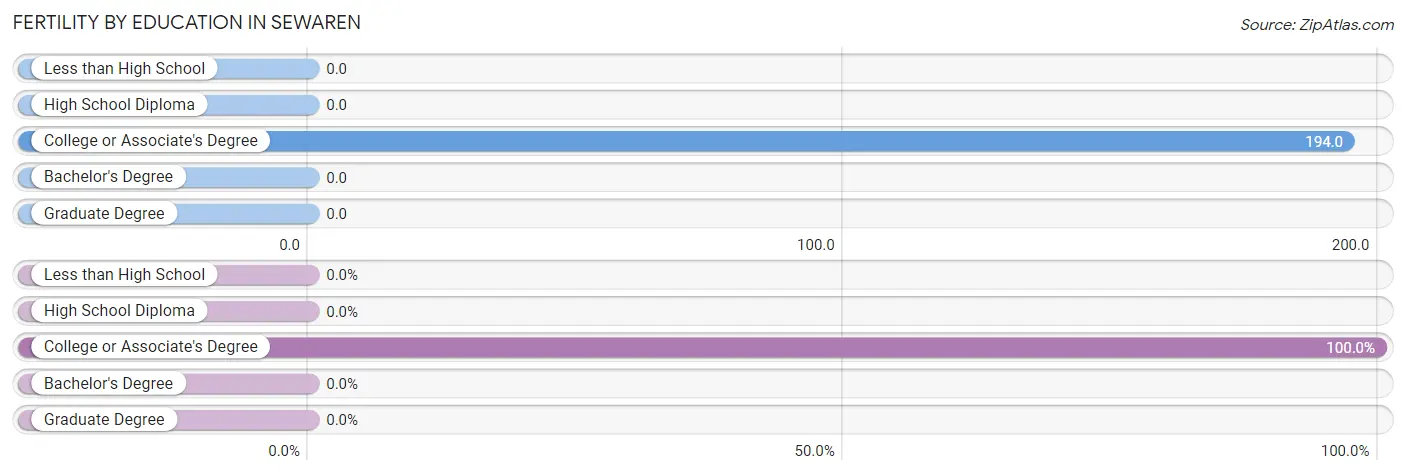
| Educational Attainment | Women with Births | Births / 1,000 Women |
| Less than High School | 0 (0.0%) | 0.0 |
| High School Diploma | 0 (0.0%) | 0.0 |
| College or Associate's Degree | 13 (100.0%) | 194.0 |
| Bachelor's Degree | 0 (0.0%) | 0.0 |
| Graduate Degree | 0 (0.0%) | 0.0 |
| Total | 13 (100.0%) | 24.0 |
Fertility by Education by Marriage Status in Sewaren
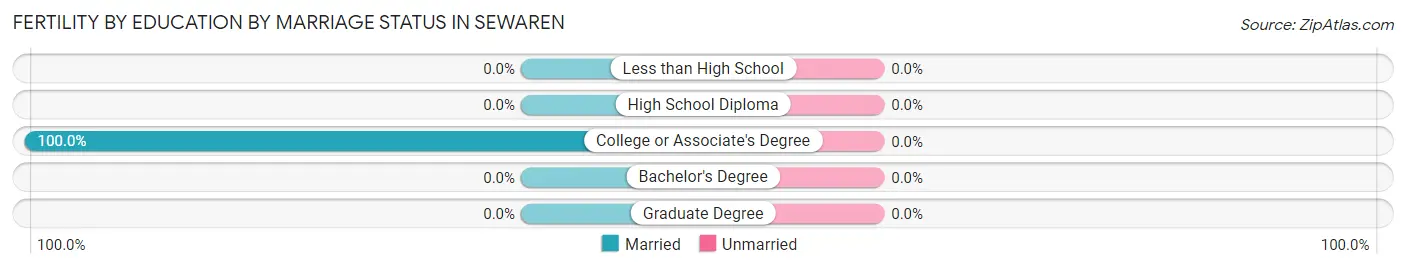
| Educational Attainment | Married | Unmarried |
| Less than High School | 0 (0.0%) | 0 (0.0%) |
| High School Diploma | 0 (0.0%) | 0 (0.0%) |
| College or Associate's Degree | 13 (100.0%) | 0 (0.0%) |
| Bachelor's Degree | 0 (0.0%) | 0 (0.0%) |
| Graduate Degree | 0 (0.0%) | 0 (0.0%) |
| Total | 13 (100.0%) | 0 (0.0%) |
Employment Characteristics in Sewaren
Employment by Class of Employer in Sewaren
Among the 1,449 employed individuals in Sewaren, private company employees (833 | 57.5%), local government employees (234 | 16.2%), and state government employees (170 | 11.7%) make up the most common classes of employment.
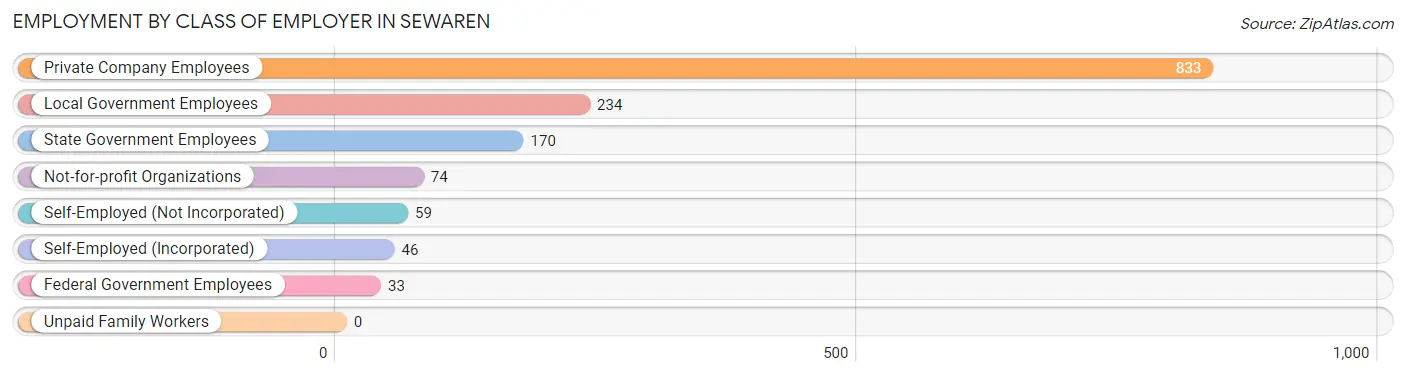
| Employer Class | # Employees | % Employees |
| Private Company Employees | 833 | 57.5% |
| Self-Employed (Incorporated) | 46 | 3.2% |
| Self-Employed (Not Incorporated) | 59 | 4.1% |
| Not-for-profit Organizations | 74 | 5.1% |
| Local Government Employees | 234 | 16.2% |
| State Government Employees | 170 | 11.7% |
| Federal Government Employees | 33 | 2.3% |
| Unpaid Family Workers | 0 | 0.0% |
| Total | 1,449 | 100.0% |
Employment Status by Age in Sewaren
According to the labor force statistics for Sewaren, out of the total population over 16 years of age (2,211), 71.3% or 1,576 individuals are in the labor force, with 5.6% or 88 of them unemployed. The age group with the highest labor force participation rate is 20 to 24 years, with 100.0% or 65 individuals in the labor force. Within the labor force, the 16 to 19 years age range has the highest percentage of unemployed individuals, with 100.0% or 30 of them being unemployed.
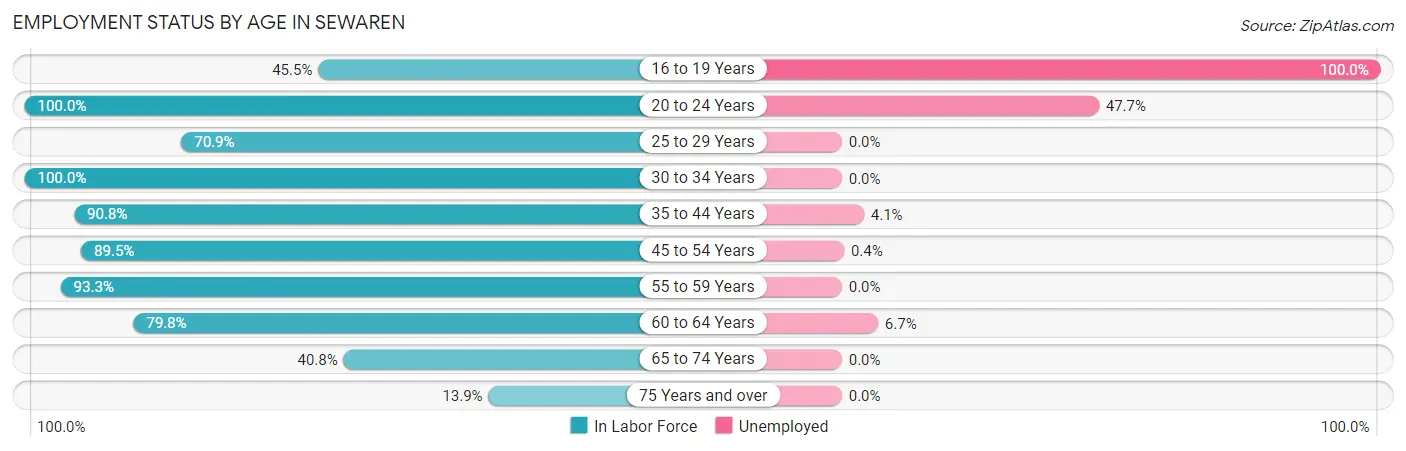
| Age Bracket | In Labor Force | Unemployed |
| 16 to 19 Years | 30 (45.5%) | 30 (100.0%) |
| 20 to 24 Years | 65 (100.0%) | 31 (47.7%) |
| 25 to 29 Years | 90 (70.9%) | 0 (0.0%) |
| 30 to 34 Years | 82 (100.0%) | 0 (0.0%) |
| 35 to 44 Years | 344 (90.8%) | 14 (4.1%) |
| 45 to 54 Years | 451 (89.5%) | 2 (0.4%) |
| 55 to 59 Years | 168 (93.3%) | 0 (0.0%) |
| 60 to 64 Years | 178 (79.8%) | 12 (6.7%) |
| 65 to 74 Years | 133 (40.8%) | 0 (0.0%) |
| 75 Years and over | 36 (13.9%) | 0 (0.0%) |
| Total | 1,576 (71.3%) | 88 (5.6%) |
Employment Status by Educational Attainment in Sewaren
According to labor force statistics for Sewaren, 87.8% of individuals (1,313) out of the total population between 25 and 64 years of age (1,495) are in the labor force, with 2.1% or 28 of them being unemployed. The group with the highest labor force participation rate are those with the educational attainment of college / associate degree, with 95.3% or 285 individuals in the labor force. Within the labor force, individuals with bachelor's degree or higher education have the highest percentage of unemployment, with 3.6% or 14 of them being unemployed.
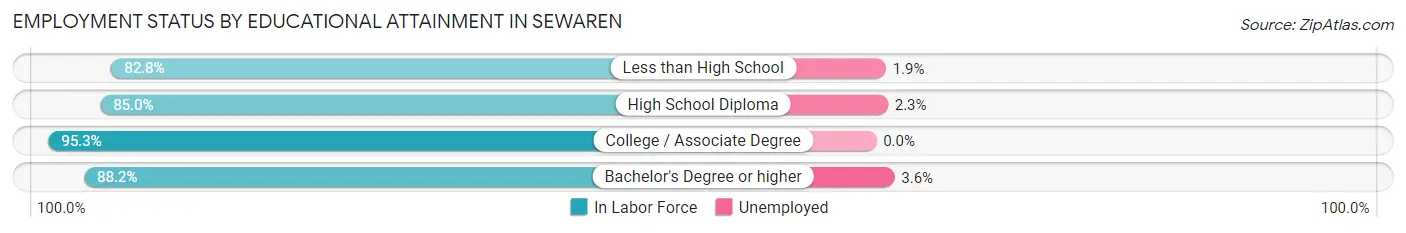
| Educational Attainment | In Labor Force | Unemployed |
| Less than High School | 106 (82.8%) | 2 (1.9%) |
| High School Diploma | 533 (85.0%) | 14 (2.3%) |
| College / Associate Degree | 285 (95.3%) | 0 (0.0%) |
| Bachelor's Degree or higher | 389 (88.2%) | 16 (3.6%) |
| Total | 1,313 (87.8%) | 31 (2.1%) |
Employment Occupations by Sex in Sewaren
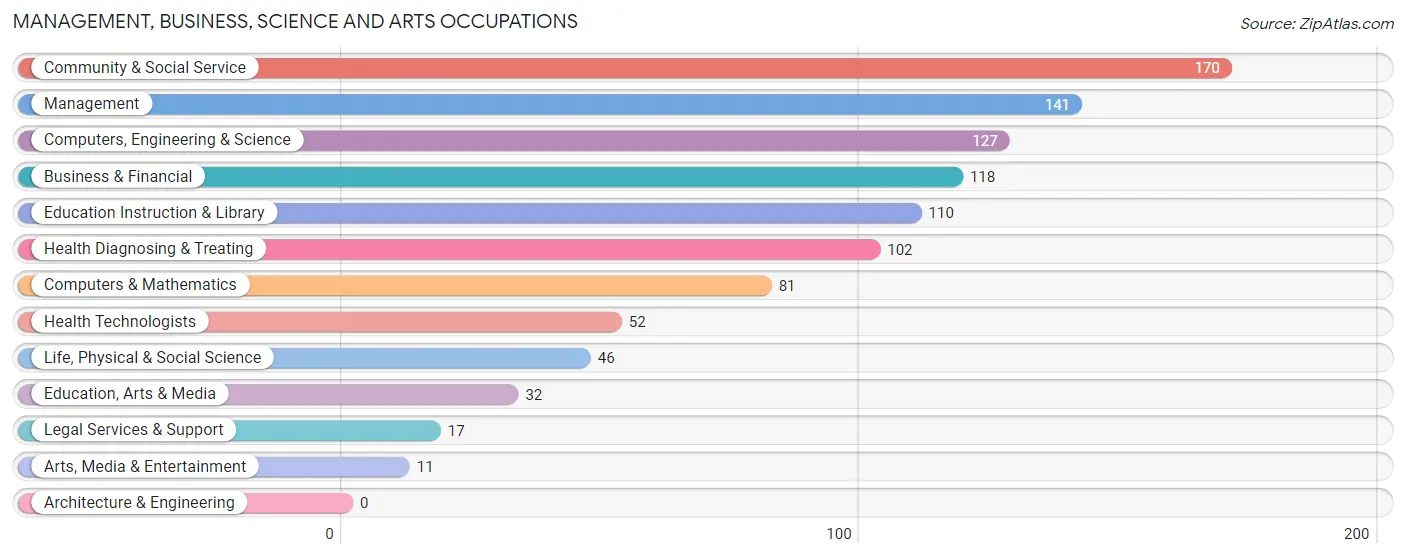
Management, Business, Science and Arts Occupations
The most common Management, Business, Science and Arts occupations in Sewaren are Community & Social Service (170 | 11.4%), Management (141 | 9.5%), Computers, Engineering & Science (127 | 8.5%), Business & Financial (118 | 7.9%), and Education Instruction & Library (110 | 7.4%).
Management, Business, Science and Arts Occupations by Sex
Within the Management, Business, Science and Arts occupations in Sewaren, the most male-oriented occupations are Arts, Media & Entertainment (100.0%), Computers & Mathematics (74.1%), and Management (58.2%), while the most female-oriented occupations are Life, Physical & Social Science (100.0%), Education, Arts & Media (100.0%), and Legal Services & Support (100.0%).
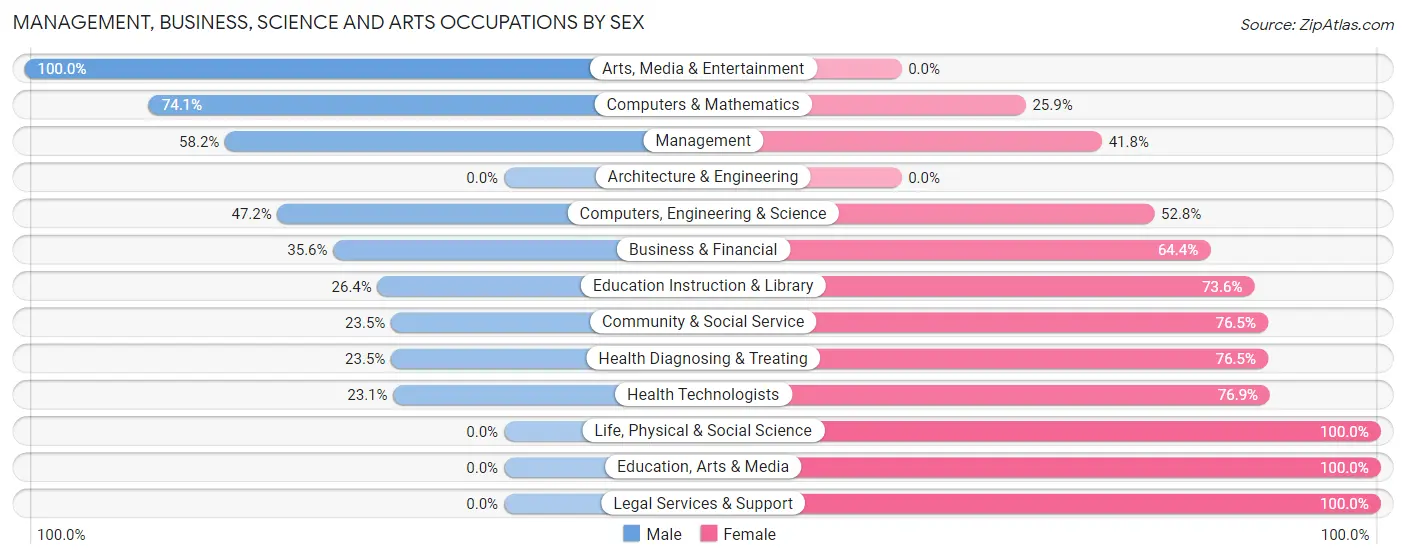
| Occupation | Male | Female |
| Management | 82 (58.2%) | 59 (41.8%) |
| Business & Financial | 42 (35.6%) | 76 (64.4%) |
| Computers, Engineering & Science | 60 (47.2%) | 67 (52.8%) |
| Computers & Mathematics | 60 (74.1%) | 21 (25.9%) |
| Architecture & Engineering | 0 (0.0%) | 0 (0.0%) |
| Life, Physical & Social Science | 0 (0.0%) | 46 (100.0%) |
| Community & Social Service | 40 (23.5%) | 130 (76.5%) |
| Education, Arts & Media | 0 (0.0%) | 32 (100.0%) |
| Legal Services & Support | 0 (0.0%) | 17 (100.0%) |
| Education Instruction & Library | 29 (26.4%) | 81 (73.6%) |
| Arts, Media & Entertainment | 11 (100.0%) | 0 (0.0%) |
| Health Diagnosing & Treating | 24 (23.5%) | 78 (76.5%) |
| Health Technologists | 12 (23.1%) | 40 (76.9%) |
| Total (Category) | 248 (37.7%) | 410 (62.3%) |
| Total (Overall) | 807 (54.2%) | 681 (45.8%) |
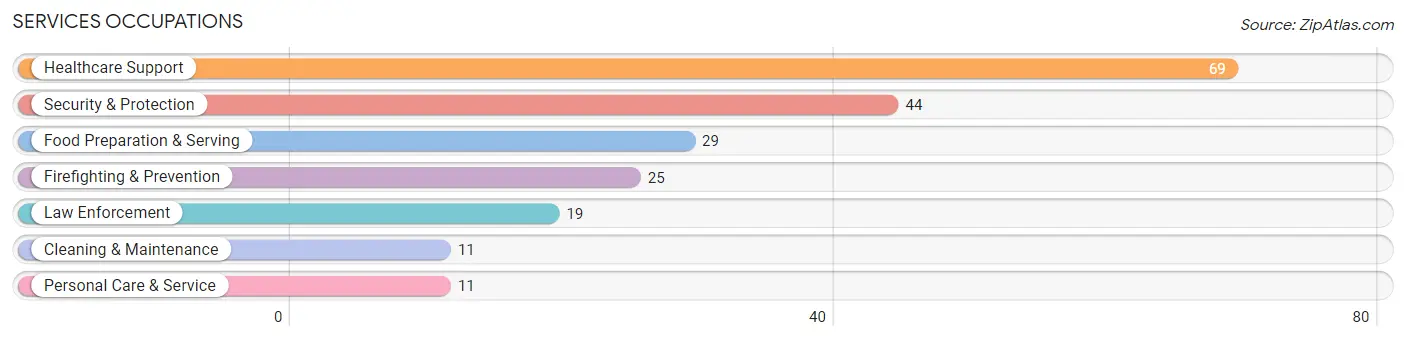
Services Occupations
The most common Services occupations in Sewaren are Healthcare Support (69 | 4.6%), Security & Protection (44 | 3.0%), Food Preparation & Serving (29 | 1.9%), Firefighting & Prevention (25 | 1.7%), and Law Enforcement (19 | 1.3%).
Services Occupations by Sex
Within the Services occupations in Sewaren, the most male-oriented occupations are Security & Protection (100.0%), Firefighting & Prevention (100.0%), and Law Enforcement (100.0%), while the most female-oriented occupations are Food Preparation & Serving (100.0%), Personal Care & Service (100.0%), and Healthcare Support (47.8%).
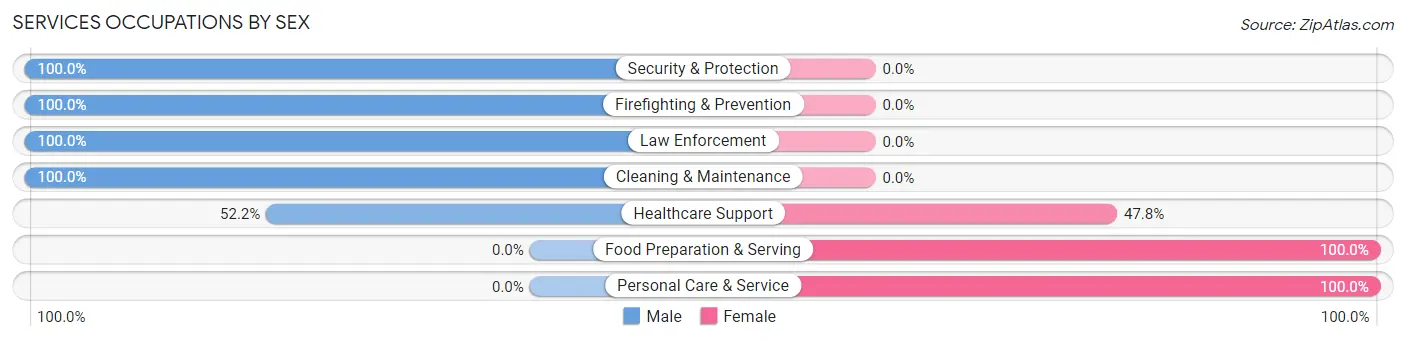
| Occupation | Male | Female |
| Healthcare Support | 36 (52.2%) | 33 (47.8%) |
| Security & Protection | 44 (100.0%) | 0 (0.0%) |
| Firefighting & Prevention | 25 (100.0%) | 0 (0.0%) |
| Law Enforcement | 19 (100.0%) | 0 (0.0%) |
| Food Preparation & Serving | 0 (0.0%) | 29 (100.0%) |
| Cleaning & Maintenance | 11 (100.0%) | 0 (0.0%) |
| Personal Care & Service | 0 (0.0%) | 11 (100.0%) |
| Total (Category) | 91 (55.5%) | 73 (44.5%) |
| Total (Overall) | 807 (54.2%) | 681 (45.8%) |
Sales and Office Occupations
The most common Sales and Office occupations in Sewaren are Office & Administration (173 | 11.6%), and Sales & Related (120 | 8.1%).
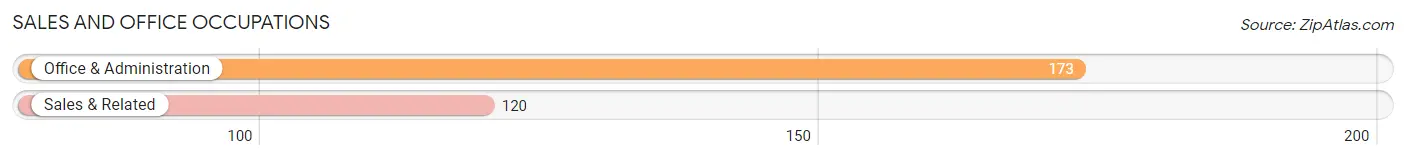
Sales and Office Occupations by Sex
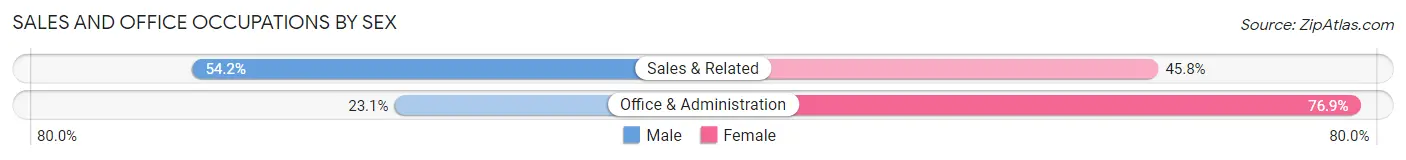
| Occupation | Male | Female |
| Sales & Related | 65 (54.2%) | 55 (45.8%) |
| Office & Administration | 40 (23.1%) | 133 (76.9%) |
| Total (Category) | 105 (35.8%) | 188 (64.2%) |
| Total (Overall) | 807 (54.2%) | 681 (45.8%) |
Natural Resources, Construction and Maintenance Occupations
The most common Natural Resources, Construction and Maintenance occupations in Sewaren are Construction & Extraction (49 | 3.3%), and Installation, Maintenance & Repair (30 | 2.0%).
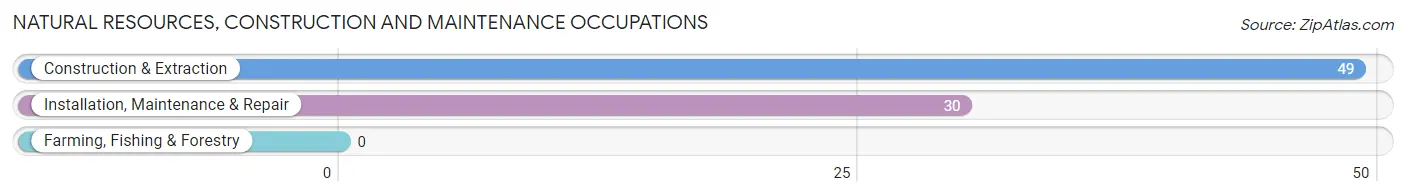
Natural Resources, Construction and Maintenance Occupations by Sex
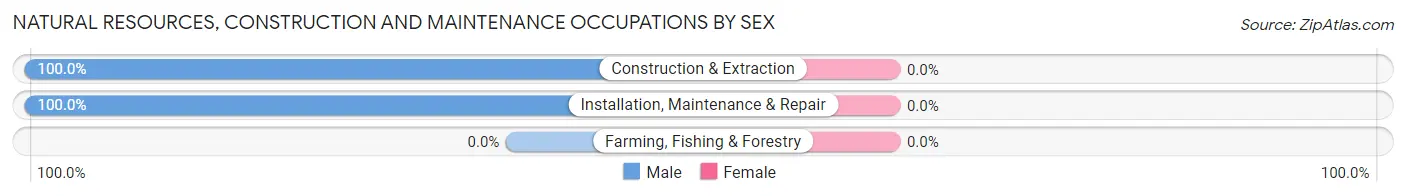
| Occupation | Male | Female |
| Farming, Fishing & Forestry | 0 (0.0%) | 0 (0.0%) |
| Construction & Extraction | 49 (100.0%) | 0 (0.0%) |
| Installation, Maintenance & Repair | 30 (100.0%) | 0 (0.0%) |
| Total (Category) | 79 (100.0%) | 0 (0.0%) |
| Total (Overall) | 807 (54.2%) | 681 (45.8%) |
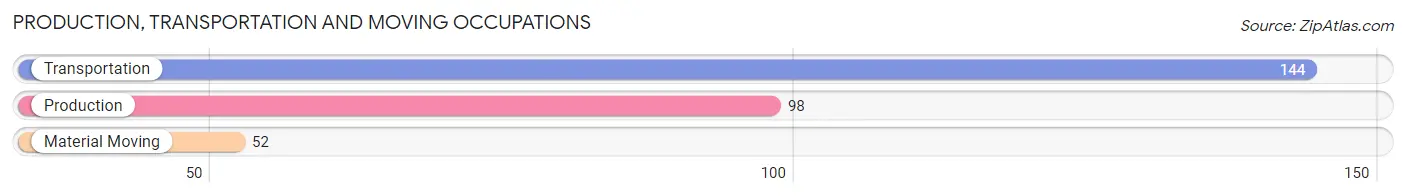
Production, Transportation and Moving Occupations
The most common Production, Transportation and Moving occupations in Sewaren are Transportation (144 | 9.7%), Production (98 | 6.6%), and Material Moving (52 | 3.5%).
Production, Transportation and Moving Occupations by Sex
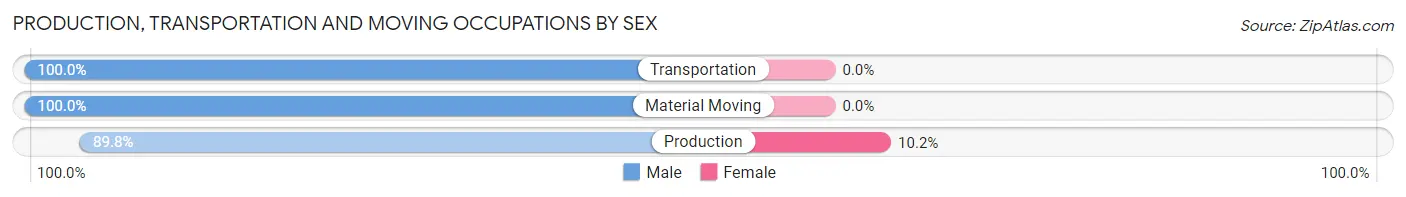
| Occupation | Male | Female |
| Production | 88 (89.8%) | 10 (10.2%) |
| Transportation | 144 (100.0%) | 0 (0.0%) |
| Material Moving | 52 (100.0%) | 0 (0.0%) |
| Total (Category) | 284 (96.6%) | 10 (3.4%) |
| Total (Overall) | 807 (54.2%) | 681 (45.8%) |
Employment Industries by Sex in Sewaren
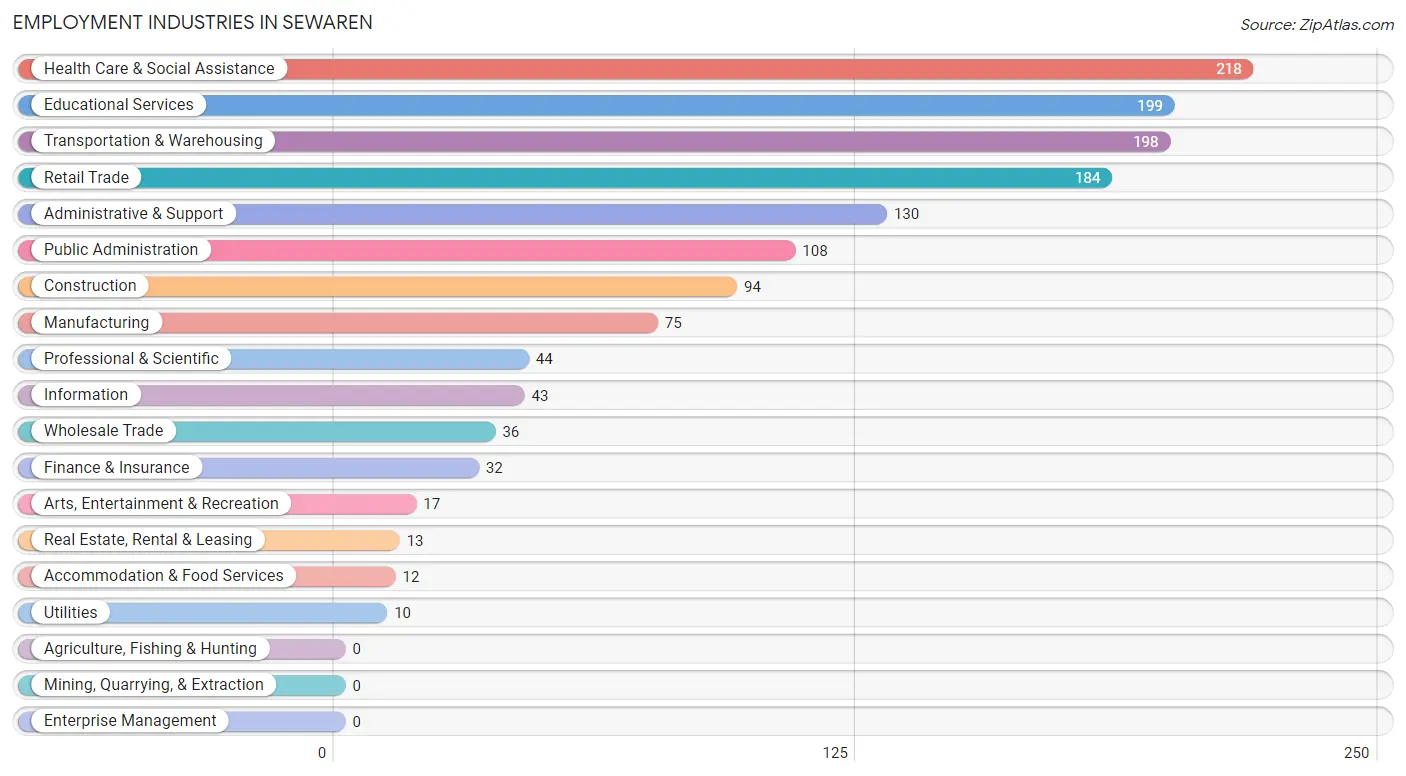
Employment Industries in Sewaren
The major employment industries in Sewaren include Health Care & Social Assistance (218 | 14.6%), Educational Services (199 | 13.4%), Transportation & Warehousing (198 | 13.3%), Retail Trade (184 | 12.4%), and Administrative & Support (130 | 8.7%).
Employment Industries by Sex in Sewaren
The Sewaren industries that see more men than women are Construction (100.0%), Wholesale Trade (100.0%), and Utilities (100.0%), whereas the industries that tend to have a higher number of women are Accommodation & Food Services (100.0%), Educational Services (80.4%), and Real Estate, Rental & Leasing (76.9%).
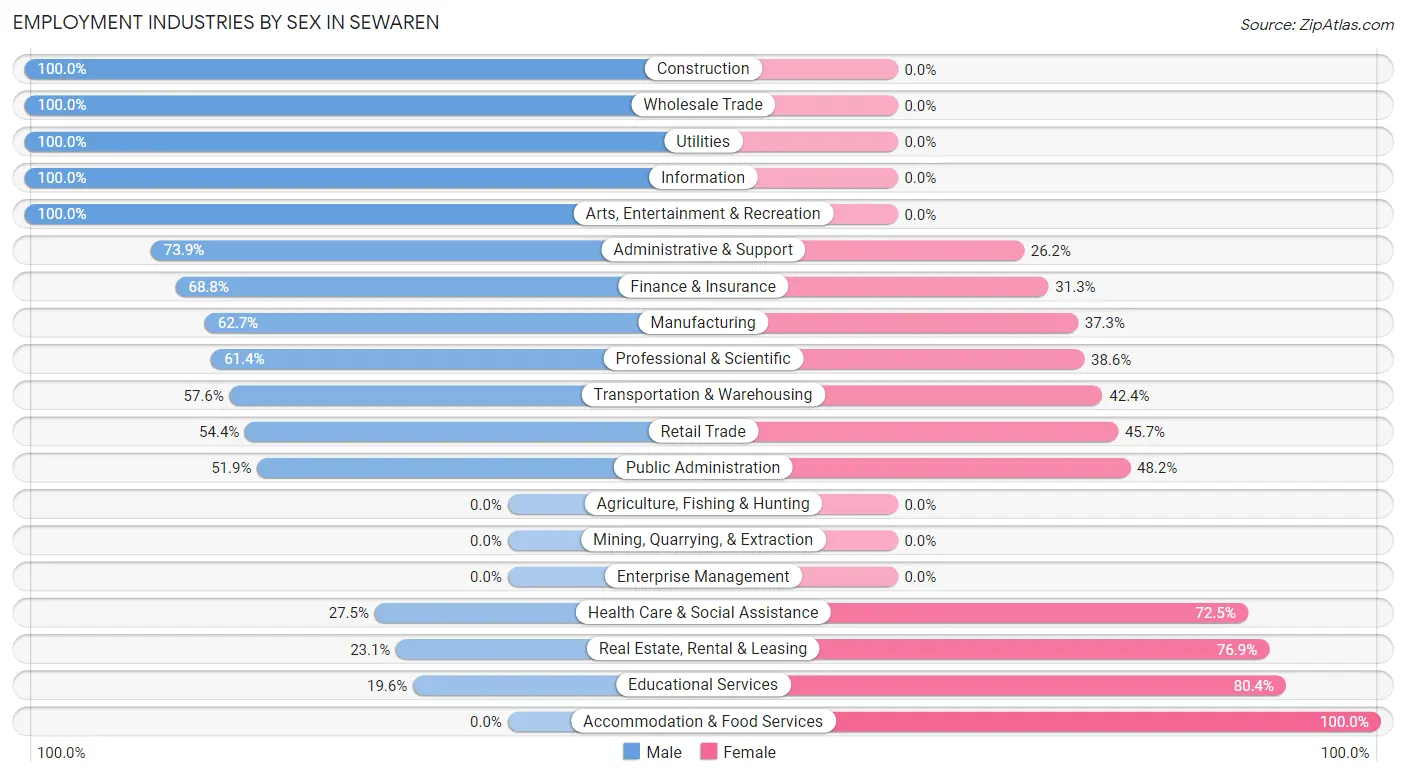
| Industry | Male | Female |
| Agriculture, Fishing & Hunting | 0 (0.0%) | 0 (0.0%) |
| Mining, Quarrying, & Extraction | 0 (0.0%) | 0 (0.0%) |
| Construction | 94 (100.0%) | 0 (0.0%) |
| Manufacturing | 47 (62.7%) | 28 (37.3%) |
| Wholesale Trade | 36 (100.0%) | 0 (0.0%) |
| Retail Trade | 100 (54.3%) | 84 (45.7%) |
| Transportation & Warehousing | 114 (57.6%) | 84 (42.4%) |
| Utilities | 10 (100.0%) | 0 (0.0%) |
| Information | 43 (100.0%) | 0 (0.0%) |
| Finance & Insurance | 22 (68.8%) | 10 (31.2%) |
| Real Estate, Rental & Leasing | 3 (23.1%) | 10 (76.9%) |
| Professional & Scientific | 27 (61.4%) | 17 (38.6%) |
| Enterprise Management | 0 (0.0%) | 0 (0.0%) |
| Administrative & Support | 96 (73.9%) | 34 (26.2%) |
| Educational Services | 39 (19.6%) | 160 (80.4%) |
| Health Care & Social Assistance | 60 (27.5%) | 158 (72.5%) |
| Arts, Entertainment & Recreation | 17 (100.0%) | 0 (0.0%) |
| Accommodation & Food Services | 0 (0.0%) | 12 (100.0%) |
| Public Administration | 56 (51.8%) | 52 (48.1%) |
| Total | 807 (54.2%) | 681 (45.8%) |
Education in Sewaren
School Enrollment in Sewaren
The most common levels of schooling among the 549 students in Sewaren are elementary school (172 | 31.3%), middle school (165 | 30.0%), and college / undergraduate (92 | 16.8%).
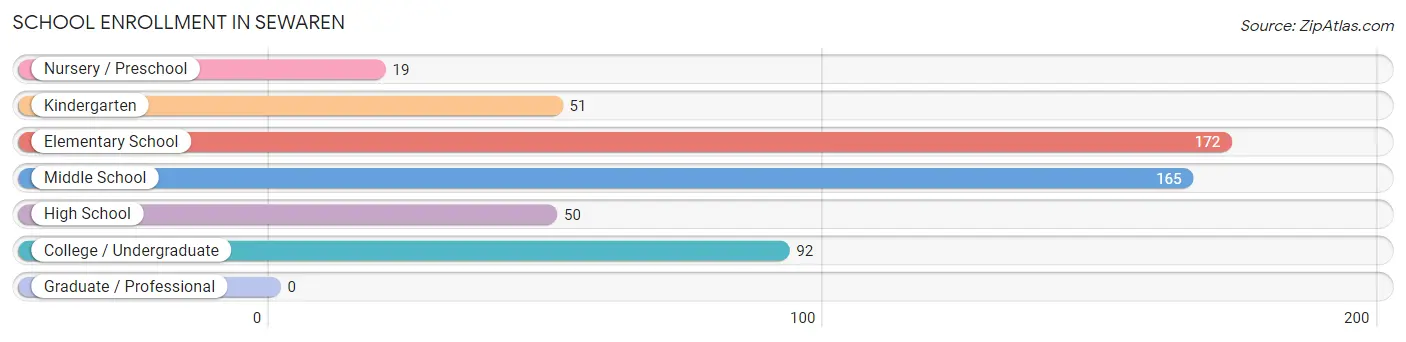
| School Level | # Students | % Students |
| Nursery / Preschool | 19 | 3.5% |
| Kindergarten | 51 | 9.3% |
| Elementary School | 172 | 31.3% |
| Middle School | 165 | 30.0% |
| High School | 50 | 9.1% |
| College / Undergraduate | 92 | 16.8% |
| Graduate / Professional | 0 | 0.0% |
| Total | 549 | 100.0% |
School Enrollment by Age by Funding Source in Sewaren
Out of a total of 549 students who are enrolled in schools in Sewaren, 34 (6.2%) attend a private institution, while the remaining 515 (93.8%) are enrolled in public schools. The age group of 3 to 4 year olds has the highest likelihood of being enrolled in private schools, with 10 (100.0% in the age bracket) enrolled. Conversely, the age group of 10 to 14 year olds has the lowest likelihood of being enrolled in a private school, with 168 (100.0% in the age bracket) attending a public institution.
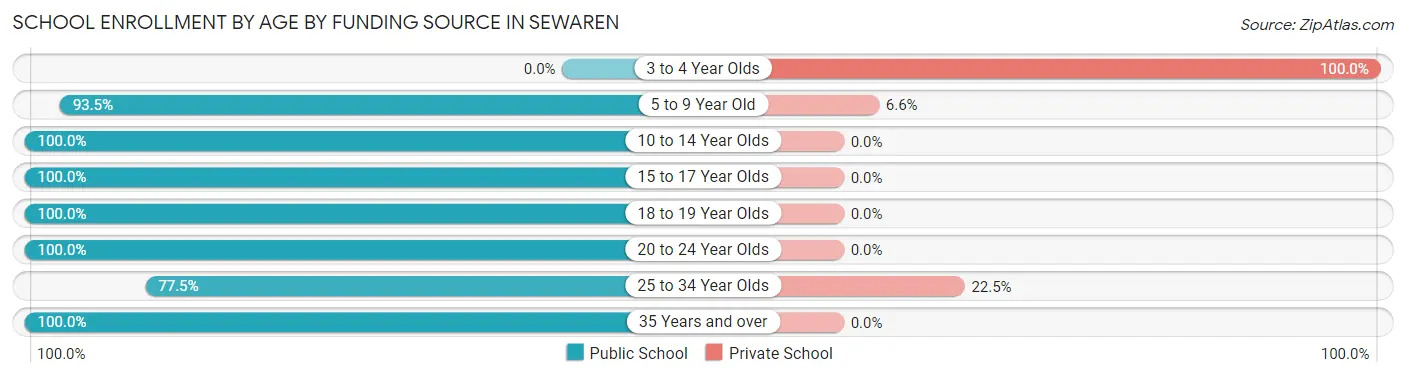
| Age Bracket | Public School | Private School |
| 3 to 4 Year Olds | 0 (0.0%) | 10 (100.0%) |
| 5 to 9 Year Old | 214 (93.4%) | 15 (6.6%) |
| 10 to 14 Year Olds | 168 (100.0%) | 0 (0.0%) |
| 15 to 17 Year Olds | 44 (100.0%) | 0 (0.0%) |
| 18 to 19 Year Olds | 6 (100.0%) | 0 (0.0%) |
| 20 to 24 Year Olds | 43 (100.0%) | 0 (0.0%) |
| 25 to 34 Year Olds | 31 (77.5%) | 9 (22.5%) |
| 35 Years and over | 9 (100.0%) | 0 (0.0%) |
| Total | 515 (93.8%) | 34 (6.2%) |
Educational Attainment by Field of Study in Sewaren
Psychology (129 | 20.0%), visual & performing arts (100 | 15.5%), computers & mathematics (78 | 12.1%), education (78 | 12.1%), and business (66 | 10.2%) are the most common fields of study among 646 individuals in Sewaren who have obtained a bachelor's degree or higher.
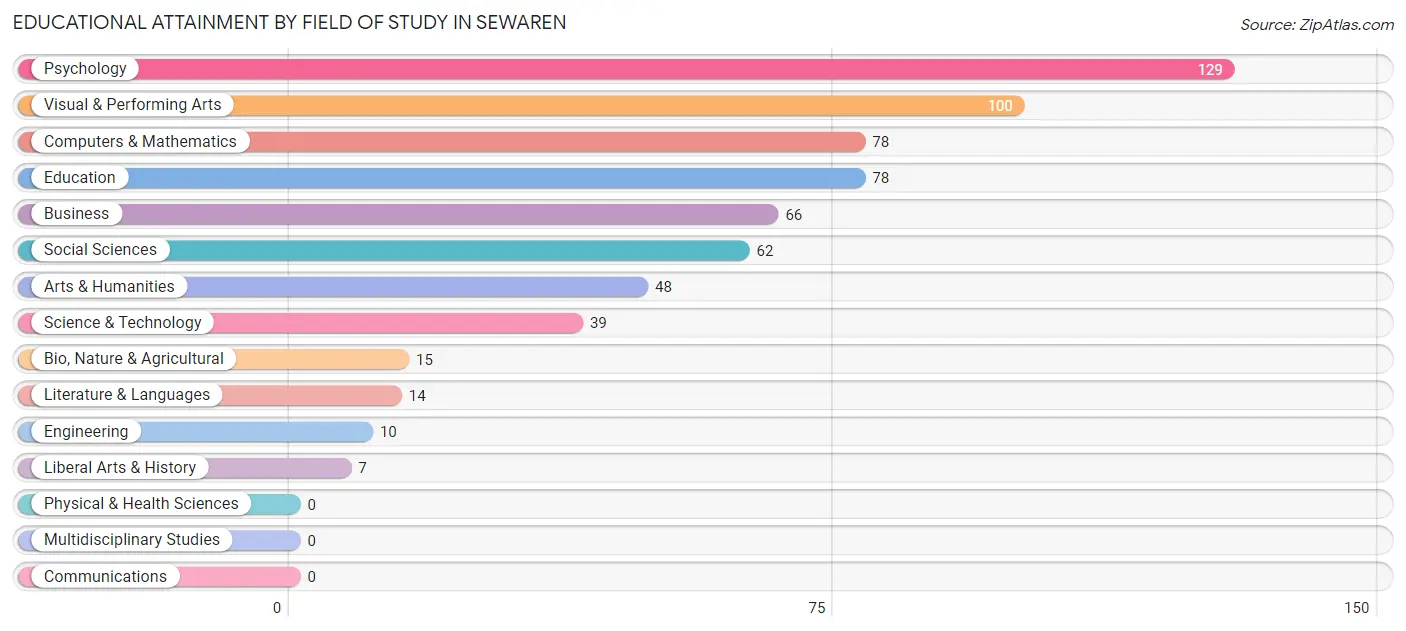
| Field of Study | # Graduates | % Graduates |
| Computers & Mathematics | 78 | 12.1% |
| Bio, Nature & Agricultural | 15 | 2.3% |
| Physical & Health Sciences | 0 | 0.0% |
| Psychology | 129 | 20.0% |
| Social Sciences | 62 | 9.6% |
| Engineering | 10 | 1.5% |
| Multidisciplinary Studies | 0 | 0.0% |
| Science & Technology | 39 | 6.0% |
| Business | 66 | 10.2% |
| Education | 78 | 12.1% |
| Literature & Languages | 14 | 2.2% |
| Liberal Arts & History | 7 | 1.1% |
| Visual & Performing Arts | 100 | 15.5% |
| Communications | 0 | 0.0% |
| Arts & Humanities | 48 | 7.4% |
| Total | 646 | 100.0% |
Transportation & Commute in Sewaren
Vehicle Availability by Sex in Sewaren
The most prevalent vehicle ownership categories in Sewaren are males with 2 vehicles (279, accounting for 36.3%) and females with 2 vehicles (285, making up 41.0%).
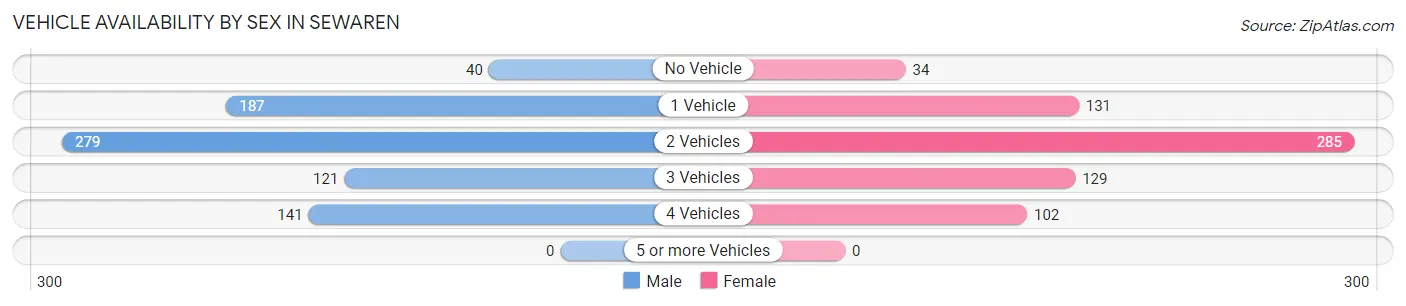
| Vehicles Available | Male | Female |
| No Vehicle | 40 (5.2%) | 34 (5.0%) |
| 1 Vehicle | 187 (24.3%) | 131 (19.2%) |
| 2 Vehicles | 279 (36.3%) | 285 (41.8%) |
| 3 Vehicles | 121 (15.8%) | 129 (18.9%) |
| 4 Vehicles | 141 (18.4%) | 102 (15.0%) |
| 5 or more Vehicles | 0 (0.0%) | 0 (0.0%) |
| Total | 768 (100.0%) | 681 (100.0%) |
Commute Time in Sewaren
The most frequently occuring commute durations in Sewaren are 10 to 14 minutes (230 commuters, 19.1%), 20 to 24 minutes (180 commuters, 15.0%), and 45 to 59 minutes (174 commuters, 14.5%).
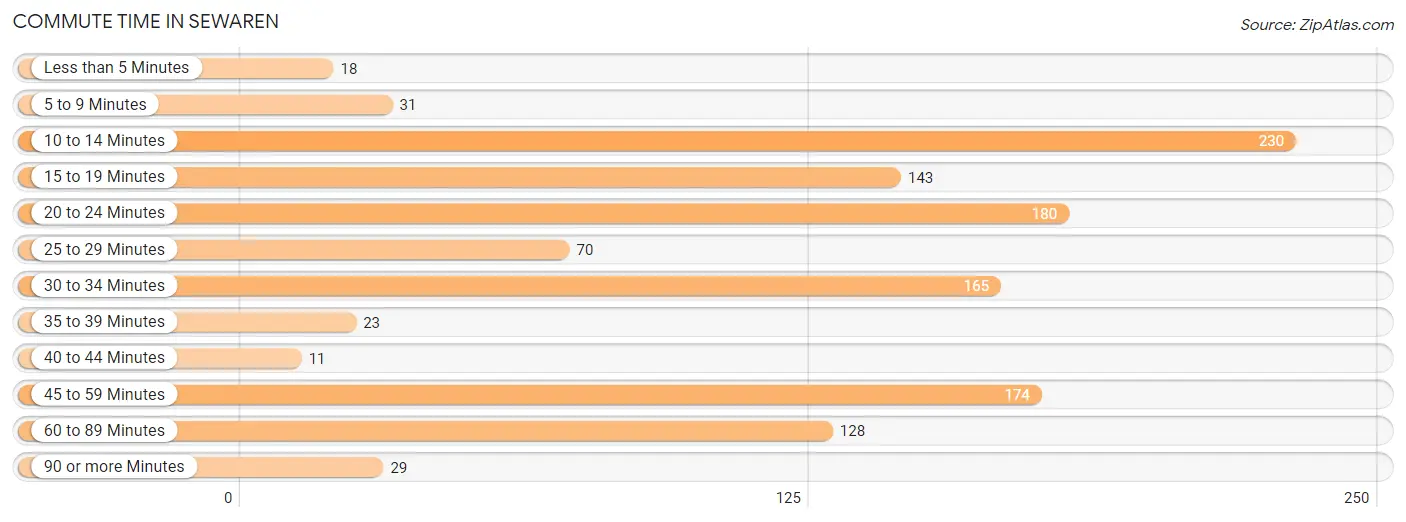
| Commute Time | # Commuters | % Commuters |
| Less than 5 Minutes | 18 | 1.5% |
| 5 to 9 Minutes | 31 | 2.6% |
| 10 to 14 Minutes | 230 | 19.1% |
| 15 to 19 Minutes | 143 | 11.9% |
| 20 to 24 Minutes | 180 | 15.0% |
| 25 to 29 Minutes | 70 | 5.8% |
| 30 to 34 Minutes | 165 | 13.7% |
| 35 to 39 Minutes | 23 | 1.9% |
| 40 to 44 Minutes | 11 | 0.9% |
| 45 to 59 Minutes | 174 | 14.5% |
| 60 to 89 Minutes | 128 | 10.6% |
| 90 or more Minutes | 29 | 2.4% |
Commute Time by Sex in Sewaren
The most common commute times in Sewaren are 10 to 14 minutes (144 commuters, 21.3%) for males and 20 to 24 minutes (107 commuters, 20.3%) for females.
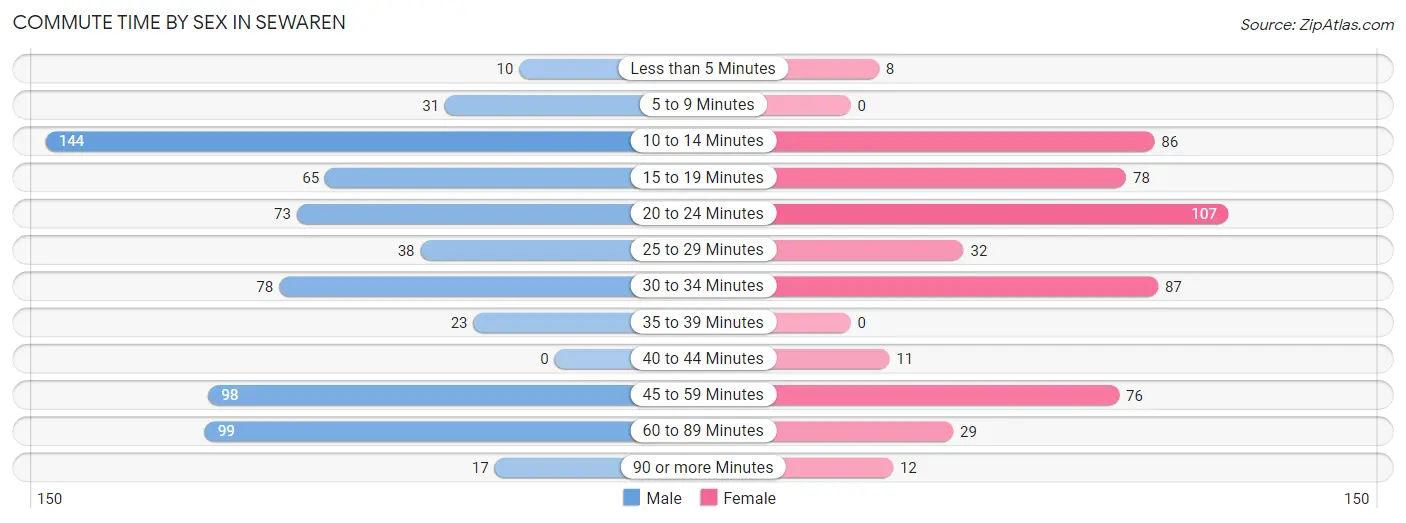
| Commute Time | Male | Female |
| Less than 5 Minutes | 10 (1.5%) | 8 (1.5%) |
| 5 to 9 Minutes | 31 (4.6%) | 0 (0.0%) |
| 10 to 14 Minutes | 144 (21.3%) | 86 (16.4%) |
| 15 to 19 Minutes | 65 (9.6%) | 78 (14.8%) |
| 20 to 24 Minutes | 73 (10.8%) | 107 (20.3%) |
| 25 to 29 Minutes | 38 (5.6%) | 32 (6.1%) |
| 30 to 34 Minutes | 78 (11.5%) | 87 (16.5%) |
| 35 to 39 Minutes | 23 (3.4%) | 0 (0.0%) |
| 40 to 44 Minutes | 0 (0.0%) | 11 (2.1%) |
| 45 to 59 Minutes | 98 (14.5%) | 76 (14.4%) |
| 60 to 89 Minutes | 99 (14.6%) | 29 (5.5%) |
| 90 or more Minutes | 17 (2.5%) | 12 (2.3%) |
Time of Departure to Work by Sex in Sewaren
The most frequent times of departure to work in Sewaren are 12:00 AM to 4:59 AM (104, 15.4%) for males and 7:30 AM to 7:59 AM (94, 17.9%) for females.
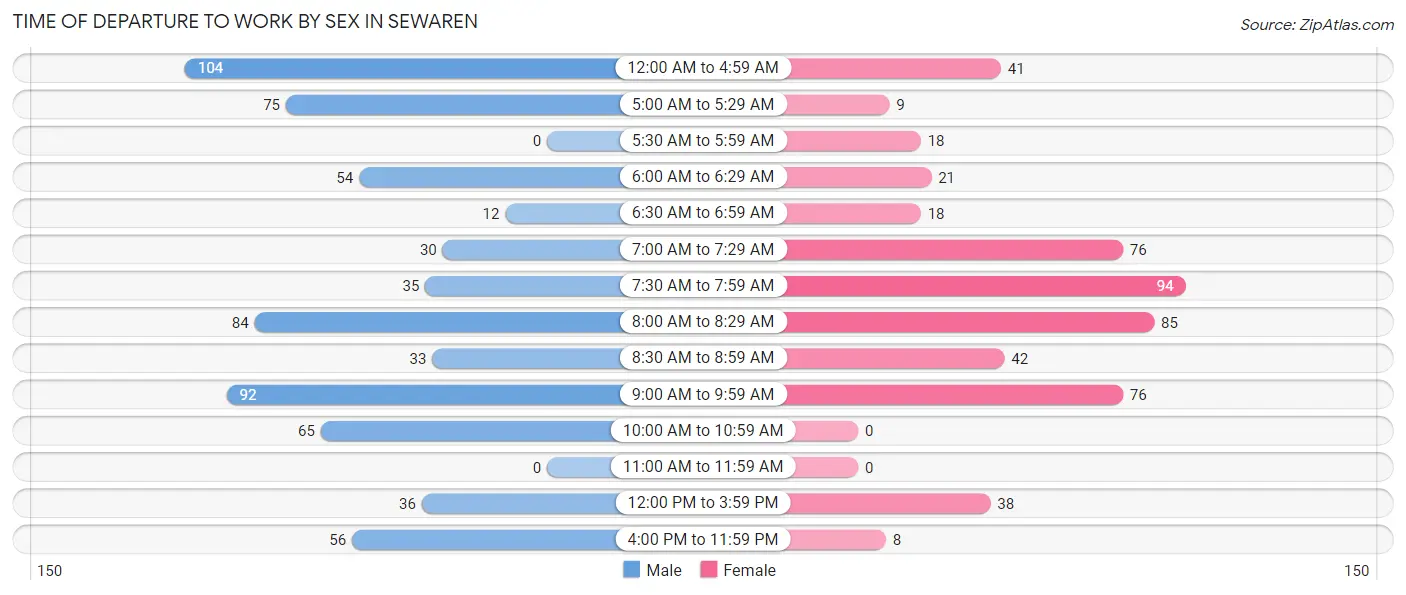
| Time of Departure | Male | Female |
| 12:00 AM to 4:59 AM | 104 (15.4%) | 41 (7.8%) |
| 5:00 AM to 5:29 AM | 75 (11.1%) | 9 (1.7%) |
| 5:30 AM to 5:59 AM | 0 (0.0%) | 18 (3.4%) |
| 6:00 AM to 6:29 AM | 54 (8.0%) | 21 (4.0%) |
| 6:30 AM to 6:59 AM | 12 (1.8%) | 18 (3.4%) |
| 7:00 AM to 7:29 AM | 30 (4.4%) | 76 (14.4%) |
| 7:30 AM to 7:59 AM | 35 (5.2%) | 94 (17.9%) |
| 8:00 AM to 8:29 AM | 84 (12.4%) | 85 (16.2%) |
| 8:30 AM to 8:59 AM | 33 (4.9%) | 42 (8.0%) |
| 9:00 AM to 9:59 AM | 92 (13.6%) | 76 (14.4%) |
| 10:00 AM to 10:59 AM | 65 (9.6%) | 0 (0.0%) |
| 11:00 AM to 11:59 AM | 0 (0.0%) | 0 (0.0%) |
| 12:00 PM to 3:59 PM | 36 (5.3%) | 38 (7.2%) |
| 4:00 PM to 11:59 PM | 56 (8.3%) | 8 (1.5%) |
| Total | 676 (100.0%) | 526 (100.0%) |
Housing Occupancy in Sewaren
Occupancy by Ownership in Sewaren
Of the total 1,084 dwellings in Sewaren, owner-occupied units account for 786 (72.5%), while renter-occupied units make up 298 (27.5%).
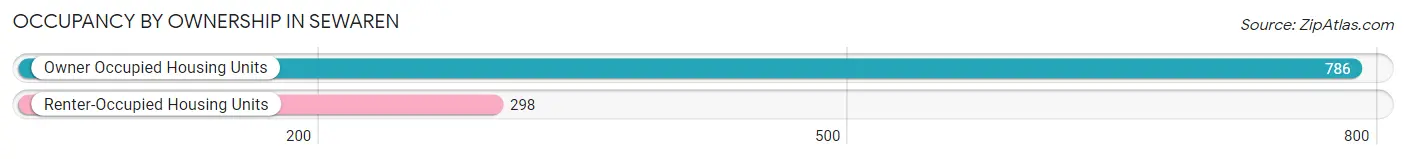
| Occupancy | # Housing Units | % Housing Units |
| Owner Occupied Housing Units | 786 | 72.5% |
| Renter-Occupied Housing Units | 298 | 27.5% |
| Total Occupied Housing Units | 1,084 | 100.0% |
Occupancy by Household Size in Sewaren
| Household Size | # Housing Units | % Housing Units |
| 1-Person Household | 410 | 37.8% |
| 2-Person Household | 148 | 13.7% |
| 3-Person Household | 274 | 25.3% |
| 4+ Person Household | 252 | 23.3% |
| Total Housing Units | 1,084 | 100.0% |
Occupancy by Ownership by Household Size in Sewaren
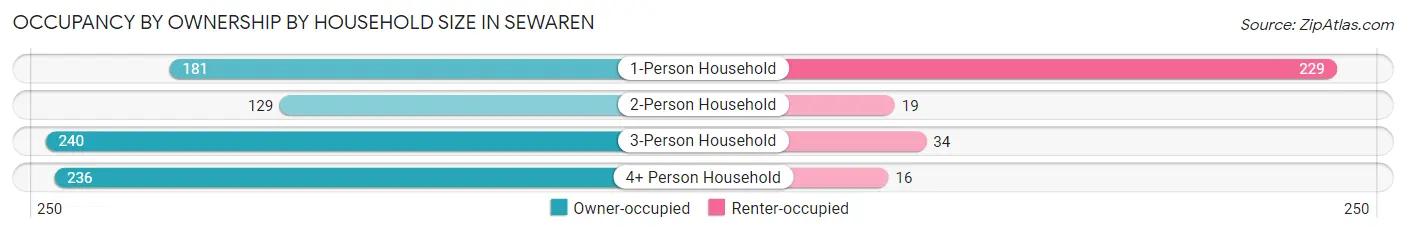
| Household Size | Owner-occupied | Renter-occupied |
| 1-Person Household | 181 (44.2%) | 229 (55.8%) |
| 2-Person Household | 129 (87.2%) | 19 (12.8%) |
| 3-Person Household | 240 (87.6%) | 34 (12.4%) |
| 4+ Person Household | 236 (93.6%) | 16 (6.4%) |
| Total Housing Units | 786 (72.5%) | 298 (27.5%) |
Occupancy by Educational Attainment in Sewaren
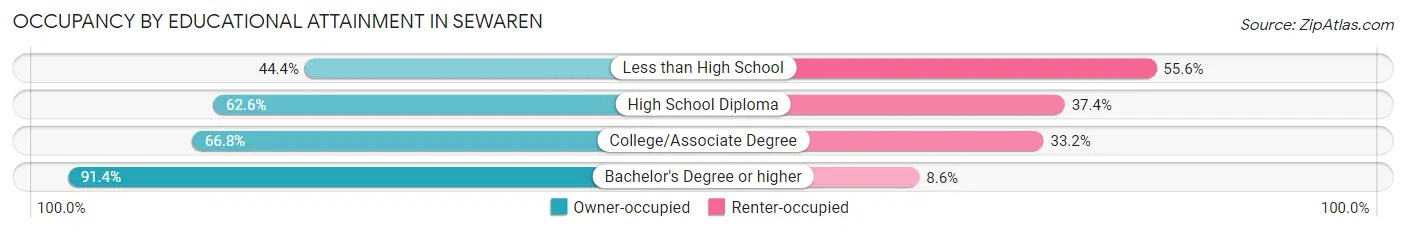
| Household Size | Owner-occupied | Renter-occupied |
| Less than High School | 24 (44.4%) | 30 (55.6%) |
| High School Diploma | 273 (62.6%) | 163 (37.4%) |
| College/Associate Degree | 147 (66.8%) | 73 (33.2%) |
| Bachelor's Degree or higher | 342 (91.4%) | 32 (8.6%) |
Occupancy by Age of Householder in Sewaren
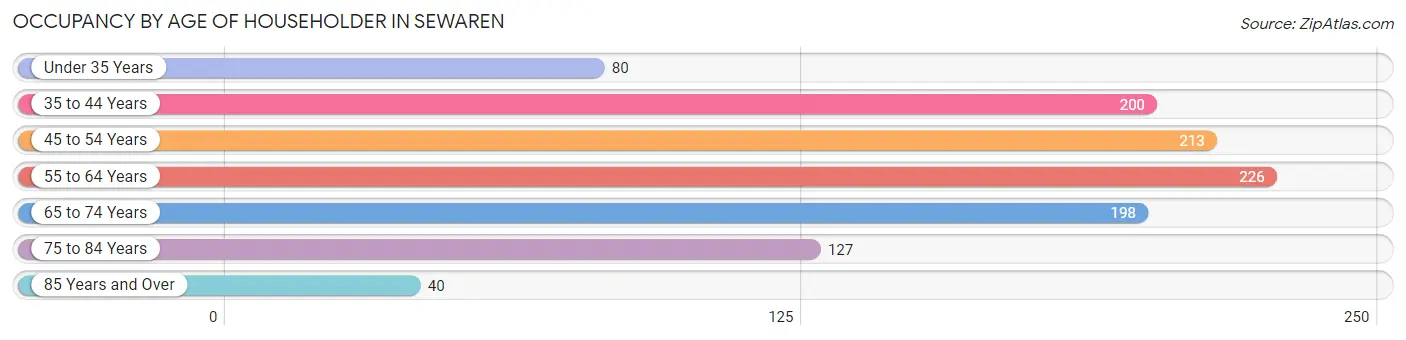
| Age Bracket | # Households | % Households |
| Under 35 Years | 80 | 7.4% |
| 35 to 44 Years | 200 | 18.4% |
| 45 to 54 Years | 213 | 19.7% |
| 55 to 64 Years | 226 | 20.8% |
| 65 to 74 Years | 198 | 18.3% |
| 75 to 84 Years | 127 | 11.7% |
| 85 Years and Over | 40 | 3.7% |
| Total | 1,084 | 100.0% |
Housing Finances in Sewaren
Median Income by Occupancy in Sewaren
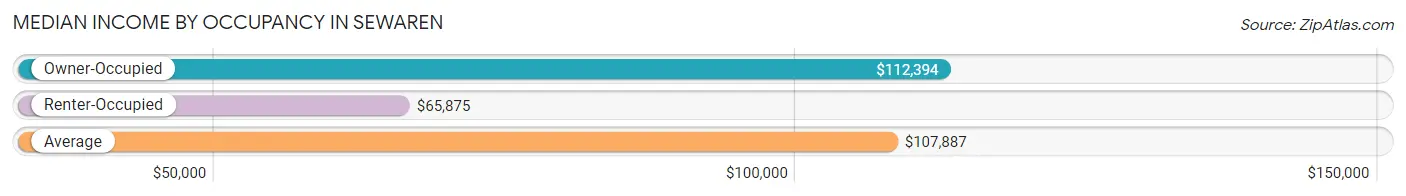
| Occupancy Type | # Households | Median Income |
| Owner-Occupied | 786 (72.5%) | $112,394 |
| Renter-Occupied | 298 (27.5%) | $65,875 |
| Average | 1,084 (100.0%) | $107,887 |
Occupancy by Householder Income Bracket in Sewaren
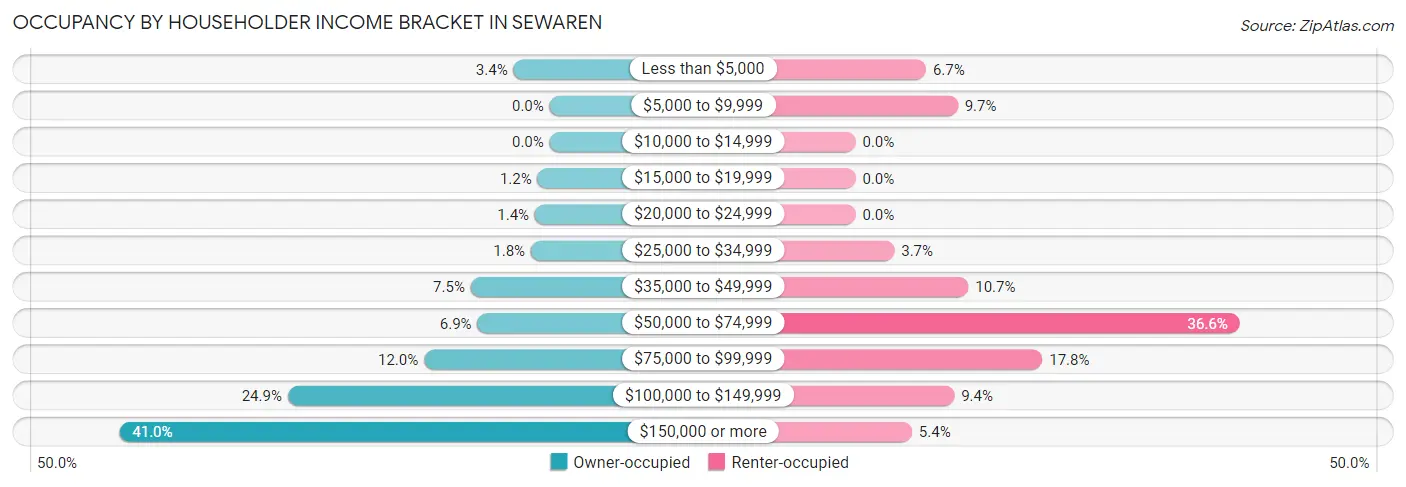
| Income Bracket | Owner-occupied | Renter-occupied |
| Less than $5,000 | 27 (3.4%) | 20 (6.7%) |
| $5,000 to $9,999 | 0 (0.0%) | 29 (9.7%) |
| $10,000 to $14,999 | 0 (0.0%) | 0 (0.0%) |
| $15,000 to $19,999 | 9 (1.1%) | 0 (0.0%) |
| $20,000 to $24,999 | 11 (1.4%) | 0 (0.0%) |
| $25,000 to $34,999 | 14 (1.8%) | 11 (3.7%) |
| $35,000 to $49,999 | 59 (7.5%) | 32 (10.7%) |
| $50,000 to $74,999 | 54 (6.9%) | 109 (36.6%) |
| $75,000 to $99,999 | 94 (12.0%) | 53 (17.8%) |
| $100,000 to $149,999 | 196 (24.9%) | 28 (9.4%) |
| $150,000 or more | 322 (41.0%) | 16 (5.4%) |
| Total | 786 (100.0%) | 298 (100.0%) |
Monthly Housing Cost Tiers in Sewaren
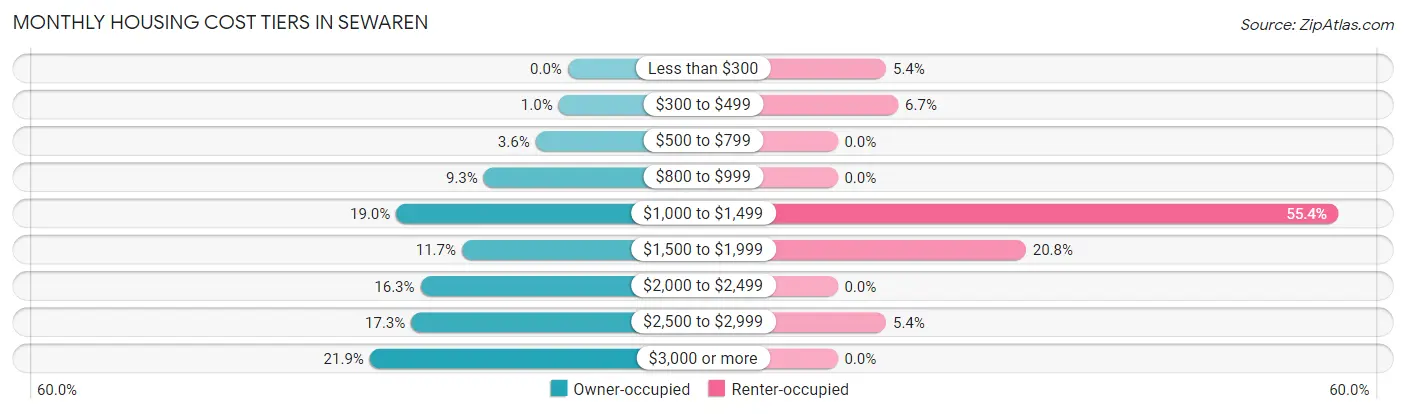
| Monthly Cost | Owner-occupied | Renter-occupied |
| Less than $300 | 0 (0.0%) | 16 (5.4%) |
| $300 to $499 | 8 (1.0%) | 20 (6.7%) |
| $500 to $799 | 28 (3.6%) | 0 (0.0%) |
| $800 to $999 | 73 (9.3%) | 0 (0.0%) |
| $1,000 to $1,499 | 149 (19.0%) | 165 (55.4%) |
| $1,500 to $1,999 | 92 (11.7%) | 62 (20.8%) |
| $2,000 to $2,499 | 128 (16.3%) | 0 (0.0%) |
| $2,500 to $2,999 | 136 (17.3%) | 16 (5.4%) |
| $3,000 or more | 172 (21.9%) | 0 (0.0%) |
| Total | 786 (100.0%) | 298 (100.0%) |
Physical Housing Characteristics in Sewaren
Housing Structures in Sewaren
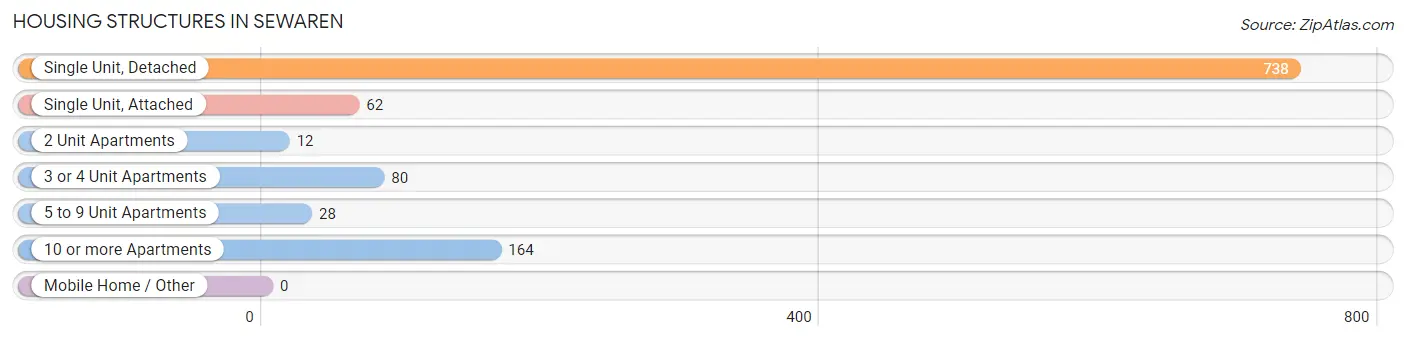
| Structure Type | # Housing Units | % Housing Units |
| Single Unit, Detached | 738 | 68.1% |
| Single Unit, Attached | 62 | 5.7% |
| 2 Unit Apartments | 12 | 1.1% |
| 3 or 4 Unit Apartments | 80 | 7.4% |
| 5 to 9 Unit Apartments | 28 | 2.6% |
| 10 or more Apartments | 164 | 15.1% |
| Mobile Home / Other | 0 | 0.0% |
| Total | 1,084 | 100.0% |
Housing Structures by Occupancy in Sewaren
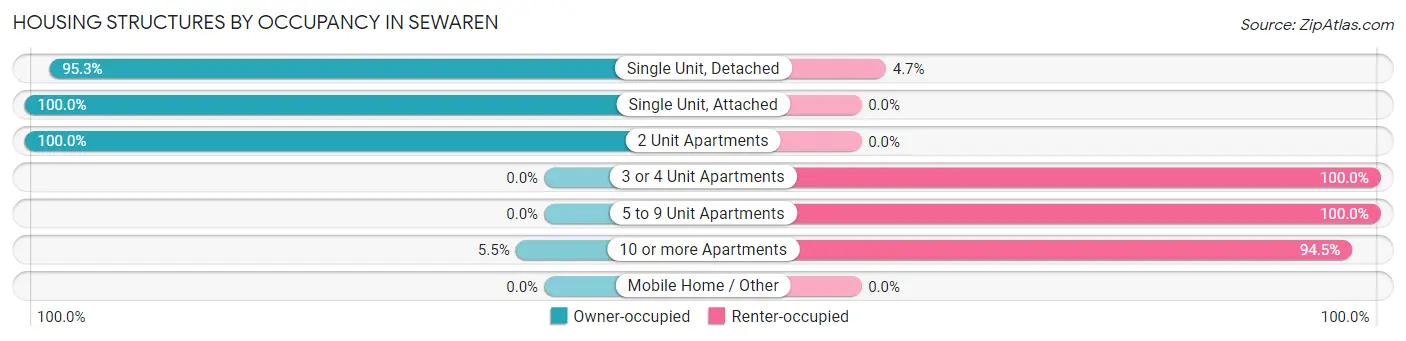
| Structure Type | Owner-occupied | Renter-occupied |
| Single Unit, Detached | 703 (95.3%) | 35 (4.7%) |
| Single Unit, Attached | 62 (100.0%) | 0 (0.0%) |
| 2 Unit Apartments | 12 (100.0%) | 0 (0.0%) |
| 3 or 4 Unit Apartments | 0 (0.0%) | 80 (100.0%) |
| 5 to 9 Unit Apartments | 0 (0.0%) | 28 (100.0%) |
| 10 or more Apartments | 9 (5.5%) | 155 (94.5%) |
| Mobile Home / Other | 0 (0.0%) | 0 (0.0%) |
| Total | 786 (72.5%) | 298 (27.5%) |
Housing Structures by Number of Rooms in Sewaren
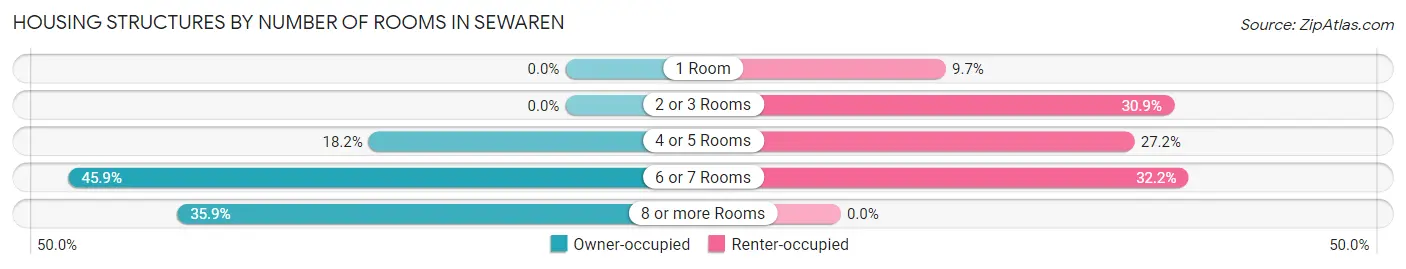
| Number of Rooms | Owner-occupied | Renter-occupied |
| 1 Room | 0 (0.0%) | 29 (9.7%) |
| 2 or 3 Rooms | 0 (0.0%) | 92 (30.9%) |
| 4 or 5 Rooms | 143 (18.2%) | 81 (27.2%) |
| 6 or 7 Rooms | 361 (45.9%) | 96 (32.2%) |
| 8 or more Rooms | 282 (35.9%) | 0 (0.0%) |
| Total | 786 (100.0%) | 298 (100.0%) |
Housing Structure by Heating Type in Sewaren
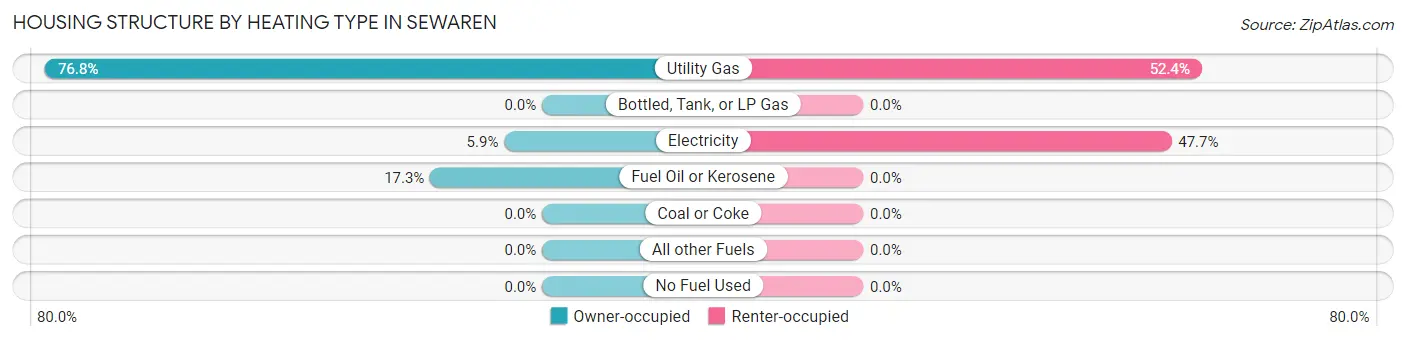
| Heating Type | Owner-occupied | Renter-occupied |
| Utility Gas | 604 (76.8%) | 156 (52.3%) |
| Bottled, Tank, or LP Gas | 0 (0.0%) | 0 (0.0%) |
| Electricity | 46 (5.9%) | 142 (47.6%) |
| Fuel Oil or Kerosene | 136 (17.3%) | 0 (0.0%) |
| Coal or Coke | 0 (0.0%) | 0 (0.0%) |
| All other Fuels | 0 (0.0%) | 0 (0.0%) |
| No Fuel Used | 0 (0.0%) | 0 (0.0%) |
| Total | 786 (100.0%) | 298 (100.0%) |
Household Vehicle Usage in Sewaren
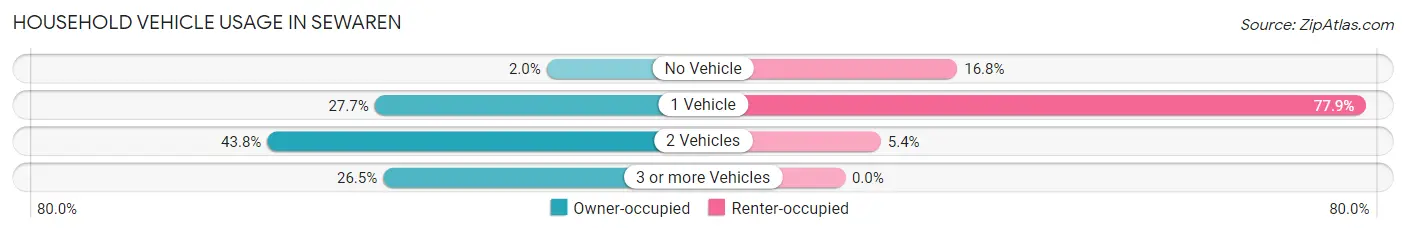
| Vehicles per Household | Owner-occupied | Renter-occupied |
| No Vehicle | 16 (2.0%) | 50 (16.8%) |
| 1 Vehicle | 218 (27.7%) | 232 (77.8%) |
| 2 Vehicles | 344 (43.8%) | 16 (5.4%) |
| 3 or more Vehicles | 208 (26.5%) | 0 (0.0%) |
| Total | 786 (100.0%) | 298 (100.0%) |
Real Estate & Mortgages in Sewaren
Real Estate and Mortgage Overview in Sewaren
| Characteristic | Without Mortgage | With Mortgage |
| Housing Units | 284 | 502 |
| Median Property Value | $325,000 | $392,400 |
| Median Household Income | $111,383 | $227 |
| Monthly Housing Costs | $1,078 | $172 |
| Real Estate Taxes | $8,837 | $29 |
Property Value by Mortgage Status in Sewaren
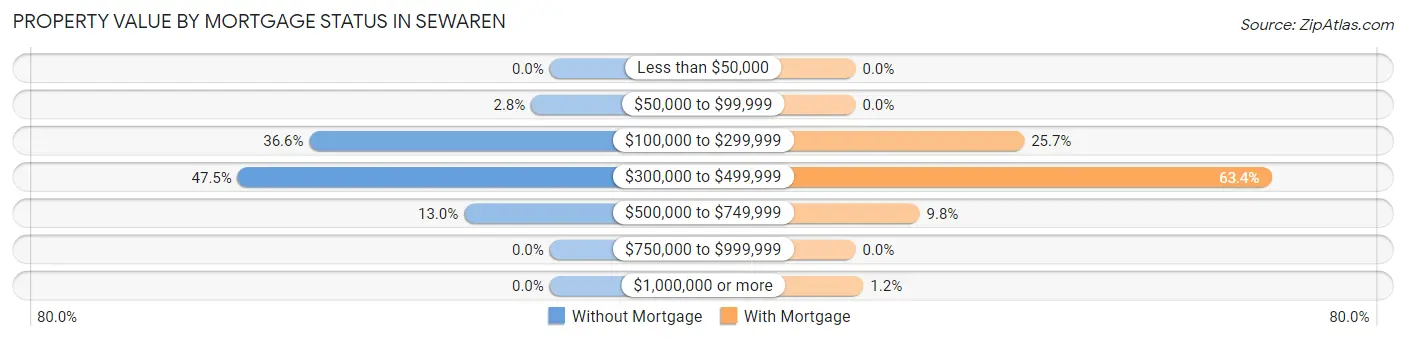
| Property Value | Without Mortgage | With Mortgage |
| Less than $50,000 | 0 (0.0%) | 0 (0.0%) |
| $50,000 to $99,999 | 8 (2.8%) | 0 (0.0%) |
| $100,000 to $299,999 | 104 (36.6%) | 129 (25.7%) |
| $300,000 to $499,999 | 135 (47.5%) | 318 (63.3%) |
| $500,000 to $749,999 | 37 (13.0%) | 49 (9.8%) |
| $750,000 to $999,999 | 0 (0.0%) | 0 (0.0%) |
| $1,000,000 or more | 0 (0.0%) | 6 (1.2%) |
| Total | 284 (100.0%) | 502 (100.0%) |
Household Income by Mortgage Status in Sewaren
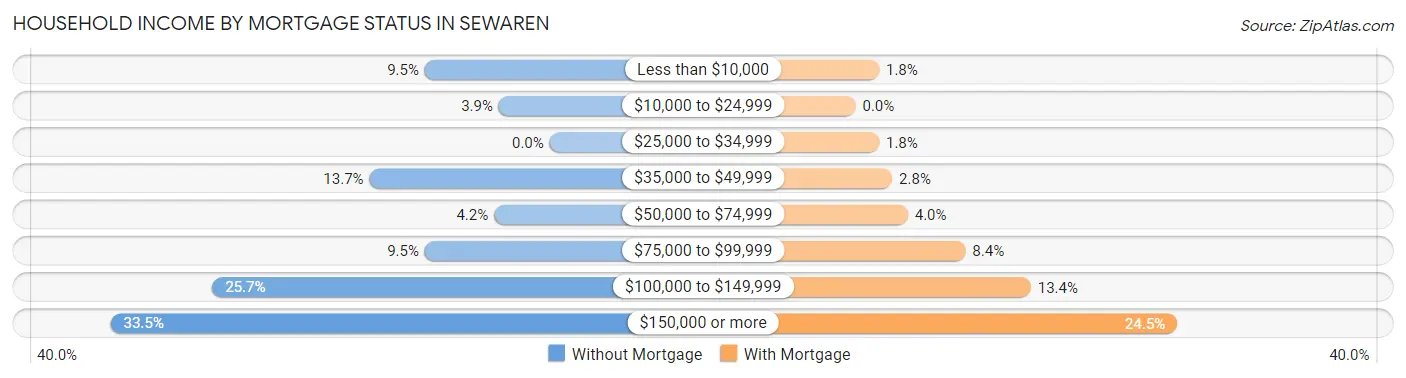
| Household Income | Without Mortgage | With Mortgage |
| Less than $10,000 | 27 (9.5%) | 9 (1.8%) |
| $10,000 to $24,999 | 11 (3.9%) | 0 (0.0%) |
| $25,000 to $34,999 | 0 (0.0%) | 9 (1.8%) |
| $35,000 to $49,999 | 39 (13.7%) | 14 (2.8%) |
| $50,000 to $74,999 | 12 (4.2%) | 20 (4.0%) |
| $75,000 to $99,999 | 27 (9.5%) | 42 (8.4%) |
| $100,000 to $149,999 | 73 (25.7%) | 67 (13.4%) |
| $150,000 or more | 95 (33.5%) | 123 (24.5%) |
| Total | 284 (100.0%) | 502 (100.0%) |
Property Value to Household Income Ratio in Sewaren
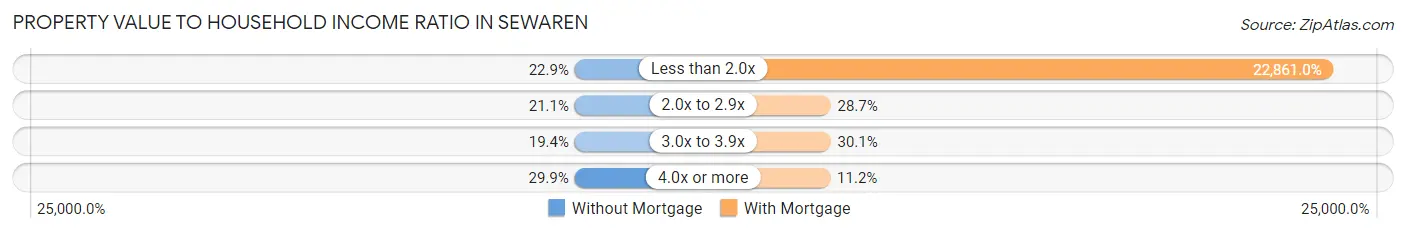
| Value-to-Income Ratio | Without Mortgage | With Mortgage |
| Less than 2.0x | 65 (22.9%) | 114,762 (22,861.0%) |
| 2.0x to 2.9x | 60 (21.1%) | 144 (28.7%) |
| 3.0x to 3.9x | 55 (19.4%) | 151 (30.1%) |
| 4.0x or more | 85 (29.9%) | 56 (11.2%) |
| Total | 284 (100.0%) | 502 (100.0%) |
Real Estate Taxes by Mortgage Status in Sewaren
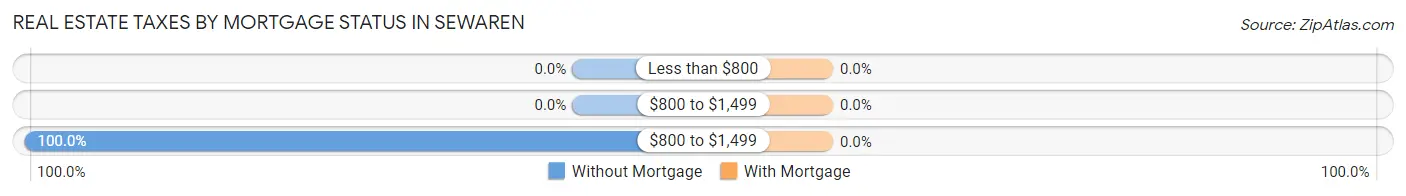
| Property Taxes | Without Mortgage | With Mortgage |
| Less than $800 | 0 (0.0%) | 0 (0.0%) |
| $800 to $1,499 | 0 (0.0%) | 0 (0.0%) |
| $800 to $1,499 | 284 (100.0%) | 0 (0.0%) |
| Total | 284 (100.0%) | 502 (100.0%) |
Health & Disability in Sewaren
Health Insurance Coverage by Age in Sewaren
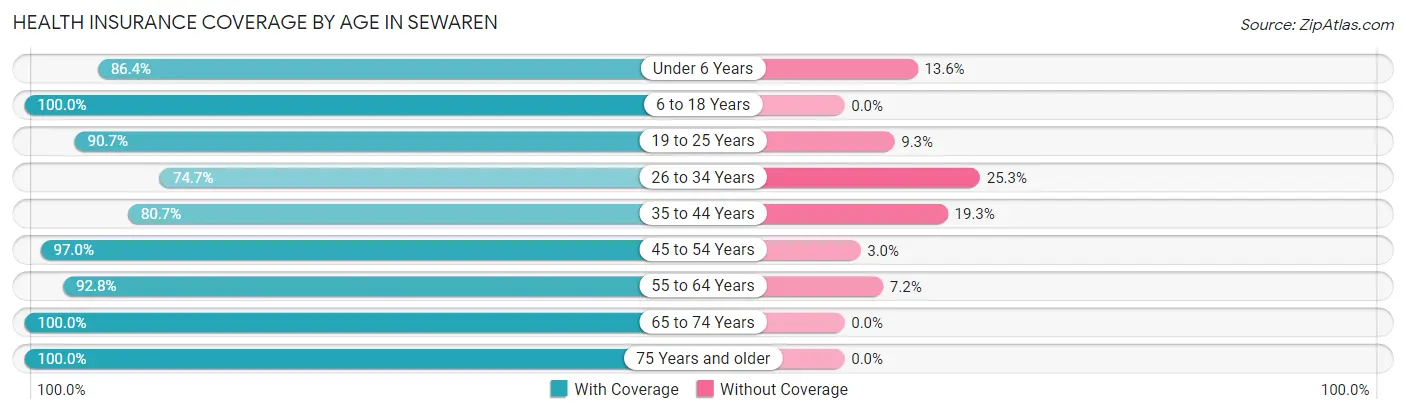
| Age Bracket | With Coverage | Without Coverage |
| Under 6 Years | 95 (86.4%) | 15 (13.6%) |
| 6 to 18 Years | 410 (100.0%) | 0 (0.0%) |
| 19 to 25 Years | 107 (90.7%) | 11 (9.3%) |
| 26 to 34 Years | 139 (74.7%) | 47 (25.3%) |
| 35 to 44 Years | 306 (80.7%) | 73 (19.3%) |
| 45 to 54 Years | 489 (97.0%) | 15 (3.0%) |
| 55 to 64 Years | 374 (92.8%) | 29 (7.2%) |
| 65 to 74 Years | 326 (100.0%) | 0 (0.0%) |
| 75 Years and older | 259 (100.0%) | 0 (0.0%) |
| Total | 2,505 (92.9%) | 190 (7.0%) |
Health Insurance Coverage by Citizenship Status in Sewaren
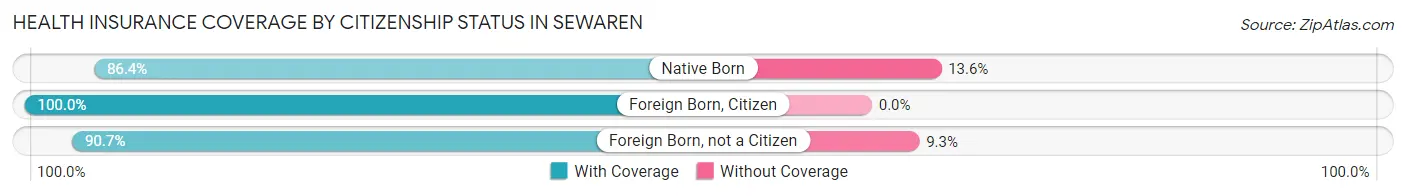
| Citizenship Status | With Coverage | Without Coverage |
| Native Born | 95 (86.4%) | 15 (13.6%) |
| Foreign Born, Citizen | 410 (100.0%) | 0 (0.0%) |
| Foreign Born, not a Citizen | 107 (90.7%) | 11 (9.3%) |
Health Insurance Coverage by Household Income in Sewaren
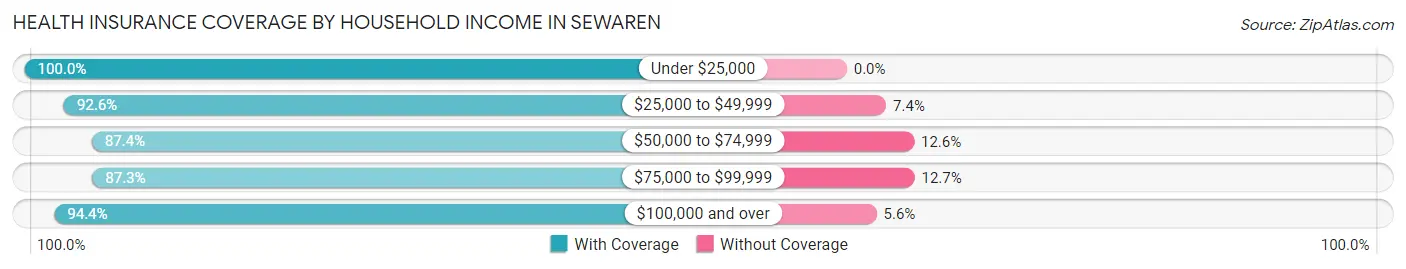
| Household Income | With Coverage | Without Coverage |
| Under $25,000 | 116 (100.0%) | 0 (0.0%) |
| $25,000 to $49,999 | 176 (92.6%) | 14 (7.4%) |
| $50,000 to $74,999 | 215 (87.4%) | 31 (12.6%) |
| $75,000 to $99,999 | 323 (87.3%) | 47 (12.7%) |
| $100,000 and over | 1,659 (94.4%) | 98 (5.6%) |
Public vs Private Health Insurance Coverage by Age in Sewaren
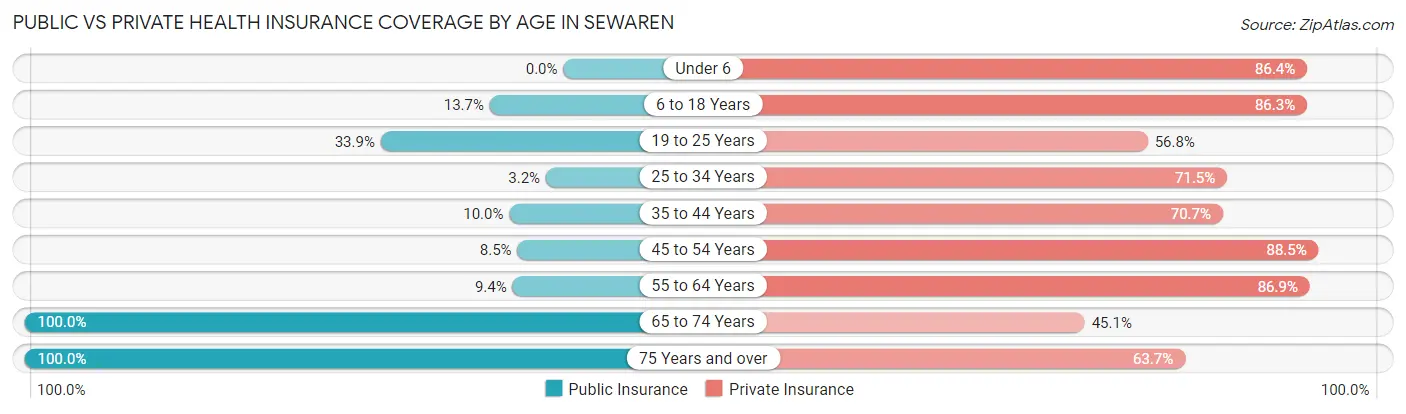
| Age Bracket | Public Insurance | Private Insurance |
| Under 6 | 0 (0.0%) | 95 (86.4%) |
| 6 to 18 Years | 56 (13.7%) | 354 (86.3%) |
| 19 to 25 Years | 40 (33.9%) | 67 (56.8%) |
| 25 to 34 Years | 6 (3.2%) | 133 (71.5%) |
| 35 to 44 Years | 38 (10.0%) | 268 (70.7%) |
| 45 to 54 Years | 43 (8.5%) | 446 (88.5%) |
| 55 to 64 Years | 38 (9.4%) | 350 (86.9%) |
| 65 to 74 Years | 326 (100.0%) | 147 (45.1%) |
| 75 Years and over | 259 (100.0%) | 165 (63.7%) |
| Total | 806 (29.9%) | 2,025 (75.1%) |
Disability Status by Sex by Age in Sewaren
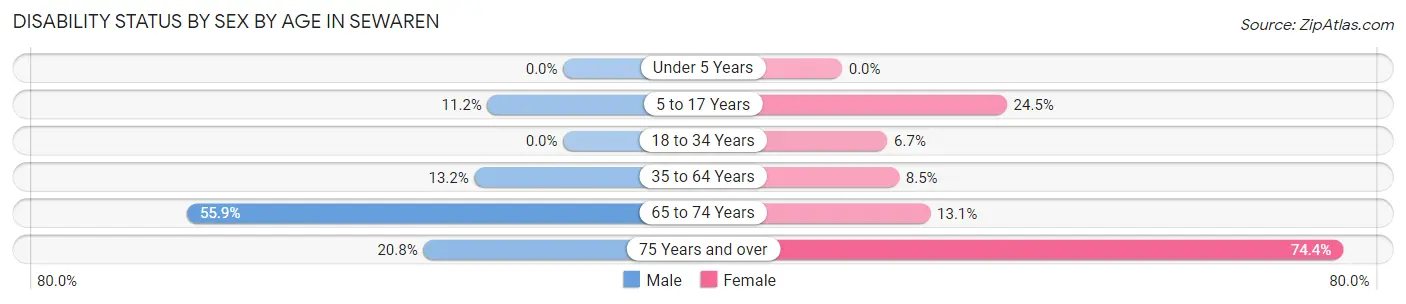
| Age Bracket | Male | Female |
| Under 5 Years | 0 (0.0%) | 0 (0.0%) |
| 5 to 17 Years | 28 (11.2%) | 47 (24.5%) |
| 18 to 34 Years | 0 (0.0%) | 12 (6.7%) |
| 35 to 64 Years | 84 (13.2%) | 55 (8.5%) |
| 65 to 74 Years | 114 (55.9%) | 16 (13.1%) |
| 75 Years and over | 27 (20.8%) | 96 (74.4%) |
Disability Class by Sex by Age in Sewaren
Disability Class: Hearing Difficulty
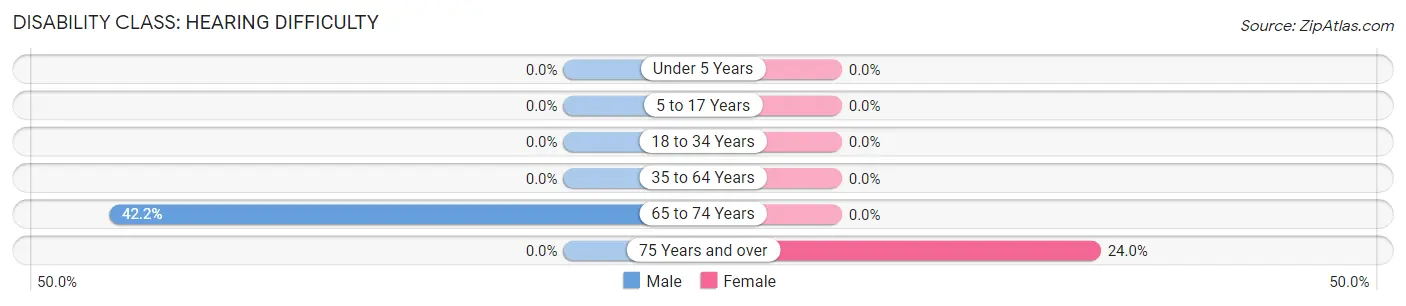
| Age Bracket | Male | Female |
| Under 5 Years | 0 (0.0%) | 0 (0.0%) |
| 5 to 17 Years | 0 (0.0%) | 0 (0.0%) |
| 18 to 34 Years | 0 (0.0%) | 0 (0.0%) |
| 35 to 64 Years | 0 (0.0%) | 0 (0.0%) |
| 65 to 74 Years | 86 (42.2%) | 0 (0.0%) |
| 75 Years and over | 0 (0.0%) | 31 (24.0%) |
Disability Class: Vision Difficulty
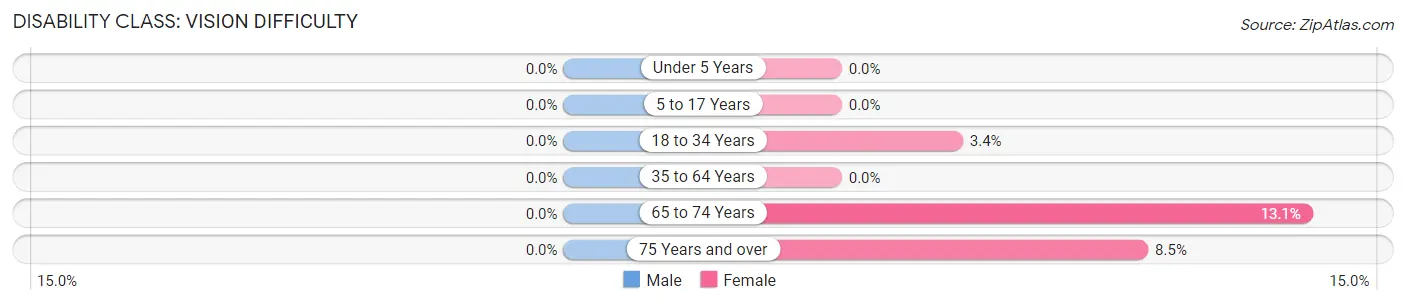
| Age Bracket | Male | Female |
| Under 5 Years | 0 (0.0%) | 0 (0.0%) |
| 5 to 17 Years | 0 (0.0%) | 0 (0.0%) |
| 18 to 34 Years | 0 (0.0%) | 6 (3.4%) |
| 35 to 64 Years | 0 (0.0%) | 0 (0.0%) |
| 65 to 74 Years | 0 (0.0%) | 16 (13.1%) |
| 75 Years and over | 0 (0.0%) | 11 (8.5%) |
Disability Class: Cognitive Difficulty
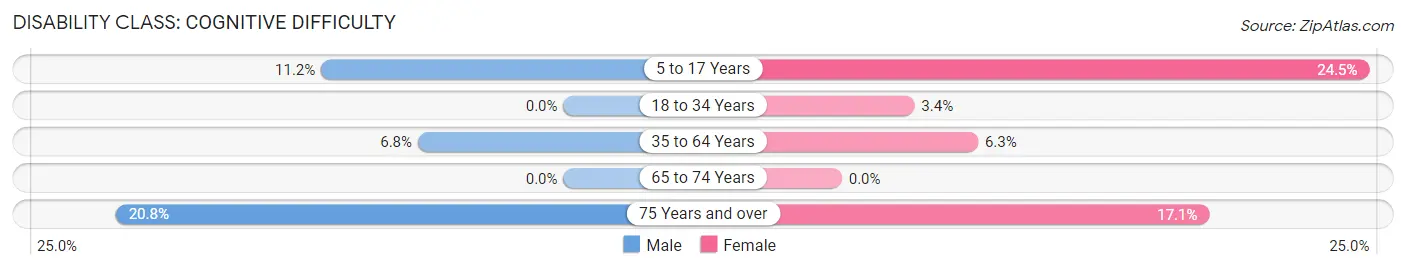
| Age Bracket | Male | Female |
| 5 to 17 Years | 28 (11.2%) | 47 (24.5%) |
| 18 to 34 Years | 0 (0.0%) | 6 (3.4%) |
| 35 to 64 Years | 43 (6.8%) | 41 (6.3%) |
| 65 to 74 Years | 0 (0.0%) | 0 (0.0%) |
| 75 Years and over | 27 (20.8%) | 22 (17.1%) |
Disability Class: Ambulatory Difficulty
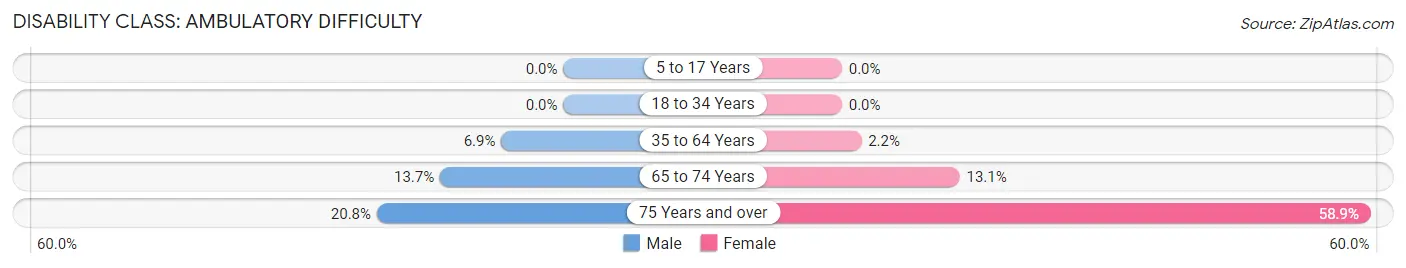
| Age Bracket | Male | Female |
| 5 to 17 Years | 0 (0.0%) | 0 (0.0%) |
| 18 to 34 Years | 0 (0.0%) | 0 (0.0%) |
| 35 to 64 Years | 44 (6.9%) | 14 (2.2%) |
| 65 to 74 Years | 28 (13.7%) | 16 (13.1%) |
| 75 Years and over | 27 (20.8%) | 76 (58.9%) |
Disability Class: Self-Care Difficulty
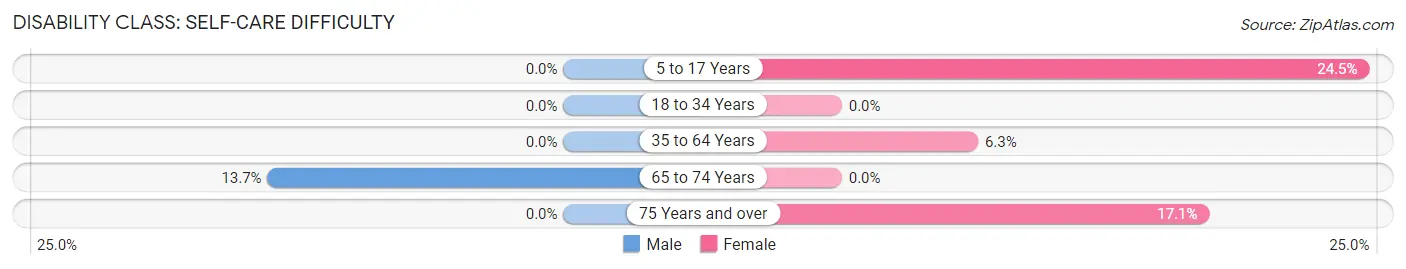
| Age Bracket | Male | Female |
| 5 to 17 Years | 0 (0.0%) | 47 (24.5%) |
| 18 to 34 Years | 0 (0.0%) | 0 (0.0%) |
| 35 to 64 Years | 0 (0.0%) | 41 (6.3%) |
| 65 to 74 Years | 28 (13.7%) | 0 (0.0%) |
| 75 Years and over | 0 (0.0%) | 22 (17.1%) |
Technology Access in Sewaren
Computing Device Access in Sewaren
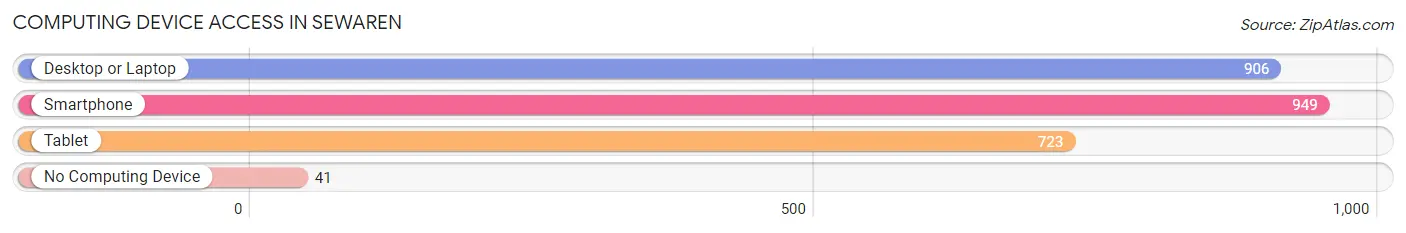
| Device Type | # Households | % Households |
| Desktop or Laptop | 906 | 83.6% |
| Smartphone | 949 | 87.5% |
| Tablet | 723 | 66.7% |
| No Computing Device | 41 | 3.8% |
| Total | 1,084 | 100.0% |
Internet Access in Sewaren
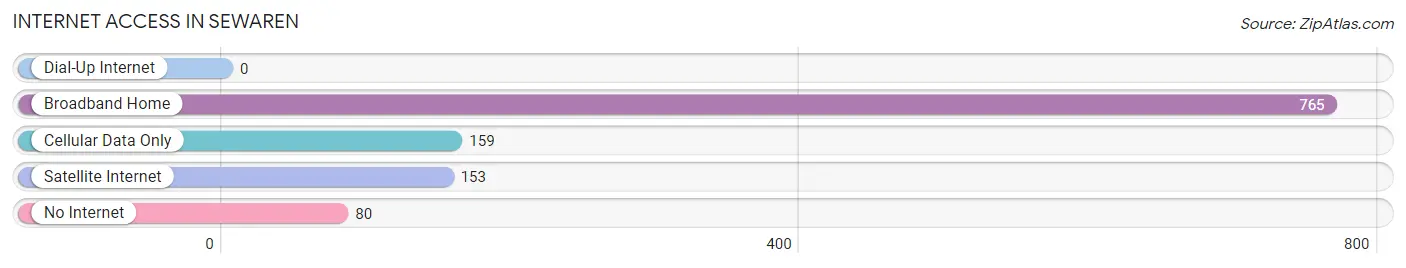
| Internet Type | # Households | % Households |
| Dial-Up Internet | 0 | 0.0% |
| Broadband Home | 765 | 70.6% |
| Cellular Data Only | 159 | 14.7% |
| Satellite Internet | 153 | 14.1% |
| No Internet | 80 | 7.4% |
| Total | 1,084 | 100.0% |
Sewaren Summary
Sewaren is a small borough located in Middlesex County, New Jersey. It is situated on the Arthur Kill, a tidal strait that separates Staten Island from New Jersey. Sewaren is part of the larger Woodbridge Township, and is located approximately 25 miles south of Newark. The population of Sewaren was 2,844 as of the 2010 census.
Geography
Sewaren is located at 40°30'25" North, 74°14'45" West (40.5069, -74.2458). According to the United States Census Bureau, the borough has a total area of 0.7 square miles, all of which is land.
Demographics
As of the 2010 census, there were 2,844 people, 1,093 households, and 790 families residing in the borough. The population density was 4,072.9 people per square mile. The racial makeup of the borough was 79.2% White, 8.2% African American, 0.2% Native American, 6.2% Asian, 0.1% Pacific Islander, 3.2% from other races, and 2.9% from two or more races. Hispanic or Latino of any race were 11.2% of the population.
There were 1,093 households, out of which 33.2% had children under the age of 18 living with them, 54.2% were married couples living together, 11.7% had a female householder with no husband present, and 28.7% were non-families. 22.7% of all households were made up of individuals, and 8.2% had someone living alone who was 65 years of age or older. The average household size was 2.62 and the average family size was 3.09.
In the borough, the population was spread out, with 23.2% under the age of 18, 8.2% from 18 to 24, 30.2% from 25 to 44, 27.2% from 45 to 64, and 11.2% who were 65 years of age or older. The median age was 38 years. For every 100 females, there were 97.2 males. For every 100 females age 18 and over, there were 94.2 males.
The median income for a household in the borough was $68,958, and the median income for a family was $76,944. Males had a median income of $51,932 versus $41,250 for females. The per capita income for the borough was $30,945. About 3.2% of families and 4.3% of the population were below the poverty line, including 5.2% of those under age 18 and 4.2% of those age 65 or over.
Economy
Sewaren is a small borough with a limited economy. The majority of the borough’s residents are employed in the service industry, with many working in nearby Woodbridge Township. The borough is also home to a few small businesses, including a gas station, a convenience store, and a few restaurants.
The borough is served by the Port Reading Branch of the New Jersey Transit rail system, which provides access to Newark and New York City. The borough is also served by several bus lines, including the NJ Transit Bus Route 810, which runs between Sewaren and Newark.
Conclusion
Sewaren is a small borough located in Middlesex County, New Jersey. It is situated on the Arthur Kill, a tidal strait that separates Staten Island from New Jersey. The population of Sewaren was 2,844 as of the 2010 census. The borough has a limited economy, with most of its residents employed in the service industry. Sewaren is served by the Port Reading Branch of the New Jersey Transit rail system, as well as several bus lines.
Common Questions
What is Per Capita Income in Sewaren?
Per Capita income in Sewaren is $47,387.
What is the Median Family Income in Sewaren?
Median Family Income in Sewaren is $112,101.
What is the Median Household income in Sewaren?
Median Household Income in Sewaren is $107,887.
What is Income or Wage Gap in Sewaren?
Income or Wage Gap in Sewaren is 7.0%.
Women in Sewaren earn 93.0 cents for every dollar earned by a man.
What is Inequality or Gini Index in Sewaren?
Inequality or Gini Index in Sewaren is 0.36.
What is the Total Population of Sewaren?
Total Population of Sewaren is 2,695.
What is the Total Male Population of Sewaren?
Total Male Population of Sewaren is 1,382.
What is the Total Female Population of Sewaren?
Total Female Population of Sewaren is 1,313.
What is the Ratio of Males per 100 Females in Sewaren?
There are 105.26 Males per 100 Females in Sewaren.
What is the Ratio of Females per 100 Males in Sewaren?
There are 95.01 Females per 100 Males in Sewaren.
What is the Median Population Age in Sewaren?
Median Population Age in Sewaren is 48.1 Years.
What is the Average Family Size in Sewaren
Average Family Size in Sewaren is 3.4 People.
What is the Average Household Size in Sewaren
Average Household Size in Sewaren is 2.5 People.
How Large is the Labor Force in Sewaren?
There are 1,576 People in the Labor Forcein in Sewaren.
What is the Percentage of People in the Labor Force in Sewaren?
71.3% of People are in the Labor Force in Sewaren.
What is the Unemployment Rate in Sewaren?
Unemployment Rate in Sewaren is 5.6%.