Cities with the Largest Egyptian Community in New Jersey
RELATED REPORTS & OPTIONS
Egyptian
New Jersey
Compare Cities
Map of Cities with the Largest Egyptian Community in New Jersey
0
6,000
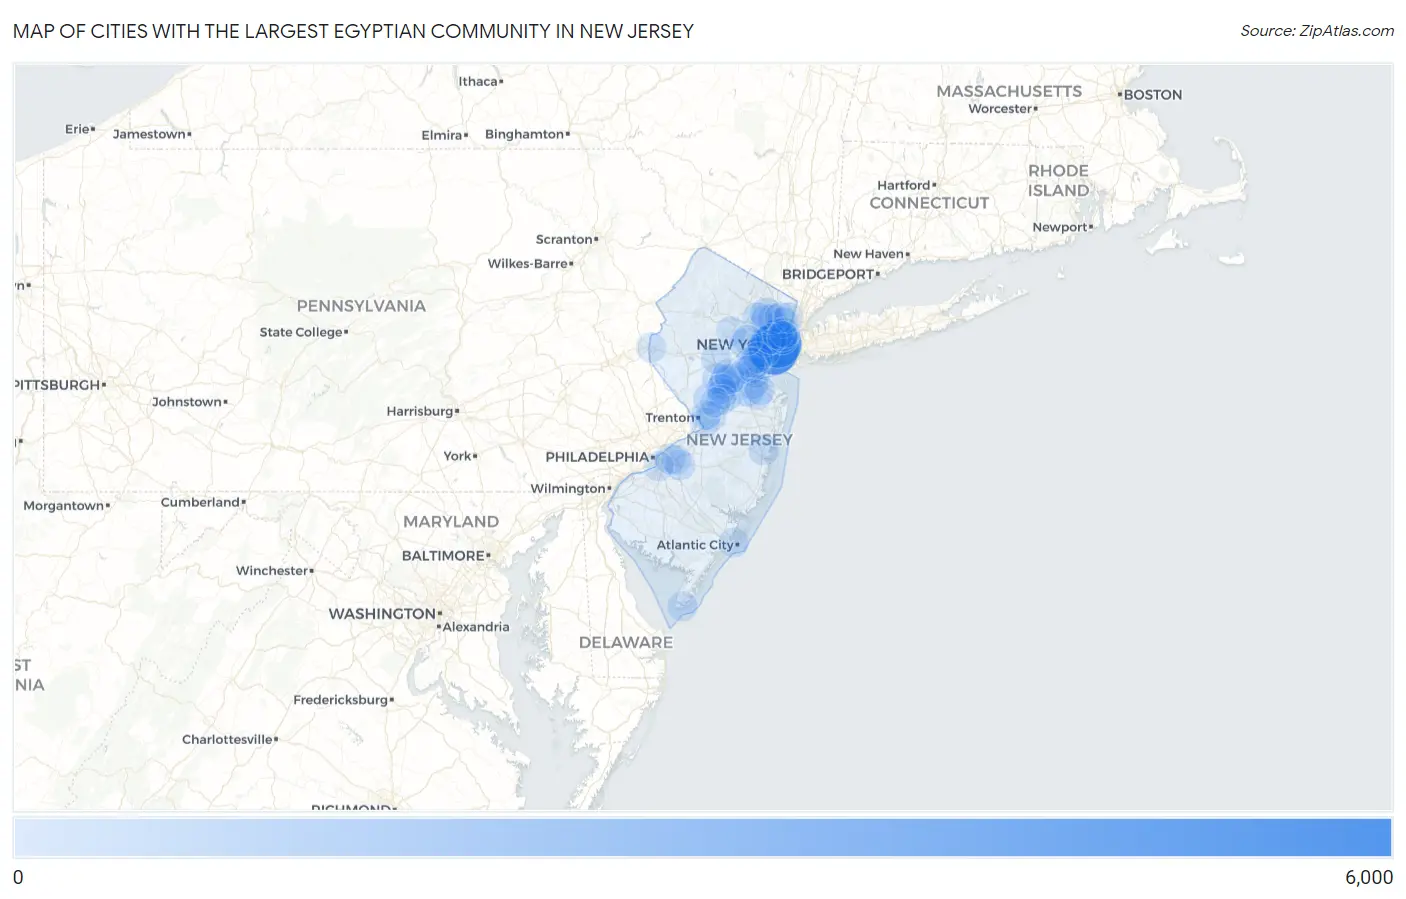
Cities with the Largest Egyptian Community in New Jersey
| City | Egyptian | vs State | vs National | |
| 1. | Bayonne | 5,781 | 46,159(12.52%)#1 | 309,357(1.87%)#4 |
| 2. | Jersey City | 5,387 | 46,159(11.67%)#2 | 309,357(1.74%)#5 |
| 3. | Clifton | 938 | 46,159(2.03%)#3 | 309,357(0.30%)#22 |
| 4. | Tinton Falls Borough | 854 | 46,159(1.85%)#4 | 309,357(0.28%)#26 |
| 5. | Sayreville Borough | 810 | 46,159(1.75%)#5 | 309,357(0.26%)#29 |
| 6. | Elizabeth | 612 | 46,159(1.33%)#6 | 309,357(0.20%)#54 |
| 7. | Union Beach Borough | 576 | 46,159(1.25%)#7 | 309,357(0.19%)#60 |
| 8. | Paterson | 544 | 46,159(1.18%)#8 | 309,357(0.18%)#66 |
| 9. | Milltown Borough | 503 | 46,159(1.09%)#9 | 309,357(0.16%)#74 |
| 10. | Preakness | 480 | 46,159(1.04%)#10 | 309,357(0.16%)#78 |
| 11. | Middlesex Borough | 447 | 46,159(0.97%)#11 | 309,357(0.14%)#84 |
| 12. | Fairview Borough | 419 | 46,159(0.91%)#12 | 309,357(0.14%)#94 |
| 13. | North Arlington Borough | 389 | 46,159(0.84%)#13 | 309,357(0.13%)#107 |
| 14. | Old Bridge | 365 | 46,159(0.79%)#14 | 309,357(0.12%)#121 |
| 15. | Dunellen Borough | 355 | 46,159(0.77%)#15 | 309,357(0.11%)#127 |
| 16. | Madison Park | 352 | 46,159(0.76%)#16 | 309,357(0.11%)#129 |
| 17. | Summit | 314 | 46,159(0.68%)#17 | 309,357(0.10%)#150 |
| 18. | Ridgefield Park | 313 | 46,159(0.68%)#18 | 309,357(0.10%)#151 |
| 19. | South River Borough | 301 | 46,159(0.65%)#19 | 309,357(0.10%)#159 |
| 20. | Little Ferry Borough | 285 | 46,159(0.62%)#20 | 309,357(0.09%)#170 |
| 21. | Princeton | 273 | 46,159(0.59%)#21 | 309,357(0.09%)#175 |
| 22. | Fair Lawn Borough | 257 | 46,159(0.56%)#22 | 309,357(0.08%)#191 |
| 23. | Lodi Borough | 255 | 46,159(0.55%)#23 | 309,357(0.08%)#192 |
| 24. | Hoboken | 234 | 46,159(0.51%)#24 | 309,357(0.08%)#210 |
| 25. | Dayton | 234 | 46,159(0.51%)#25 | 309,357(0.08%)#211 |
| 26. | Cherry Hill Mall | 215 | 46,159(0.47%)#26 | 309,357(0.07%)#236 |
| 27. | Perth Amboy | 210 | 46,159(0.45%)#27 | 309,357(0.07%)#246 |
| 28. | Newark | 208 | 46,159(0.45%)#28 | 309,357(0.07%)#248 |
| 29. | Mount Arlington Borough | 207 | 46,159(0.45%)#29 | 309,357(0.07%)#252 |
| 30. | Hillsborough | 206 | 46,159(0.45%)#30 | 309,357(0.07%)#254 |
| 31. | Fords | 204 | 46,159(0.44%)#31 | 309,357(0.07%)#255 |
| 32. | Toms River | 197 | 46,159(0.43%)#32 | 309,357(0.06%)#264 |
| 33. | Secaucus | 197 | 46,159(0.43%)#33 | 309,357(0.06%)#265 |
| 34. | Blackwells Mills | 197 | 46,159(0.43%)#34 | 309,357(0.06%)#266 |
| 35. | Franklin Park | 193 | 46,159(0.42%)#35 | 309,357(0.06%)#273 |
| 36. | Garfield | 191 | 46,159(0.41%)#36 | 309,357(0.06%)#278 |
| 37. | Avenel | 188 | 46,159(0.41%)#37 | 309,357(0.06%)#289 |
| 38. | Fort Lee Borough | 176 | 46,159(0.38%)#38 | 309,357(0.06%)#307 |
| 39. | Singac | 171 | 46,159(0.37%)#39 | 309,357(0.06%)#316 |
| 40. | Sicklerville | 170 | 46,159(0.37%)#40 | 309,357(0.05%)#319 |
| 41. | Marlton | 170 | 46,159(0.37%)#41 | 309,357(0.05%)#323 |
| 42. | Hackensack | 165 | 46,159(0.36%)#42 | 309,357(0.05%)#332 |
| 43. | Monmouth Junction | 155 | 46,159(0.34%)#43 | 309,357(0.05%)#358 |
| 44. | Linden | 153 | 46,159(0.33%)#44 | 309,357(0.05%)#363 |
| 45. | Six Mile Run | 148 | 46,159(0.32%)#45 | 309,357(0.05%)#374 |
| 46. | Somerset | 144 | 46,159(0.31%)#46 | 309,357(0.05%)#381 |
| 47. | Kearny | 142 | 46,159(0.31%)#47 | 309,357(0.05%)#390 |
| 48. | Franklin Lakes Borough | 142 | 46,159(0.31%)#48 | 309,357(0.05%)#393 |
| 49. | Cape May | 131 | 46,159(0.28%)#49 | 309,357(0.04%)#417 |
| 50. | Bridgewater Center | 125 | 46,159(0.27%)#50 | 309,357(0.04%)#434 |
| 51. | New Brunswick | 121 | 46,159(0.26%)#51 | 309,357(0.04%)#445 |
| 52. | Kendall Park | 120 | 46,159(0.26%)#52 | 309,357(0.04%)#448 |
| 53. | Mckee | 119 | 46,159(0.26%)#53 | 309,357(0.04%)#451 |
| 54. | Ho Ho Kus Borough | 116 | 46,159(0.25%)#54 | 309,357(0.04%)#461 |
| 55. | Hamilton Square | 112 | 46,159(0.24%)#55 | 309,357(0.04%)#472 |
| 56. | Voorhees | 110 | 46,159(0.24%)#56 | 309,357(0.04%)#482 |
| 57. | Strathmore | 108 | 46,159(0.23%)#57 | 309,357(0.03%)#488 |
| 58. | Woodbridge | 106 | 46,159(0.23%)#58 | 309,357(0.03%)#495 |
| 59. | New Providence Borough | 106 | 46,159(0.23%)#59 | 309,357(0.03%)#497 |
| 60. | Green Knoll | 103 | 46,159(0.22%)#60 | 309,357(0.03%)#509 |
| 61. | Glen Ridge Borough | 102 | 46,159(0.22%)#61 | 309,357(0.03%)#511 |
| 62. | Helmetta Borough | 101 | 46,159(0.22%)#62 | 309,357(0.03%)#515 |
| 63. | West Long Branch Borough | 98 | 46,159(0.21%)#63 | 309,357(0.03%)#529 |
| 64. | Morristown | 93 | 46,159(0.20%)#64 | 309,357(0.03%)#552 |
| 65. | Phillipsburg | 91 | 46,159(0.20%)#65 | 309,357(0.03%)#559 |
| 66. | Wallington Borough | 88 | 46,159(0.19%)#66 | 309,357(0.03%)#574 |
| 67. | Ridgefield Borough | 84 | 46,159(0.18%)#67 | 309,357(0.03%)#594 |
| 68. | Allendale Borough | 82 | 46,159(0.18%)#68 | 309,357(0.03%)#610 |
| 69. | Moonachie Borough | 82 | 46,159(0.18%)#69 | 309,357(0.03%)#611 |
| 70. | Elmwood Park Borough | 81 | 46,159(0.18%)#70 | 309,357(0.03%)#615 |
| 71. | West New York | 80 | 46,159(0.17%)#71 | 309,357(0.03%)#621 |
| 72. | South Plainfield Borough | 79 | 46,159(0.17%)#72 | 309,357(0.03%)#629 |
| 73. | Jamesburg Borough | 79 | 46,159(0.17%)#73 | 309,357(0.03%)#631 |
| 74. | Morganville | 79 | 46,159(0.17%)#74 | 309,357(0.03%)#632 |
| 75. | Menlo Park Terrace | 78 | 46,159(0.17%)#75 | 309,357(0.03%)#636 |
| 76. | Cliffside Park Borough | 76 | 46,159(0.16%)#76 | 309,357(0.02%)#650 |
| 77. | Colonia | 75 | 46,159(0.16%)#77 | 309,357(0.02%)#659 |
| 78. | Princeton Meadows | 73 | 46,159(0.16%)#78 | 309,357(0.02%)#672 |
| 79. | Upper Saddle River Borough | 72 | 46,159(0.16%)#79 | 309,357(0.02%)#680 |
| 80. | White Horse | 70 | 46,159(0.15%)#80 | 309,357(0.02%)#700 |
| 81. | Tenafly Borough | 67 | 46,159(0.15%)#81 | 309,357(0.02%)#725 |
| 82. | Andover Borough | 67 | 46,159(0.15%)#82 | 309,357(0.02%)#727 |
| 83. | Lincoln Park Borough | 65 | 46,159(0.14%)#83 | 309,357(0.02%)#739 |
| 84. | Englewood | 64 | 46,159(0.14%)#84 | 309,357(0.02%)#748 |
| 85. | Roselle Park Borough | 64 | 46,159(0.14%)#85 | 309,357(0.02%)#751 |
| 86. | Pompton Lakes Borough | 64 | 46,159(0.14%)#86 | 309,357(0.02%)#752 |
| 87. | Ramblewood | 64 | 46,159(0.14%)#87 | 309,357(0.02%)#754 |
| 88. | Old Tappan Borough | 64 | 46,159(0.14%)#88 | 309,357(0.02%)#755 |
| 89. | Atlantic City | 63 | 46,159(0.14%)#89 | 309,357(0.02%)#757 |
| 90. | Rutherford Borough | 62 | 46,159(0.13%)#90 | 309,357(0.02%)#769 |
| 91. | Mercerville | 62 | 46,159(0.13%)#91 | 309,357(0.02%)#772 |
| 92. | Gloucester City | 62 | 46,159(0.13%)#92 | 309,357(0.02%)#774 |
| 93. | Paramus Borough | 61 | 46,159(0.13%)#93 | 309,357(0.02%)#781 |
| 94. | Freehold Borough | 61 | 46,159(0.13%)#94 | 309,357(0.02%)#786 |
| 95. | Union City | 58 | 46,159(0.13%)#95 | 309,357(0.02%)#809 |
| 96. | Monroe Manor | 58 | 46,159(0.13%)#96 | 309,357(0.02%)#815 |
| 97. | Closter Borough | 57 | 46,159(0.12%)#97 | 309,357(0.02%)#828 |
| 98. | Short Hills | 56 | 46,159(0.12%)#98 | 309,357(0.02%)#837 |
| 99. | Hasbrouck Heights Borough | 54 | 46,159(0.12%)#99 | 309,357(0.02%)#849 |
| 100. | Princeton Junction | 54 | 46,159(0.12%)#100 | 309,357(0.02%)#851 |
Common Questions
What are the Top 10 Cities with the Largest Egyptian Community in New Jersey?
Top 10 Cities with the Largest Egyptian Community in New Jersey are:
#1
5,781
#2
5,387
#3
938
#4
612
#5
544
#6
365
#7
352
#8
314
#9
313
#10
273
What city has the Largest Egyptian Community in New Jersey?
Bayonne has the Largest Egyptian Community in New Jersey with 5,781.
What is the Total Egyptian Population in the State of New Jersey?
Total Egyptian Population in New Jersey is 46,159.
What is the Total Egyptian Population in the United States?
Total Egyptian Population in the United States is 309,357.