Cities with the Highest Percentage of Immigrants from China in New Jersey
RELATED REPORTS & OPTIONS
China
New Jersey
Compare Cities
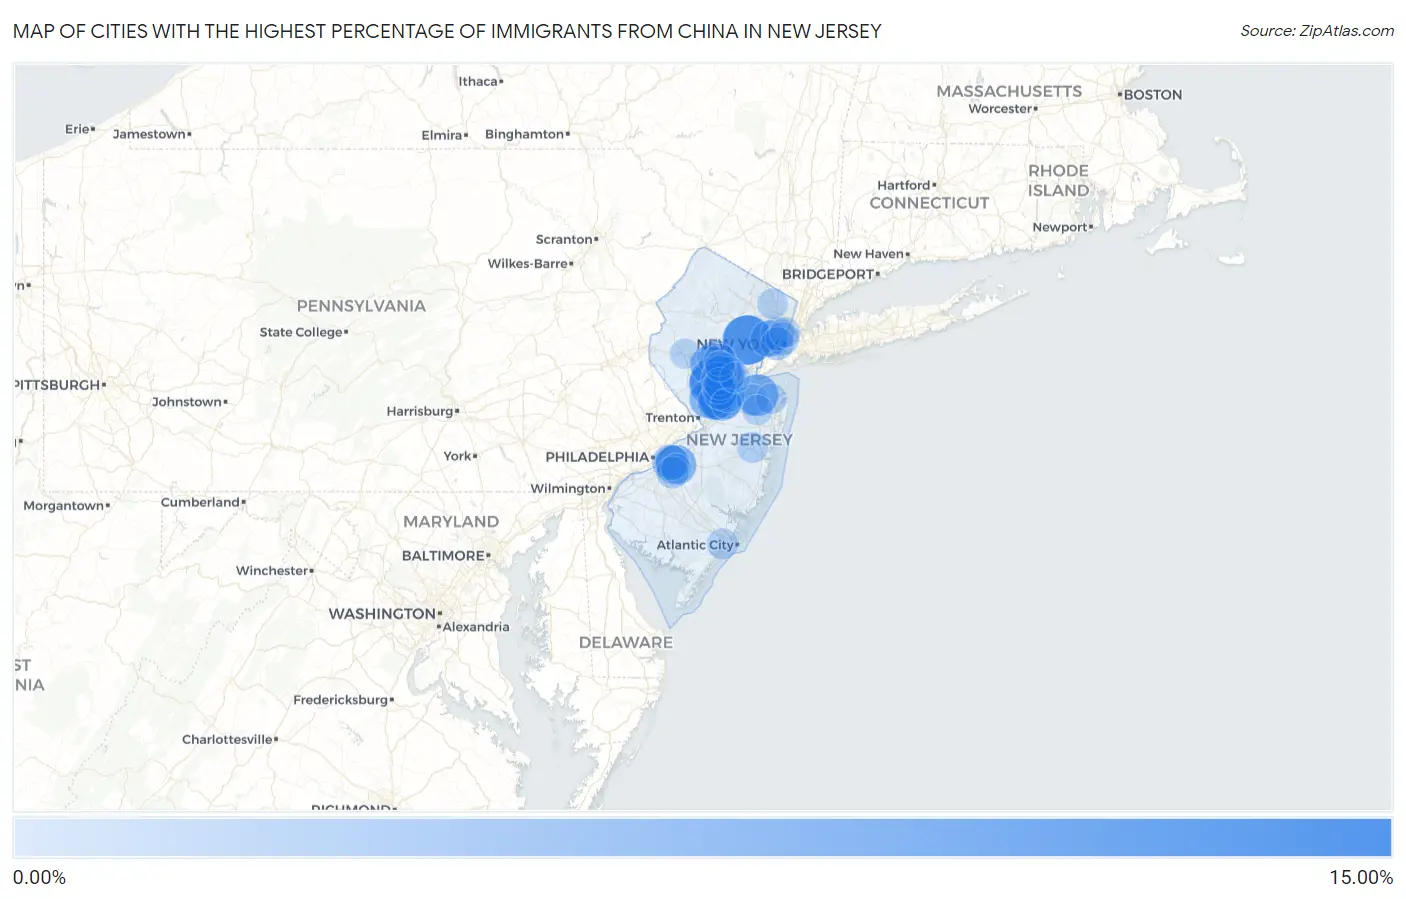
Map of Cities with the Highest Percentage of Immigrants from China in New Jersey
0.00%
15.00%
Cities with the Highest Percentage of Immigrants from China in New Jersey
| City | China | vs State | vs National | |
| 1. | Barnegat Light Borough | 12.18% | 1.14%(+11.0)#1 | 0.85%(+11.3)#46 |
| 2. | Short Hills | 11.93% | 1.14%(+10.8)#2 | 0.85%(+11.1)#50 |
| 3. | Belle Mead | 8.27% | 1.14%(+7.12)#3 | 0.85%(+7.41)#104 |
| 4. | Fort Lee Borough | 8.13% | 1.14%(+6.99)#4 | 0.85%(+7.27)#109 |
| 5. | Harlingen | 7.93% | 1.14%(+6.78)#5 | 0.85%(+7.07)#115 |
| 6. | Highland Park Borough | 7.88% | 1.14%(+6.74)#6 | 0.85%(+7.03)#117 |
| 7. | Morganville | 7.72% | 1.14%(+6.58)#7 | 0.85%(+6.87)#120 |
| 8. | Princeton Meadows | 7.63% | 1.14%(+6.49)#8 | 0.85%(+6.77)#125 |
| 9. | The Hills | 7.52% | 1.14%(+6.38)#9 | 0.85%(+6.67)#128 |
| 10. | Lyons | 7.38% | 1.14%(+6.24)#10 | 0.85%(+6.52)#133 |
| 11. | Englewood Cliffs Borough | 7.14% | 1.14%(+6.00)#11 | 0.85%(+6.29)#144 |
| 12. | Greentree | 6.97% | 1.14%(+5.83)#12 | 0.85%(+6.12)#152 |
| 13. | Deans | 6.96% | 1.14%(+5.82)#13 | 0.85%(+6.10)#155 |
| 14. | Edgewater Borough | 6.59% | 1.14%(+5.44)#14 | 0.85%(+5.73)#166 |
| 15. | Bradley Gardens | 6.58% | 1.14%(+5.44)#15 | 0.85%(+5.73)#167 |
| 16. | Kingston | 6.52% | 1.14%(+5.37)#16 | 0.85%(+5.66)#173 |
| 17. | Princeton | 6.35% | 1.14%(+5.21)#17 | 0.85%(+5.50)#178 |
| 18. | Forsgate | 6.04% | 1.14%(+4.90)#18 | 0.85%(+5.19)#195 |
| 19. | Mickleton | 5.92% | 1.14%(+4.78)#19 | 0.85%(+5.06)#199 |
| 20. | Middlebush | 5.86% | 1.14%(+4.72)#20 | 0.85%(+5.01)#203 |
| 21. | Cedar Knolls | 5.84% | 1.14%(+4.69)#21 | 0.85%(+4.98)#207 |
| 22. | Green Knoll | 5.38% | 1.14%(+4.24)#22 | 0.85%(+4.53)#231 |
| 23. | Parsippany | 5.25% | 1.14%(+4.10)#23 | 0.85%(+4.39)#239 |
| 24. | Mountain Lakes Borough | 5.22% | 1.14%(+4.08)#24 | 0.85%(+4.37)#242 |
| 25. | Mountainside Borough | 5.19% | 1.14%(+4.05)#25 | 0.85%(+4.34)#246 |
| 26. | Plainsboro Center | 5.13% | 1.14%(+3.99)#26 | 0.85%(+4.28)#248 |
| 27. | Harrison | 5.13% | 1.14%(+3.99)#27 | 0.85%(+4.28)#249 |
| 28. | Franklin Center | 4.84% | 1.14%(+3.69)#28 | 0.85%(+3.98)#268 |
| 29. | Ellisburg | 4.71% | 1.14%(+3.57)#29 | 0.85%(+3.86)#281 |
| 30. | Whippany | 4.64% | 1.14%(+3.49)#30 | 0.85%(+3.78)#290 |
| 31. | River Edge Borough | 4.61% | 1.14%(+3.47)#31 | 0.85%(+3.75)#296 |
| 32. | Princeton Junction | 4.35% | 1.14%(+3.21)#32 | 0.85%(+3.50)#325 |
| 33. | Monmouth Junction | 4.04% | 1.14%(+2.90)#33 | 0.85%(+3.19)#356 |
| 34. | Springfield | 4.04% | 1.14%(+2.90)#34 | 0.85%(+3.18)#357 |
| 35. | Keasbey | 3.97% | 1.14%(+2.83)#35 | 0.85%(+3.12)#366 |
| 36. | Roseland Borough | 3.95% | 1.14%(+2.81)#36 | 0.85%(+3.10)#368 |
| 37. | Kingston Estates | 3.91% | 1.14%(+2.77)#37 | 0.85%(+3.06)#376 |
| 38. | Carlstadt Borough | 3.91% | 1.14%(+2.77)#38 | 0.85%(+3.06)#377 |
| 39. | Dayton | 3.90% | 1.14%(+2.76)#39 | 0.85%(+3.04)#379 |
| 40. | Pine Brook | 3.86% | 1.14%(+2.71)#40 | 0.85%(+3.00)#385 |
| 41. | Heathcote | 3.84% | 1.14%(+2.70)#41 | 0.85%(+2.98)#391 |
| 42. | Somerset | 3.83% | 1.14%(+2.69)#42 | 0.85%(+2.98)#392 |
| 43. | Neshanic | 3.77% | 1.14%(+2.63)#43 | 0.85%(+2.92)#398 |
| 44. | Weston | 3.64% | 1.14%(+2.50)#44 | 0.85%(+2.78)#414 |
| 45. | Lake Hiawatha | 3.60% | 1.14%(+2.45)#45 | 0.85%(+2.74)#422 |
| 46. | Tenafly Borough | 3.58% | 1.14%(+2.43)#46 | 0.85%(+2.72)#425 |
| 47. | Secaucus | 3.46% | 1.14%(+2.32)#47 | 0.85%(+2.61)#441 |
| 48. | Alpine Borough | 3.45% | 1.14%(+2.31)#48 | 0.85%(+2.60)#443 |
| 49. | Highlands Borough | 3.40% | 1.14%(+2.26)#49 | 0.85%(+2.55)#457 |
| 50. | Robbinsville Center | 3.40% | 1.14%(+2.26)#50 | 0.85%(+2.55)#458 |
| 51. | Chatham Borough | 3.37% | 1.14%(+2.23)#51 | 0.85%(+2.52)#461 |
| 52. | Hoboken | 3.35% | 1.14%(+2.20)#52 | 0.85%(+2.49)#464 |
| 53. | Regency At Monroe | 3.32% | 1.14%(+2.18)#53 | 0.85%(+2.46)#470 |
| 54. | Rutgers University-Busch Campus | 3.30% | 1.14%(+2.16)#54 | 0.85%(+2.45)#474 |
| 55. | Jersey City | 3.26% | 1.14%(+2.11)#55 | 0.85%(+2.40)#485 |
| 56. | Towaco | 3.22% | 1.14%(+2.08)#56 | 0.85%(+2.37)#489 |
| 57. | Bradley Beach Borough | 3.21% | 1.14%(+2.07)#57 | 0.85%(+2.36)#492 |
| 58. | Blackwells Mills | 3.16% | 1.14%(+2.01)#58 | 0.85%(+2.30)#497 |
| 59. | Troy Hills | 3.13% | 1.14%(+1.99)#59 | 0.85%(+2.28)#503 |
| 60. | Encore At Monroe | 3.09% | 1.14%(+1.95)#60 | 0.85%(+2.24)#512 |
| 61. | New Providence Borough | 3.05% | 1.14%(+1.90)#61 | 0.85%(+2.19)#527 |
| 62. | Leonia Borough | 3.00% | 1.14%(+1.86)#62 | 0.85%(+2.14)#538 |
| 63. | Ten Mile Run | 2.95% | 1.14%(+1.80)#63 | 0.85%(+2.09)#548 |
| 64. | East Newark Borough | 2.91% | 1.14%(+1.76)#64 | 0.85%(+2.05)#557 |
| 65. | Martinsville | 2.89% | 1.14%(+1.75)#65 | 0.85%(+2.04)#559 |
| 66. | Pleasant Plains | 2.86% | 1.14%(+1.71)#66 | 0.85%(+2.00)#575 |
| 67. | Echelon | 2.85% | 1.14%(+1.71)#67 | 0.85%(+1.99)#577 |
| 68. | Othello | 2.73% | 1.14%(+1.58)#68 | 0.85%(+1.87)#613 |
| 69. | Basking Ridge | 2.69% | 1.14%(+1.55)#69 | 0.85%(+1.84)#621 |
| 70. | Palisades Park Borough | 2.69% | 1.14%(+1.55)#70 | 0.85%(+1.84)#622 |
| 71. | Jamesburg Borough | 2.65% | 1.14%(+1.50)#71 | 0.85%(+1.79)#631 |
| 72. | Liberty Corner | 2.62% | 1.14%(+1.47)#72 | 0.85%(+1.76)#636 |
| 73. | Metuchen Borough | 2.55% | 1.14%(+1.41)#73 | 0.85%(+1.70)#655 |
| 74. | Robertsville | 2.41% | 1.14%(+1.27)#74 | 0.85%(+1.56)#694 |
| 75. | Llewellyn Park | 2.35% | 1.14%(+1.21)#75 | 0.85%(+1.50)#711 |
| 76. | Pluckemin | 2.34% | 1.14%(+1.19)#76 | 0.85%(+1.48)#721 |
| 77. | Montvale Borough | 2.32% | 1.14%(+1.18)#77 | 0.85%(+1.46)#731 |
| 78. | Northfield | 2.30% | 1.14%(+1.16)#78 | 0.85%(+1.45)#736 |
| 79. | Leisure Knoll | 2.29% | 1.14%(+1.15)#79 | 0.85%(+1.43)#741 |
| 80. | Upper Saddle River Borough | 2.26% | 1.14%(+1.12)#80 | 0.85%(+1.41)#750 |
| 81. | Oradell Borough | 2.23% | 1.14%(+1.09)#81 | 0.85%(+1.38)#762 |
| 82. | Caldwell Borough | 2.20% | 1.14%(+1.06)#82 | 0.85%(+1.35)#774 |
| 83. | Bridgewater Center | 2.18% | 1.14%(+1.04)#83 | 0.85%(+1.32)#783 |
| 84. | Ringoes | 2.16% | 1.14%(+1.02)#84 | 0.85%(+1.31)#790 |
| 85. | Saddle River Borough | 2.11% | 1.14%(+0.969)#85 | 0.85%(+1.26)#806 |
| 86. | Florham Park Borough | 2.11% | 1.14%(+0.968)#86 | 0.85%(+1.26)#807 |
| 87. | Ridgewood | 2.11% | 1.14%(+0.965)#87 | 0.85%(+1.25)#809 |
| 88. | Closter Borough | 2.10% | 1.14%(+0.961)#88 | 0.85%(+1.25)#812 |
| 89. | Cranbury | 2.10% | 1.14%(+0.956)#89 | 0.85%(+1.24)#816 |
| 90. | Lincroft | 2.06% | 1.14%(+0.918)#90 | 0.85%(+1.21)#834 |
| 91. | Ridgefield Borough | 2.04% | 1.14%(+0.898)#91 | 0.85%(+1.19)#846 |
| 92. | New Brunswick | 2.04% | 1.14%(+0.898)#92 | 0.85%(+1.19)#847 |
| 93. | Emerson Borough | 2.03% | 1.14%(+0.890)#93 | 0.85%(+1.18)#849 |
| 94. | Watchung Borough | 2.01% | 1.14%(+0.868)#94 | 0.85%(+1.16)#866 |
| 95. | Millington | 1.97% | 1.14%(+0.830)#95 | 0.85%(+1.12)#885 |
| 96. | Guttenberg | 1.97% | 1.14%(+0.829)#96 | 0.85%(+1.12)#887 |
| 97. | Springdale | 1.95% | 1.14%(+0.805)#97 | 0.85%(+1.09)#898 |
| 98. | East Freehold | 1.94% | 1.14%(+0.799)#98 | 0.85%(+1.09)#903 |
| 99. | Finderne | 1.94% | 1.14%(+0.796)#99 | 0.85%(+1.08)#906 |
| 100. | Annandale | 1.89% | 1.14%(+0.746)#100 | 0.85%(+1.03)#935 |
Common Questions
What are the Top 10 Cities with the Highest Percentage of Immigrants from China in New Jersey?
Top 10 Cities with the Highest Percentage of Immigrants from China in New Jersey are:
#1
11.93%
#2
8.27%
#3
7.93%
#4
7.72%
#5
7.63%
#6
6.97%
#7
6.58%
#8
6.52%
#9
6.35%
#10
5.86%
What city has the Highest Percentage of Immigrants from China in New Jersey?
Short Hills has the Highest Percentage of Immigrants from China in New Jersey with 11.93%.
What is the Percentage of Immigrants from China in the State of New Jersey?
Percentage of Immigrants from China in New Jersey is 1.14%.
What is the Percentage of Immigrants from China in the United States?
Percentage of Immigrants from China in the United States is 0.85%.